SlideShare une entreprise Scribd logo
1  sur  5
www.colliers.com/houston
Q2 2014 | INDUSTRIAL MARKET
2%
3%
4%
5%
6%
7%
8%
-500,000
0
500,000
1,000,000
1,500,000
2,000,000
2,500,000
3,000,000
3,500,000
Absorption New Supply Vacancy
Houston’s industrial market remains one of the healthiest U.S. industrial
markets, its continued expansion sustained primarily due to the growth in the
oil and gas industry. Texas is expected to produce more oil and gas than all
but one of the OPEC nations in 2014 due to the booming Eagle Ford Shale
and Permian Basin, and Houston’s industrial real estate market will benefit
from that rapidly increasing production.
During the second quarter, 1.6M SF of Houston’s industrial inventory was
absorbed, bringing year-to-date net absorption to a positive 3.3M SF.
Industrial leasing activity which includes renewals, reached 3.3M SF, almost
1M SF less than seen in the previous quarter. 2.6M SF of new product
delivered during the second quarter, pushing 2014 year-to-date deliveries to
5.6M SF. Additionally, 3.9M SF of industrial space is currently under
construction. Houston’s average industrial vacancy rate remained
unchanged between quarters at 5.5% and increased 60 basis points from
4.9% to 5.5%, year to date. The citywide average quoted industrial rental rate
decreased 0.3% between quarters from $6.11 to $6.09 per SF NNN, and
increased 5.0% on a year-over-year basis from $5.80 per SF NNN.
The Houston metropolitan area added 93,300 jobs between May 2013 and
May 2014, an annual increase of 3.3% over the prior year’s job growth. Local
economists have forecast 2014 job growth to remain strong, expecting
between 68,000 and 72,000 new jobs. Houston’s unemployment rate fell to
5.0% from 6.1% one year ago. Houston area home sales were down by
7.3% between May 2013 and May 2014, the first decline in the past 34
months. The reduction was due almost primarily to a lack of inventory.
Houston’s economy is expected to remain strong in 2014 due to healthy job
growth and continued expansion in the energy sector.
RESEARCH & FORECAST REPORT
HOUSTON INDUSTRIAL MARKET
ABSORPTION, NEW SUPPLY & VACANCY RATES
Houston’s Industrial Market Delivers 5.6M SF of New
Inventory in the First Half of 2014
HOUSTON INDUSTRIAL
MARKET INDICATORS
Q2 2013 Q2 2014
CITYWIDE NET
ABSORPTION (SF) 1.7M 1.6M
CITYWIDE AVERAGE
VACANCY 4.9% 5.5%
CITYWIDE AVERAGE
RENTAL RATE $5.80 $6.09
SF DELIVERED 1.7M 2.6M
SF UNDER
CONSTRUCTION 4.3M 3.9M
Houston
UNEMPLOYMENT 5/13 5/14
HOUSTON 6.1% 5.0%
TEXAS 6.3% 5.1%
U.S. 7.3% 6.1%
JOB GROWTH
ANNUAL
CHANGE
# OF JOBS
ADDED
HOUSTON 3.3% 93.3K
TEXAS 3.4% 375.3K
U.S. 1.8% 2.4M
JOB GROWTH & UNEMPLOYMENT
(Not Seasonally Adjusted)
RESEARCH & FORECAST REPORT | Q2 2014 | HOUSTON INDUSTRIAL MARKET
COLLIERS INTERNATIONAL | P.2
Vacancy & Availability
Houston’s industrial vacancy rate
remained unchanged between
quarters at 5.5%, and increased by 60
basis points from 4.9% to 5.5%, year
to date. At the end of the second
quarter, Houston had 26.8M SF of
vacant industrial space. Among the
major industrial corridors, the
Northeast Corridor has the lowest
vacancy rate at 3.2%, followed by the
Northwest Corridor at 4.1% and then
the Southern Corridor at 4.2%. The
largest concentration of vacancy is
located in the North Corridor, with an
8.0% vacancy rate.
Houston’s industrial construction
pipeline had 3.9M SF of projects
underway at the end of the second
quarter, the majority of which being
spec development. The largest
project under construction is
Panattoni’s 441,000-SF spec
warehouse located on N. Gessner in
the Northwest Corridor. A list of
buildings currently under construction
can be found on Page 4 of this report.
Rental Rates
According to CoStar, our data service
provider, Houston’s citywide average
quoted industrial rental rate for all
product types decreased 0.3% from
$6.11 per SF NNN in the first quarter
to $6.09 per SF NNN in the second
quarter. According to Colliers’ internal
data, actual lease transactions are in
the $4.44 – $4.92 per SF NNN range
for newer bulk industrial spaces, while
flex rates are ranging from $6.60 to
$9.00 per SF, depending on the
allowance for tenant improvements
and the location of the property. By
property type, the average quoted
NNN rental rates are as follows: $5.71
per SF for Warehouse Distribution
space; $4.34 per SF for Bulk Logistics
space; $10.11 per SF for Flex/Service
space; with Tech/R&D space
averaging $10.87 per SF, according
to CoStar.
Absorption & Demand
Houston’s industrial market posted
1.6M SF of positive net absorption in
the second quarter, with the North
Corridor submarket contributing the
largest amount, 821,071 SF, followed
by the Northwest Corridor which
posted 284,086 SF, the Southwest
Corridor at 259,871 SF, and the
Southern Corridor at 221,969 SF of
net positive absorption.
There were several major tenant
move-ins contributing to net
absorption gains in the second
quarter, including Kauffman Tire
(91,200 SF); Atlanta Food
International (84,600 SF); Poly Bags
(62,600 SF); International Rags, Ltd.
(62,500 SF); Gas Process Equipment
Co. (47,500 SF); FreshPak (44,800
SF); Chadwell Supply (43,500 SF);
ToolMart (38,100 SF) and Nordyne
LLC (37,500 SF).
Leasing
Houston’s industrial leasing activity
reached 3.3M SF in the second
quarter. A list of select second
quarter industrial lease transactions
are included in the table below.
1 Renewal
2 Expansion
3 Sublease
4Pre-lease proposed or under construction
Building Name/Address Submarket SF Tenant Lease Date
1701 Crosspoint Avenue Southwest Far 72,505 BASF1 Jun-14
Carson Commerce Center East-Southeast Far 67,742 Elliott Electric Co. Apr-14
11629 N Houston Rosslyn Rd Hwy 290/Tomball Pky 47,500 Gas Process Equipment Co. Apr-14
8615 North Loop E Northeast Hwy 90 36,352 RL Building Supply, LLC May-14
Sam Houston Pkwy Dist Ctr Northwest Inner Loop 33,730 Graniti Vicentia, LLC May-14
Udelson Industrial Park North Outer Loop 30,000 Max Torque, LLC May-14
East Belt Business Park 4 East-Southeast Far 25,267 Jotun Paints Apr-14
Candlebridge Park North Hardy Toll Road Ind 20,400 Delta Subsea Apr-14
Clay-Campbell Business Park Northwest Inner Loop 19,950 Prairie Supply1
Jun-14
Greenspoint Business Center North Hardy Toll Road Ind 17,775 Tellworks Communications Jun-14
Northwoods Industrial Park West Outer Loop 13,125 Gulf Coast Conversions1
Apr-14
Q2 2014 SELECT INDUSTRIAL LEASES
RESEARCH & FORECAST REPORT | Q2 2014 | HOUSTON INDUSTRIAL MARKET
COLLIERS INTERNATIONAL | P.3
Houston Industrial Market Summary
Sales Activity
Q2 2014
Total Sales : $570M
No. of Properties: 81
Total SF: 4.3M
Average $/SF: $45
Average Cap Rate: 8.6% Falcon Southwest sold a 377,752-SF
12-building industrial warehouse
portfolio to Hartman Mitchelldale
Business Park, LLC for $19.2M or $51
per SF. The portfolio is 87.2% leased
to various tenants. The buildings in
the industrial park were built in 1979
and remodeled in 2004.
C&W Investments sold a 151,260-SF
Class B industrial warehouse to STAG
Industrial Management, LLC for $8.9M
or $59 per SF. The building is 100%
leased to Smart Warehousing through
April 2021. The reported cap rate was
8.6%.
Sources: Real Capital Analytics; CoStar Comps
5400 Mitchelldale St 12614 Hempstead Rd
Market Rentable Area
Direct
Vacant SF
Direct
Vacancy
Rate
Sublet
Vacant SF
Sublet
Vacancy
Rate
Total Vacant
SF
Total
Vacancy
Rate
2Q14 Net
Absorption
1Q14 Net
Absorption
2Q14
Completions
1Q14
Completions
SF Under
Construction
Greater Houston Total 491,720,505 26,181,150 5.3% 637,355 0.1% 26,818,505 5.5% 1,583,925 1,755,866 2,645,694 2,951,422 3,930,859
CBD-NW Inner Loop 11,500,406 559,996 4.9% 31,860 0.3% 591,856 5.1% 62,709 15,767 - - -
Downtown 31,814,637 1,751,102 5.5% - 0.0% 1,751,102 5.5% (1,720) 101,850 - - -
North Inner Loop 5,076,141 534,906 10.5% - 0.0% 534,906 10.5% - (21,525) - - -
Southwest Inner Loop 7,198,717 61,171 0.8% - 0.0% 61,171 0.8% (15,601) - - - -
CBD Corridor Total 55,589,901 2,907,175 5.2% 31,860 0.1% 2,939,035 5.3% 45,388 96,092 - - -
North Fwy/Tomball Pky 17,347,742 1,489,803 8.6% 5,346 0.0% 1,495,149 8.6% 225,898 (66,181) 873,068 250,255 926,180
North Hardy Toll Rd 29,108,673 2,747,187 9.4% 59,122 0.2% 2,806,309 9.6% 441,818 495,206 449,474 797,506 423,440
North Outer Loop 18,791,750 1,386,001 7.4% 1,950 0.0% 1,387,951 7.4% 89,657 178,203 381,250 174,434 120,000
The Woodlands/Conroe 14,413,958 693,531 4.8% - 0.0% 693,531 4.8% 63,698 17,420 18,800 166,900 -
North Corridor Total 79,662,123 6,316,522 7.9% 66,418 0.1% 6,382,940 8.0% 821,071 624,648 1,722,592 1,389,095 1,469,620
Northeast Hwy 321 1,201,673 - 0.0% - 0.0% - 0.0% 0 600 - - -
Northeast Hwy 90 15,937,684 448,855 2.8% 136,200 0.9% 585,055 3.7% (54,458) (129,095) - 41,356 -
Northeast I-10 3,672,845 30,652 0.8% - 0.0% 30,652 0.8% 109,628 12,801 - - -
Northeast Inner Loop 11,591,910 430,372 3.7% - 0.0% 430,372 3.7% (7,842) 11,069 - - -
Northeast Corridor Total 32,404,112 909,879 2.8% 136,200 0.4% 1,046,079 3.2% 47,328 (104,625) - 41,356 -
Hwy 290/Tomball Pky 16,056,280 704,622 4.4% 20,541 0.1% 725,163 4.5% 154,657 72,540 - 105,358 1,578,981
Northwest Hwy 6 4,158,737 141,314 3.4% 24,000 0.6% 165,314 4.0% (24,086) (25,392) - - 357,887
Northwest Inner Loop 58,686,032 2,301,129 3.9% 74,554 0.1% 2,375,683 4.0% 22,402 (34,334) - 177,448 -
Northwest Near 17,187,843 462,963 2.7% 49,824 0.3% 512,787 3.0% 26,623 597,368 - 255,962 .
Northwest Outlier 17,160,063 1,054,831 6.1% - 0.0% 1,054,831 6.1% 106,728 80,354 79,743 63,382 64,313
West Outer Loop 23,683,929 707,903 3.0% 23,600 0.1% 731,503 3.1% (2,238) 83,495 189,125 332,581 86,250
Northwest Corridor Total 136,932,884 5,372,762 3.9% 192,519 0.1% 5,565,281 4.1% 284,086 774,031 268,868 934,731 2,087,431
East I-10 Outer Loop 13,047,099 264,136 2.0% - 0.0% 264,136 2.0% (1,000) (28,000) - - -
East-Southeast Far 47,305,783 4,918,042 10.4% 7,078 0.0% 4,925,120 10.4% (41,123) (76,120) 91,140 385,462 .
Southeast Outer Loop 18,374,310 496,361 2.7% 117,573 0.6% 613,934 3.3% (53,665) 33,741 - - -
Southeast Corridor Total 78,727,192 5,678,539 7.2% 124,651 0.2% 5,803,190 7.4% (95,788) (70,379) 91,140 385,462 -
South Highway 35 31,853,434 1,071,713 3.4% 23,600 0.1% 1,095,313 3.4% 201,820 384,427 327,294 143,390 283,808
South Inner Loop 12,771,468 762,132 6.0% - 0.0% 762,132 6.0% 20,149 51,596 - - -
Southern Corridor Total 44,624,902 1,833,845 4.1% 23,600 0.1% 1,857,445 4.2% 221,969 436,023 327,294 143,390 283,808
Highway 59/Highway 90 22,209,481 1,037,827 4.7% 44,500 0.2% 1,082,327 4.9% 66,434 23,694 208,800 30,000 90,000
Southwest Far 10,080,924 536,531 5.3% - 0.0% 536,531 5.3% 89,030 (45,617) - - -
Southwest Outer Loop 12,708,006 624,798 4.9% - 0.0% 624,798 4.9% 120,564 (72,481) - - -
Sugar Land/Ft Bend Co 18,780,980 963,272 5.1% 17,607 0.1% 980,879 5.2% (16,157) 94,480 27,000 27,388 -
Total Southwest Corridor 63,779,391 3,162,428 5.0% 62,107 0.1% 3,224,535 5.1% 259,871 76 235,800 57,388 90,000
HOUSTON INDUSTRIAL MARKET STATISTICAL SUMMARY
Q2 2014
RESEARCH & FORECAST REPORT | Q2 2014 | HOUSTON INDUSTRIAL MARKET
COLLIERS INTERNATIONAL | P.4
Q2 2014 Industrial Under Construction – 60,000 SF or greater
Q2 2014 Industrial Deliveries – 60,000 SF or greater
SUBMARKET BUILDING ADDRESS RBA
%
LEASED DEVELOPER
ESTIMATED
DELIVERY
DATE
Hwy 290/Tomball Pky Ind 11810 N Gessner Rd 441,000 0.0% Panattoni Oct-14
Hwy 290/Tomball Pky Ind 8303 Fallbrook Dr 400,250 0.0% Liberty Property Trust Jul-14
Hwy 290/Tomball Pky Ind Gessner Road & Beltway 8 362,180 0.0% DCT Industrial Trust Nov-14
Northwest Hwy 6 Ind 20710 Hempstead Rd 357,887 0.0% Duke Realty Corporation Sep-14
North Fwy/Tomball Pky Ind 4800 W Greens Rd 350,820 0.0% Davis Commercial Development Oct-14
North Fwy/Tomball Pky Ind 660 Greens Pky 350,000 100.0% Holder Construction Mar-15
North Fwy/Tomball Pky Ind 300 Airtex Dr 225,360 0.0% Pontikes Development Dec-14
South Hwy 35 Ind 9254 Park South Vw 193,741 0.0% Transwestern Aug-14
Hwy 290/Tomball Pky Ind 11720 N Gessner Rd 155,400 0.0% Panattoni Dec-14
North Hardy Toll Road Ind 400 Century Plaza Dr 149,760 0.0% Avera Companies Aug-14
North Hardy Toll Road Ind 2020 Greens Rd 147,112 0.0% IDV Investment & Development VenutresDec-14
North Hardy Toll Road Ind 14820 North Fwy 126,568 0.0% DCT Industrial Trust Nov-14
North Outer Loop Ind JKF/Kennedy Greens Blvd 120,000 100.0% Clay Development Construction Aug-14
Hwy 290/Tomball Pky Ind 8780 West Rd 100,275 100.0% EastGroup Properties Sep-14
South Hwy 35 Ind 9258 Park South Vw 90,067 100.0% Transwestern Jul-14
Hwy 59/Hwy 90 (Alt) Ind 10401 S Sam Houston Pky W 90,000 0.0% ICO Commercial Sep-14
West Outer Loop Ind 5737 Brittmoore Rd 86,250 0.0% Taten Real Estate Parters Dec-14
Northwest Outliers Ind 22240 Merchants Way 64,313 0.0% EastGroup Properties Jul-14
Hwy 290/Tomball Pky Ind 8790 West Rd 63,000 0.0% EastGroup Properties Sep-14
SUBMARKET BUILDING ADDRESS RBA
%
LEASED DEVELOPER DELIVERED
North Fwy/Tomball Pky 10565 Greens Crossing Blvd 600,750 82.9% Hines Jun-14
North Hardy Toll Road 8039 Humble Westfield Rd 250,200 0.0% K2 Logistics Jun-14
North Outer Loop 121 Esplanade 224,550 0.0% IDI Jun-14
South Hwy 35 11951 Spectrum Blvd 150,000 100.0% Unknown Jun-14
South Hwy 35 7232 Airport Blvd 137,297 100.0% Unknown Dec-13
Hwy 59/Hwy 90(Alt) 13615 S Gessner Rd 123,300 0.0% Stream Realty Partners Apr-14
West Outer Loop 5737 Brittmoore Rd 122,500 100.0% Taten Real Estate Partners Jun-14
North Fwy/Tomball Pky 433 Plaza Verde Dr 120,159 0.0% Hines May-14
North Fwy/Tomball Pky 545 Plaza Verde Dr 120,159 0.0% Hines May-14
North Outer Loop 71 Esplanade 106,700 0.0% IDI Jun-14
North Hardy Toll Road 15892 Diplomatic Plaza Dr 94,074 0.0% EastGroup Properties Jun-14
Hwy 59/Hwy 90(Alt) 13721 S Gessner Rd 85,500 44.5% Stream Realty Partners Apr-14
Northwest Outliers 22110 Merchants Way 67,743 54.1% InSite Realty Partners Apr-14
RESEARCH & FORECAST REPORT | Q2 2014 | HOUSTON INDUSTRIAL MARKET
Accelerating success.
COLLIERS INTERNATIONAL
1233 W. Loop South
Suite 900
Houston, Texas 77027
Main +1 713 222 2111
LISA R. BRIDGES
Director of Market Research | Houston
Direct +1 713 830 2125
Fax +1 713 830 2118
lisa.bridges@colliers.com
The Colliers Advantage
Enterprising Culture
Colliers International is a leader in global real estate services,
defined by our spirit of enterprise. Through a culture of service
excellence and a shared sense of initiative, we integrate the
resources of real estate specialists worldwide to accelerate the
success of our partners.
When you choose to work with Colliers, you choose to work
with the best. In addition to being highly skilled experts in their
field, our people are passionate about what they do. And they
know we are invested in their success just as much as we are
in our clients’ success.
This is evident throughout our platform—from Colliers University, our proprietary education and professional development platform, to our
client engagement strategy that encourages cross-functional service integration, to our culture of caring.
We connect through a shared set of values that shape a collaborative environment throughout our organization that is unsurpassed in the
industry. That’s why we attract top recruits and have one of the highest retention rates in the industry. Colliers International has also been
recognized as one of the “best places to work” by top business organizations in many of our markets across the globe.
Colliers International offers a comprehensive portfolio of real estate services to occupiers, owners and investors on a local, regional, national
and international basis.
*Information herein has been obtained from sources deemed reliable, however its accuracy cannot be guaranteed.
COLLIERS INTERNATIONAL | P. 5

Contenu connexe

Tendances

Q3 2015 Houston Industrial Market Research & Forecast Report
Q3 2015 Houston Industrial Market Research & Forecast ReportQ3 2015 Houston Industrial Market Research & Forecast Report
Q3 2015 Houston Industrial Market Research & Forecast ReportColliers International | Houston
 
Q1 2013 Houston Industrial Market Report
Q1 2013 Houston Industrial Market ReportQ1 2013 Houston Industrial Market Report
Q1 2013 Houston Industrial Market ReportCoy Davidson
 
Q1 2013 houston_industrial_market_report
Q1 2013 houston_industrial_market_reportQ1 2013 houston_industrial_market_report
Q1 2013 houston_industrial_market_reportLisa Bridges
 
St. Louis Industrial Outlook Q3 2016
St. Louis Industrial Outlook Q3 2016St. Louis Industrial Outlook Q3 2016
St. Louis Industrial Outlook Q3 2016Blaise Tomazic
 
4Q15 houston industrial report
4Q15 houston industrial report4Q15 houston industrial report
4Q15 houston industrial reportBob Berry, SIOR
 
Q1 2021 | Austin Industrial | Research & Forecast Commericial Real Estate Report
Q1 2021 | Austin Industrial | Research & Forecast Commericial Real Estate ReportQ1 2021 | Austin Industrial | Research & Forecast Commericial Real Estate Report
Q1 2021 | Austin Industrial | Research & Forecast Commericial Real Estate ReportColliers International | Houston
 
Houston industrial market report 3 q 10
Houston industrial market report 3 q 10Houston industrial market report 3 q 10
Houston industrial market report 3 q 10Coy Davidson
 
Q2 2015 Austin Industrial Market Research & Forecast Report
Q2 2015 Austin Industrial Market Research & Forecast ReportQ2 2015 Austin Industrial Market Research & Forecast Report
Q2 2015 Austin Industrial Market Research & Forecast ReportColliers International | Houston
 
2019 Q4 Industrial St. Louis Report Colliers
2019 Q4 Industrial St. Louis Report Colliers2019 Q4 Industrial St. Louis Report Colliers
2019 Q4 Industrial St. Louis Report ColliersColliersSTL
 

Tendances (19)

Q4 2016 Houston Industrial Research & Forecast Report
Q4 2016 Houston Industrial Research & Forecast Report Q4 2016 Houston Industrial Research & Forecast Report
Q4 2016 Houston Industrial Research & Forecast Report
 
Q3 2015 Houston Industrial Market Research & Forecast Report
Q3 2015 Houston Industrial Market Research & Forecast ReportQ3 2015 Houston Industrial Market Research & Forecast Report
Q3 2015 Houston Industrial Market Research & Forecast Report
 
Q1 2013 Houston Industrial Market Report
Q1 2013 Houston Industrial Market ReportQ1 2013 Houston Industrial Market Report
Q1 2013 Houston Industrial Market Report
 
Q1 2013 houston_industrial_market_report
Q1 2013 houston_industrial_market_reportQ1 2013 houston_industrial_market_report
Q1 2013 houston_industrial_market_report
 
Q1 2013 Houston Industrial Market Research Report
Q1 2013 Houston Industrial Market Research ReportQ1 2013 Houston Industrial Market Research Report
Q1 2013 Houston Industrial Market Research Report
 
Q1 2018 | Houston Industrial | Research & Forecast Report
Q1 2018 | Houston Industrial | Research & Forecast ReportQ1 2018 | Houston Industrial | Research & Forecast Report
Q1 2018 | Houston Industrial | Research & Forecast Report
 
Q3 2020 | Austin Industrial | Research & Forecast Report
Q3 2020 | Austin Industrial | Research & Forecast ReportQ3 2020 | Austin Industrial | Research & Forecast Report
Q3 2020 | Austin Industrial | Research & Forecast Report
 
St. Louis Industrial Outlook Q3 2016
St. Louis Industrial Outlook Q3 2016St. Louis Industrial Outlook Q3 2016
St. Louis Industrial Outlook Q3 2016
 
4Q15 houston industrial report
4Q15 houston industrial report4Q15 houston industrial report
4Q15 houston industrial report
 
Q3 2017 | Houston Industrial | Research & Forecast Report
Q3 2017 | Houston Industrial | Research & Forecast ReportQ3 2017 | Houston Industrial | Research & Forecast Report
Q3 2017 | Houston Industrial | Research & Forecast Report
 
Q1 2021 | Austin Industrial | Research & Forecast Commericial Real Estate Report
Q1 2021 | Austin Industrial | Research & Forecast Commericial Real Estate ReportQ1 2021 | Austin Industrial | Research & Forecast Commericial Real Estate Report
Q1 2021 | Austin Industrial | Research & Forecast Commericial Real Estate Report
 
Houston industrial market report 3 q 10
Houston industrial market report 3 q 10Houston industrial market report 3 q 10
Houston industrial market report 3 q 10
 
Q1 2020 | Austin Industrial | Research & Forecast Report
Q1 2020 | Austin Industrial | Research & Forecast ReportQ1 2020 | Austin Industrial | Research & Forecast Report
Q1 2020 | Austin Industrial | Research & Forecast Report
 
Q1 2019 | Houston Industrial | Research & Forecast Report
Q1 2019 | Houston Industrial | Research & Forecast ReportQ1 2019 | Houston Industrial | Research & Forecast Report
Q1 2019 | Houston Industrial | Research & Forecast Report
 
Q2 2015 Austin Industrial Market Research & Forecast Report
Q2 2015 Austin Industrial Market Research & Forecast ReportQ2 2015 Austin Industrial Market Research & Forecast Report
Q2 2015 Austin Industrial Market Research & Forecast Report
 
Q1 2019 | Austin Industrial | Research & Forecast Report
Q1 2019 | Austin Industrial | Research & Forecast ReportQ1 2019 | Austin Industrial | Research & Forecast Report
Q1 2019 | Austin Industrial | Research & Forecast Report
 
Q2 2013 Houston Office Market Research Report
Q2 2013 Houston Office Market Research ReportQ2 2013 Houston Office Market Research Report
Q2 2013 Houston Office Market Research Report
 
2019 Q4 Industrial St. Louis Report Colliers
2019 Q4 Industrial St. Louis Report Colliers2019 Q4 Industrial St. Louis Report Colliers
2019 Q4 Industrial St. Louis Report Colliers
 
Q4 2017 | Austin Industrial | Research & Forecast Report
Q4 2017 | Austin Industrial | Research & Forecast ReportQ4 2017 | Austin Industrial | Research & Forecast Report
Q4 2017 | Austin Industrial | Research & Forecast Report
 

En vedette

yahoo annual reports 2000
yahoo annual reports 2000yahoo annual reports 2000
yahoo annual reports 2000finance32
 
ClearedJobs.Net Cleared Job Fair Job Seeker's Handbook March 18th
ClearedJobs.Net Cleared Job Fair Job Seeker's Handbook March 18thClearedJobs.Net Cleared Job Fair Job Seeker's Handbook March 18th
ClearedJobs.Net Cleared Job Fair Job Seeker's Handbook March 18thClearedJobs.Net
 
EAGLE® XG ENUM Server
EAGLE® XG ENUM ServerEAGLE® XG ENUM Server
EAGLE® XG ENUM Serverenumplatform
 
Sheppard Toronto
Sheppard TorontoSheppard Toronto
Sheppard TorontoChris Fyvie
 
2131 yonge street_(art_shoppe)_flyer
2131 yonge street_(art_shoppe)_flyer2131 yonge street_(art_shoppe)_flyer
2131 yonge street_(art_shoppe)_flyerChris Fyvie
 
6 Reasons To Embrace Cloud Computing Now
6 Reasons To Embrace Cloud Computing Now6 Reasons To Embrace Cloud Computing Now
6 Reasons To Embrace Cloud Computing NowHudson IT
 
Hudson CIO Series: 6 Reasons for Cloud Computing
Hudson CIO Series: 6 Reasons for Cloud ComputingHudson CIO Series: 6 Reasons for Cloud Computing
Hudson CIO Series: 6 Reasons for Cloud Computingguest51aa87
 
Dance! Dance! Dance!
Dance! Dance! Dance!Dance! Dance! Dance!
Dance! Dance! Dance!Silvia125
 
Oracle magazine Mayo-Junio 2014
Oracle magazine Mayo-Junio 2014Oracle magazine Mayo-Junio 2014
Oracle magazine Mayo-Junio 2014Erik Gur
 
Sotheby's Farm and Ranch, Luxury Home Listing Presentation
Sotheby's Farm and Ranch, Luxury Home Listing PresentationSotheby's Farm and Ranch, Luxury Home Listing Presentation
Sotheby's Farm and Ranch, Luxury Home Listing PresentationEric West
 
Corporate Clientele
Corporate ClienteleCorporate Clientele
Corporate ClienteleABCey
 
181 fremont
181 fremont181 fremont
181 fremontaxiant
 
Lennard listings april 2013
Lennard listings april 2013Lennard listings april 2013
Lennard listings april 2013Chris Fyvie
 
8071 Sepulveda blvd. and 8040 Langdon Avenue, Van Nuys, CA - Complete package
8071 Sepulveda blvd. and 8040 Langdon Avenue, Van Nuys, CA -  Complete package8071 Sepulveda blvd. and 8040 Langdon Avenue, Van Nuys, CA -  Complete package
8071 Sepulveda blvd. and 8040 Langdon Avenue, Van Nuys, CA - Complete packagearivani
 

En vedette (17)

App Connect
App ConnectApp Connect
App Connect
 
yahoo annual reports 2000
yahoo annual reports 2000yahoo annual reports 2000
yahoo annual reports 2000
 
ClearedJobs.Net Cleared Job Fair Job Seeker's Handbook March 18th
ClearedJobs.Net Cleared Job Fair Job Seeker's Handbook March 18thClearedJobs.Net Cleared Job Fair Job Seeker's Handbook March 18th
ClearedJobs.Net Cleared Job Fair Job Seeker's Handbook March 18th
 
EAGLE® XG ENUM Server
EAGLE® XG ENUM ServerEAGLE® XG ENUM Server
EAGLE® XG ENUM Server
 
Sheppard Toronto
Sheppard TorontoSheppard Toronto
Sheppard Toronto
 
2131 yonge street_(art_shoppe)_flyer
2131 yonge street_(art_shoppe)_flyer2131 yonge street_(art_shoppe)_flyer
2131 yonge street_(art_shoppe)_flyer
 
6 Reasons To Embrace Cloud Computing Now
6 Reasons To Embrace Cloud Computing Now6 Reasons To Embrace Cloud Computing Now
6 Reasons To Embrace Cloud Computing Now
 
Hudson CIO Series: 6 Reasons for Cloud Computing
Hudson CIO Series: 6 Reasons for Cloud ComputingHudson CIO Series: 6 Reasons for Cloud Computing
Hudson CIO Series: 6 Reasons for Cloud Computing
 
Entrepreneur Group
Entrepreneur GroupEntrepreneur Group
Entrepreneur Group
 
Dance! Dance! Dance!
Dance! Dance! Dance!Dance! Dance! Dance!
Dance! Dance! Dance!
 
Oracle magazine Mayo-Junio 2014
Oracle magazine Mayo-Junio 2014Oracle magazine Mayo-Junio 2014
Oracle magazine Mayo-Junio 2014
 
Sotheby's Farm and Ranch, Luxury Home Listing Presentation
Sotheby's Farm and Ranch, Luxury Home Listing PresentationSotheby's Farm and Ranch, Luxury Home Listing Presentation
Sotheby's Farm and Ranch, Luxury Home Listing Presentation
 
Corporate Clientele
Corporate ClienteleCorporate Clientele
Corporate Clientele
 
181 fremont
181 fremont181 fremont
181 fremont
 
Lennard listings april 2013
Lennard listings april 2013Lennard listings april 2013
Lennard listings april 2013
 
8071 Sepulveda blvd. and 8040 Langdon Avenue, Van Nuys, CA - Complete package
8071 Sepulveda blvd. and 8040 Langdon Avenue, Van Nuys, CA -  Complete package8071 Sepulveda blvd. and 8040 Langdon Avenue, Van Nuys, CA -  Complete package
8071 Sepulveda blvd. and 8040 Langdon Avenue, Van Nuys, CA - Complete package
 
Entrepreneur Group
Entrepreneur GroupEntrepreneur Group
Entrepreneur Group
 

Similaire à Q2 2014 Houston Industrial Market Report

Austin’s industrial market closes 2018 with new buildings and high absorption
Austin’s industrial market closes 2018 with new buildings and high absorptionAustin’s industrial market closes 2018 with new buildings and high absorption
Austin’s industrial market closes 2018 with new buildings and high absorptionColliers International | Houston
 
Q4 2015 Austin Industrial Market Research & Forecast Report
Q4 2015 Austin Industrial Market Research & Forecast ReportQ4 2015 Austin Industrial Market Research & Forecast Report
Q4 2015 Austin Industrial Market Research & Forecast ReportColliers International | Houston
 
2013 1 q_houston_retail__market_report
2013 1 q_houston_retail__market_report2013 1 q_houston_retail__market_report
2013 1 q_houston_retail__market_reportLisa Bridges
 
Q1 2013 Houston Retail Market Report
Q1 2013 Houston Retail Market ReportQ1 2013 Houston Retail Market Report
Q1 2013 Houston Retail Market ReportCoy Davidson
 
St. Louis Industrial Outlook Q3 2016
St. Louis Industrial Outlook Q3 2016St. Louis Industrial Outlook Q3 2016
St. Louis Industrial Outlook Q3 2016Blaise Tomazic
 

Similaire à Q2 2014 Houston Industrial Market Report (15)

Q3 2019 | Austin Industrial | Research & Forecast Report
Q3 2019 | Austin Industrial | Research & Forecast ReportQ3 2019 | Austin Industrial | Research & Forecast Report
Q3 2019 | Austin Industrial | Research & Forecast Report
 
Q1 2014 Houston Office Market Research Report
Q1 2014 Houston Office Market Research ReportQ1 2014 Houston Office Market Research Report
Q1 2014 Houston Office Market Research Report
 
Q1 2018 austin_industrial_market_research_report
Q1 2018 austin_industrial_market_research_reportQ1 2018 austin_industrial_market_research_report
Q1 2018 austin_industrial_market_research_report
 
Austin’s industrial market closes 2018 with new buildings and high absorption
Austin’s industrial market closes 2018 with new buildings and high absorptionAustin’s industrial market closes 2018 with new buildings and high absorption
Austin’s industrial market closes 2018 with new buildings and high absorption
 
Q2 2014 Office Market Research Report
Q2 2014 Office Market Research ReportQ2 2014 Office Market Research Report
Q2 2014 Office Market Research Report
 
Q4 2015 Austin Industrial Market Research & Forecast Report
Q4 2015 Austin Industrial Market Research & Forecast ReportQ4 2015 Austin Industrial Market Research & Forecast Report
Q4 2015 Austin Industrial Market Research & Forecast Report
 
Q3 2013 Houston Office Market Research Report
Q3 2013 Houston Office Market Research ReportQ3 2013 Houston Office Market Research Report
Q3 2013 Houston Office Market Research Report
 
Q3 2015 Austin Industrial Market Research Report
Q3 2015 Austin Industrial Market Research ReportQ3 2015 Austin Industrial Market Research Report
Q3 2015 Austin Industrial Market Research Report
 
Q2 2019 | Austin Industrial | Research & Forecast Report
Q2 2019 | Austin Industrial | Research & Forecast ReportQ2 2019 | Austin Industrial | Research & Forecast Report
Q2 2019 | Austin Industrial | Research & Forecast Report
 
Q1 2015 Austin Industrial Market Report
Q1 2015 Austin Industrial Market ReportQ1 2015 Austin Industrial Market Report
Q1 2015 Austin Industrial Market Report
 
Q1 2013 Houston Retail Market Research Report
Q1 2013 Houston Retail Market Research ReportQ1 2013 Houston Retail Market Research Report
Q1 2013 Houston Retail Market Research Report
 
2013 1 q_houston_retail__market_report
2013 1 q_houston_retail__market_report2013 1 q_houston_retail__market_report
2013 1 q_houston_retail__market_report
 
Q1 2013 Houston Retail Market Report
Q1 2013 Houston Retail Market ReportQ1 2013 Houston Retail Market Report
Q1 2013 Houston Retail Market Report
 
St. Louis Industrial Outlook Q3 2016
St. Louis Industrial Outlook Q3 2016St. Louis Industrial Outlook Q3 2016
St. Louis Industrial Outlook Q3 2016
 
Q4 2013 Houston Office Market Research Report
Q4 2013 Houston Office Market Research ReportQ4 2013 Houston Office Market Research Report
Q4 2013 Houston Office Market Research Report
 

Plus de Colliers International | Houston

Plus de Colliers International | Houston (20)

Q1 2022 Austin Industrial Report
Q1 2022 Austin Industrial ReportQ1 2022 Austin Industrial Report
Q1 2022 Austin Industrial Report
 
Q1 2022 Austin Office Market Report
Q1 2022 Austin Office Market ReportQ1 2022 Austin Office Market Report
Q1 2022 Austin Office Market Report
 
2021 Q3 Office Austin Report
2021 Q3 Office Austin Report2021 Q3 Office Austin Report
2021 Q3 Office Austin Report
 
Q2 2021 Austin Industrial Report
Q2 2021 Austin Industrial ReportQ2 2021 Austin Industrial Report
Q2 2021 Austin Industrial Report
 
Q2 2021 Austin Office Report
Q2 2021 Austin Office ReportQ2 2021 Austin Office Report
Q2 2021 Austin Office Report
 
Q1 2021 Austin Office Report
Q1 2021 Austin Office ReportQ1 2021 Austin Office Report
Q1 2021 Austin Office Report
 
Colliers Q4 2020 Austin Industrial Report
Colliers Q4 2020 Austin Industrial ReportColliers Q4 2020 Austin Industrial Report
Colliers Q4 2020 Austin Industrial Report
 
Q4 2020 Austin Office Report
Q4 2020 Austin Office ReportQ4 2020 Austin Office Report
Q4 2020 Austin Office Report
 
Q4 2020 | Houston Office | Research & Forecast Report
Q4 2020 | Houston Office | Research & Forecast ReportQ4 2020 | Houston Office | Research & Forecast Report
Q4 2020 | Houston Office | Research & Forecast Report
 
Q3 2020 | The Woodlands Office | Research Snapshot
Q3 2020 | The Woodlands Office | Research SnapshotQ3 2020 | The Woodlands Office | Research Snapshot
Q3 2020 | The Woodlands Office | Research Snapshot
 
Q3 2020 | Fort Bend | Submarket Snapshot
Q3 2020 | Fort Bend | Submarket SnapshotQ3 2020 | Fort Bend | Submarket Snapshot
Q3 2020 | Fort Bend | Submarket Snapshot
 
Q3 2020 | Austin Office | Research & Forecast Report
Q3 2020 | Austin Office | Research & Forecast ReportQ3 2020 | Austin Office | Research & Forecast Report
Q3 2020 | Austin Office | Research & Forecast Report
 
Q3 2020 | Houston Office | Research & Forecast Report
Q3 2020 | Houston Office | Research & Forecast ReportQ3 2020 | Houston Office | Research & Forecast Report
Q3 2020 | Houston Office | Research & Forecast Report
 
Q2 2020 | The Woodlands Office | Research Snapshot
Q2 2020 | The Woodlands Office | Research SnapshotQ2 2020 | The Woodlands Office | Research Snapshot
Q2 2020 | The Woodlands Office | Research Snapshot
 
Q2 2020 | E Fort Bend Commercial Real Estate Trends
Q2 2020 | E Fort Bend Commercial Real Estate TrendsQ2 2020 | E Fort Bend Commercial Real Estate Trends
Q2 2020 | E Fort Bend Commercial Real Estate Trends
 
Mid-Year 2020 | Houston Healthcare | Market Report
Mid-Year 2020 | Houston Healthcare | Market ReportMid-Year 2020 | Houston Healthcare | Market Report
Mid-Year 2020 | Houston Healthcare | Market Report
 
Q2 2020 | Austin Office | Research & Forecast Report
Q2 2020 | Austin Office | Research & Forecast ReportQ2 2020 | Austin Office | Research & Forecast Report
Q2 2020 | Austin Office | Research & Forecast Report
 
Q1 2020 | The Woodlands Office | Research Snapshot
Q1 2020 | The Woodlands Office | Research SnapshotQ1 2020 | The Woodlands Office | Research Snapshot
Q1 2020 | The Woodlands Office | Research Snapshot
 
Q1 2020 | Fort Bend Submarket Snapshot
Q1 2020 | Fort Bend Submarket SnapshotQ1 2020 | Fort Bend Submarket Snapshot
Q1 2020 | Fort Bend Submarket Snapshot
 
Q1 2020 | Houston Retail | Research & Forecast Report
Q1 2020 | Houston Retail | Research & Forecast ReportQ1 2020 | Houston Retail | Research & Forecast Report
Q1 2020 | Houston Retail | Research & Forecast Report
 

Dernier

Premium Villa Projects in Sarjapur Road Bengaluru
Premium Villa Projects in Sarjapur Road BengaluruPremium Villa Projects in Sarjapur Road Bengaluru
Premium Villa Projects in Sarjapur Road BengaluruShivaSeo3
 
9990771857 Call Girls in Dwarka Sector 6 Delhi (Call Girls) Delhi
9990771857 Call Girls in Dwarka Sector 6 Delhi (Call Girls) Delhi9990771857 Call Girls in Dwarka Sector 6 Delhi (Call Girls) Delhi
9990771857 Call Girls in Dwarka Sector 6 Delhi (Call Girls) Delhidelhimodel235
 
TENANT SCREENING REPORT SERVICES​ How Tenant Screening Reports Work
TENANT SCREENING REPORT SERVICES​ How Tenant Screening Reports WorkTENANT SCREENING REPORT SERVICES​ How Tenant Screening Reports Work
TENANT SCREENING REPORT SERVICES​ How Tenant Screening Reports WorkTurbo Tenant
 
Mahindra Happinest Tathawade Pune Brochure.pdf
Mahindra Happinest Tathawade Pune Brochure.pdfMahindra Happinest Tathawade Pune Brochure.pdf
Mahindra Happinest Tathawade Pune Brochure.pdfBabyrudram
 
Low Rate ↬Call Girls in Trilokpuri Delhi ↫8447779280}Escorts Service In Delhi
Low Rate ↬Call Girls in Trilokpuri Delhi ↫8447779280}Escorts Service In DelhiLow Rate ↬Call Girls in Trilokpuri Delhi ↫8447779280}Escorts Service In Delhi
Low Rate ↬Call Girls in Trilokpuri Delhi ↫8447779280}Escorts Service In Delhiasmaqueen5
 
BDSM⚡Call Girls in Sector 57 Noida Escorts >༒8448380779 Escort Service
BDSM⚡Call Girls in Sector 57 Noida Escorts >༒8448380779 Escort ServiceBDSM⚡Call Girls in Sector 57 Noida Escorts >༒8448380779 Escort Service
BDSM⚡Call Girls in Sector 57 Noida Escorts >༒8448380779 Escort ServiceDelhi Call girls
 
Greater Vancouver Realtors Statistics Package April 2024
Greater Vancouver Realtors Statistics Package April 2024Greater Vancouver Realtors Statistics Package April 2024
Greater Vancouver Realtors Statistics Package April 2024VickyAulakh1
 
Majestique Viman Nagar Pune Brochure.pdf
Majestique Viman Nagar Pune Brochure.pdfMajestique Viman Nagar Pune Brochure.pdf
Majestique Viman Nagar Pune Brochure.pdfBabyrudram
 
M3M 129 E Brochure Noida Expressway, Sector 129, Noida
M3M 129 E Brochure Noida Expressway, Sector 129, NoidaM3M 129 E Brochure Noida Expressway, Sector 129, Noida
M3M 129 E Brochure Noida Expressway, Sector 129, Noidasarak0han45400
 
Call girls in new Ashok NagarDelhi꧁ 8447779280꧂ Escort Service Women Seeking ...
Call girls in new Ashok NagarDelhi꧁ 8447779280꧂ Escort Service Women Seeking ...Call girls in new Ashok NagarDelhi꧁ 8447779280꧂ Escort Service Women Seeking ...
Call girls in new Ashok NagarDelhi꧁ 8447779280꧂ Escort Service Women Seeking ...asmaqueen5
 
9990771857 Call Girls in Dwarka Sector 3 Delhi (Call Girls) Delhi
9990771857 Call Girls in Dwarka Sector 3 Delhi (Call Girls) Delhi9990771857 Call Girls in Dwarka Sector 3 Delhi (Call Girls) Delhi
9990771857 Call Girls in Dwarka Sector 3 Delhi (Call Girls) Delhidelhimodel235
 
9990771857 Call Girls in Dwarka Sector 137 Noida (Call Girls) Delhi
9990771857 Call Girls in Dwarka Sector 137 Noida (Call Girls) Delhi9990771857 Call Girls in Dwarka Sector 137 Noida (Call Girls) Delhi
9990771857 Call Girls in Dwarka Sector 137 Noida (Call Girls) Delhidelhimodel235
 
2k Shots ≽ 9205541914 ≼ Call Girls In Sainik Farm (Delhi)
2k Shots ≽ 9205541914 ≼ Call Girls In Sainik Farm (Delhi)2k Shots ≽ 9205541914 ≼ Call Girls In Sainik Farm (Delhi)
2k Shots ≽ 9205541914 ≼ Call Girls In Sainik Farm (Delhi)Delhi Call girls
 
Call Girls In Laxmi Nagar Delhi +91-8447779280! !Best Woman Seeking Man Escor...
Call Girls In Laxmi Nagar Delhi +91-8447779280! !Best Woman Seeking Man Escor...Call Girls In Laxmi Nagar Delhi +91-8447779280! !Best Woman Seeking Man Escor...
Call Girls In Laxmi Nagar Delhi +91-8447779280! !Best Woman Seeking Man Escor...asmaqueen5
 
Shapoorji Pallonji Joyville Vista Pune | Spend Your Family Time Together
Shapoorji Pallonji Joyville Vista Pune | Spend Your Family Time TogetherShapoorji Pallonji Joyville Vista Pune | Spend Your Family Time Together
Shapoorji Pallonji Joyville Vista Pune | Spend Your Family Time Togetheraidasheikh47
 
M3M The Line Brochure - Premium Investment Opportunity for Commercial Ventures
M3M The Line Brochure - Premium Investment Opportunity for Commercial VenturesM3M The Line Brochure - Premium Investment Opportunity for Commercial Ventures
M3M The Line Brochure - Premium Investment Opportunity for Commercial Venturessheltercareglobal
 
Best Deal Virtual Space in Satya The Hive Tata Zudio 750 Sqft 1.89 Cr All inc...
Best Deal Virtual Space in Satya The Hive Tata Zudio 750 Sqft 1.89 Cr All inc...Best Deal Virtual Space in Satya The Hive Tata Zudio 750 Sqft 1.89 Cr All inc...
Best Deal Virtual Space in Satya The Hive Tata Zudio 750 Sqft 1.89 Cr All inc...ApartmentWala1
 
Properties for Sale in Istanbul with Schools and Parks | Antalya Development
Properties for Sale in Istanbul with Schools and Parks | Antalya DevelopmentProperties for Sale in Istanbul with Schools and Parks | Antalya Development
Properties for Sale in Istanbul with Schools and Parks | Antalya DevelopmentAntalya Development
 
Kohinoor Flats In Hinjewadi Phase 2 | Homes Built To Suit Your Needs
Kohinoor Flats In Hinjewadi Phase 2 | Homes Built To Suit Your NeedsKohinoor Flats In Hinjewadi Phase 2 | Homes Built To Suit Your Needs
Kohinoor Flats In Hinjewadi Phase 2 | Homes Built To Suit Your Needsaidasheikh47
 
Call Girls In Vasant Vihar Delhi 💯Call Us 🔝8264348440🔝
Call Girls In Vasant Vihar Delhi 💯Call Us 🔝8264348440🔝Call Girls In Vasant Vihar Delhi 💯Call Us 🔝8264348440🔝
Call Girls In Vasant Vihar Delhi 💯Call Us 🔝8264348440🔝soniya singh
 

Dernier (20)

Premium Villa Projects in Sarjapur Road Bengaluru
Premium Villa Projects in Sarjapur Road BengaluruPremium Villa Projects in Sarjapur Road Bengaluru
Premium Villa Projects in Sarjapur Road Bengaluru
 
9990771857 Call Girls in Dwarka Sector 6 Delhi (Call Girls) Delhi
9990771857 Call Girls in Dwarka Sector 6 Delhi (Call Girls) Delhi9990771857 Call Girls in Dwarka Sector 6 Delhi (Call Girls) Delhi
9990771857 Call Girls in Dwarka Sector 6 Delhi (Call Girls) Delhi
 
TENANT SCREENING REPORT SERVICES​ How Tenant Screening Reports Work
TENANT SCREENING REPORT SERVICES​ How Tenant Screening Reports WorkTENANT SCREENING REPORT SERVICES​ How Tenant Screening Reports Work
TENANT SCREENING REPORT SERVICES​ How Tenant Screening Reports Work
 
Mahindra Happinest Tathawade Pune Brochure.pdf
Mahindra Happinest Tathawade Pune Brochure.pdfMahindra Happinest Tathawade Pune Brochure.pdf
Mahindra Happinest Tathawade Pune Brochure.pdf
 
Low Rate ↬Call Girls in Trilokpuri Delhi ↫8447779280}Escorts Service In Delhi
Low Rate ↬Call Girls in Trilokpuri Delhi ↫8447779280}Escorts Service In DelhiLow Rate ↬Call Girls in Trilokpuri Delhi ↫8447779280}Escorts Service In Delhi
Low Rate ↬Call Girls in Trilokpuri Delhi ↫8447779280}Escorts Service In Delhi
 
BDSM⚡Call Girls in Sector 57 Noida Escorts >༒8448380779 Escort Service
BDSM⚡Call Girls in Sector 57 Noida Escorts >༒8448380779 Escort ServiceBDSM⚡Call Girls in Sector 57 Noida Escorts >༒8448380779 Escort Service
BDSM⚡Call Girls in Sector 57 Noida Escorts >༒8448380779 Escort Service
 
Greater Vancouver Realtors Statistics Package April 2024
Greater Vancouver Realtors Statistics Package April 2024Greater Vancouver Realtors Statistics Package April 2024
Greater Vancouver Realtors Statistics Package April 2024
 
Majestique Viman Nagar Pune Brochure.pdf
Majestique Viman Nagar Pune Brochure.pdfMajestique Viman Nagar Pune Brochure.pdf
Majestique Viman Nagar Pune Brochure.pdf
 
M3M 129 E Brochure Noida Expressway, Sector 129, Noida
M3M 129 E Brochure Noida Expressway, Sector 129, NoidaM3M 129 E Brochure Noida Expressway, Sector 129, Noida
M3M 129 E Brochure Noida Expressway, Sector 129, Noida
 
Call girls in new Ashok NagarDelhi꧁ 8447779280꧂ Escort Service Women Seeking ...
Call girls in new Ashok NagarDelhi꧁ 8447779280꧂ Escort Service Women Seeking ...Call girls in new Ashok NagarDelhi꧁ 8447779280꧂ Escort Service Women Seeking ...
Call girls in new Ashok NagarDelhi꧁ 8447779280꧂ Escort Service Women Seeking ...
 
9990771857 Call Girls in Dwarka Sector 3 Delhi (Call Girls) Delhi
9990771857 Call Girls in Dwarka Sector 3 Delhi (Call Girls) Delhi9990771857 Call Girls in Dwarka Sector 3 Delhi (Call Girls) Delhi
9990771857 Call Girls in Dwarka Sector 3 Delhi (Call Girls) Delhi
 
9990771857 Call Girls in Dwarka Sector 137 Noida (Call Girls) Delhi
9990771857 Call Girls in Dwarka Sector 137 Noida (Call Girls) Delhi9990771857 Call Girls in Dwarka Sector 137 Noida (Call Girls) Delhi
9990771857 Call Girls in Dwarka Sector 137 Noida (Call Girls) Delhi
 
2k Shots ≽ 9205541914 ≼ Call Girls In Sainik Farm (Delhi)
2k Shots ≽ 9205541914 ≼ Call Girls In Sainik Farm (Delhi)2k Shots ≽ 9205541914 ≼ Call Girls In Sainik Farm (Delhi)
2k Shots ≽ 9205541914 ≼ Call Girls In Sainik Farm (Delhi)
 
Call Girls In Laxmi Nagar Delhi +91-8447779280! !Best Woman Seeking Man Escor...
Call Girls In Laxmi Nagar Delhi +91-8447779280! !Best Woman Seeking Man Escor...Call Girls In Laxmi Nagar Delhi +91-8447779280! !Best Woman Seeking Man Escor...
Call Girls In Laxmi Nagar Delhi +91-8447779280! !Best Woman Seeking Man Escor...
 
Shapoorji Pallonji Joyville Vista Pune | Spend Your Family Time Together
Shapoorji Pallonji Joyville Vista Pune | Spend Your Family Time TogetherShapoorji Pallonji Joyville Vista Pune | Spend Your Family Time Together
Shapoorji Pallonji Joyville Vista Pune | Spend Your Family Time Together
 
M3M The Line Brochure - Premium Investment Opportunity for Commercial Ventures
M3M The Line Brochure - Premium Investment Opportunity for Commercial VenturesM3M The Line Brochure - Premium Investment Opportunity for Commercial Ventures
M3M The Line Brochure - Premium Investment Opportunity for Commercial Ventures
 
Best Deal Virtual Space in Satya The Hive Tata Zudio 750 Sqft 1.89 Cr All inc...
Best Deal Virtual Space in Satya The Hive Tata Zudio 750 Sqft 1.89 Cr All inc...Best Deal Virtual Space in Satya The Hive Tata Zudio 750 Sqft 1.89 Cr All inc...
Best Deal Virtual Space in Satya The Hive Tata Zudio 750 Sqft 1.89 Cr All inc...
 
Properties for Sale in Istanbul with Schools and Parks | Antalya Development
Properties for Sale in Istanbul with Schools and Parks | Antalya DevelopmentProperties for Sale in Istanbul with Schools and Parks | Antalya Development
Properties for Sale in Istanbul with Schools and Parks | Antalya Development
 
Kohinoor Flats In Hinjewadi Phase 2 | Homes Built To Suit Your Needs
Kohinoor Flats In Hinjewadi Phase 2 | Homes Built To Suit Your NeedsKohinoor Flats In Hinjewadi Phase 2 | Homes Built To Suit Your Needs
Kohinoor Flats In Hinjewadi Phase 2 | Homes Built To Suit Your Needs
 
Call Girls In Vasant Vihar Delhi 💯Call Us 🔝8264348440🔝
Call Girls In Vasant Vihar Delhi 💯Call Us 🔝8264348440🔝Call Girls In Vasant Vihar Delhi 💯Call Us 🔝8264348440🔝
Call Girls In Vasant Vihar Delhi 💯Call Us 🔝8264348440🔝
 

Q2 2014 Houston Industrial Market Report

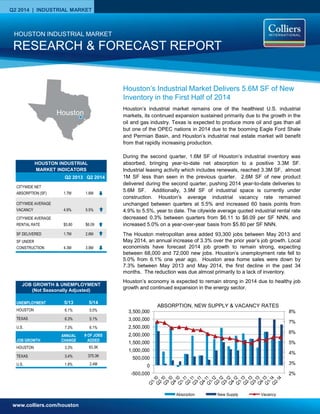
  • 1. www.colliers.com/houston Q2 2014 | INDUSTRIAL MARKET 2% 3% 4% 5% 6% 7% 8% -500,000 0 500,000 1,000,000 1,500,000 2,000,000 2,500,000 3,000,000 3,500,000 Absorption New Supply Vacancy Houston’s industrial market remains one of the healthiest U.S. industrial markets, its continued expansion sustained primarily due to the growth in the oil and gas industry. Texas is expected to produce more oil and gas than all but one of the OPEC nations in 2014 due to the booming Eagle Ford Shale and Permian Basin, and Houston’s industrial real estate market will benefit from that rapidly increasing production. During the second quarter, 1.6M SF of Houston’s industrial inventory was absorbed, bringing year-to-date net absorption to a positive 3.3M SF. Industrial leasing activity which includes renewals, reached 3.3M SF, almost 1M SF less than seen in the previous quarter. 2.6M SF of new product delivered during the second quarter, pushing 2014 year-to-date deliveries to 5.6M SF. Additionally, 3.9M SF of industrial space is currently under construction. Houston’s average industrial vacancy rate remained unchanged between quarters at 5.5% and increased 60 basis points from 4.9% to 5.5%, year to date. The citywide average quoted industrial rental rate decreased 0.3% between quarters from $6.11 to $6.09 per SF NNN, and increased 5.0% on a year-over-year basis from $5.80 per SF NNN. The Houston metropolitan area added 93,300 jobs between May 2013 and May 2014, an annual increase of 3.3% over the prior year’s job growth. Local economists have forecast 2014 job growth to remain strong, expecting between 68,000 and 72,000 new jobs. Houston’s unemployment rate fell to 5.0% from 6.1% one year ago. Houston area home sales were down by 7.3% between May 2013 and May 2014, the first decline in the past 34 months. The reduction was due almost primarily to a lack of inventory. Houston’s economy is expected to remain strong in 2014 due to healthy job growth and continued expansion in the energy sector. RESEARCH & FORECAST REPORT HOUSTON INDUSTRIAL MARKET ABSORPTION, NEW SUPPLY & VACANCY RATES Houston’s Industrial Market Delivers 5.6M SF of New Inventory in the First Half of 2014 HOUSTON INDUSTRIAL MARKET INDICATORS Q2 2013 Q2 2014 CITYWIDE NET ABSORPTION (SF) 1.7M 1.6M CITYWIDE AVERAGE VACANCY 4.9% 5.5% CITYWIDE AVERAGE RENTAL RATE $5.80 $6.09 SF DELIVERED 1.7M 2.6M SF UNDER CONSTRUCTION 4.3M 3.9M Houston UNEMPLOYMENT 5/13 5/14 HOUSTON 6.1% 5.0% TEXAS 6.3% 5.1% U.S. 7.3% 6.1% JOB GROWTH ANNUAL CHANGE # OF JOBS ADDED HOUSTON 3.3% 93.3K TEXAS 3.4% 375.3K U.S. 1.8% 2.4M JOB GROWTH & UNEMPLOYMENT (Not Seasonally Adjusted)
  • 2. RESEARCH & FORECAST REPORT | Q2 2014 | HOUSTON INDUSTRIAL MARKET COLLIERS INTERNATIONAL | P.2 Vacancy & Availability Houston’s industrial vacancy rate remained unchanged between quarters at 5.5%, and increased by 60 basis points from 4.9% to 5.5%, year to date. At the end of the second quarter, Houston had 26.8M SF of vacant industrial space. Among the major industrial corridors, the Northeast Corridor has the lowest vacancy rate at 3.2%, followed by the Northwest Corridor at 4.1% and then the Southern Corridor at 4.2%. The largest concentration of vacancy is located in the North Corridor, with an 8.0% vacancy rate. Houston’s industrial construction pipeline had 3.9M SF of projects underway at the end of the second quarter, the majority of which being spec development. The largest project under construction is Panattoni’s 441,000-SF spec warehouse located on N. Gessner in the Northwest Corridor. A list of buildings currently under construction can be found on Page 4 of this report. Rental Rates According to CoStar, our data service provider, Houston’s citywide average quoted industrial rental rate for all product types decreased 0.3% from $6.11 per SF NNN in the first quarter to $6.09 per SF NNN in the second quarter. According to Colliers’ internal data, actual lease transactions are in the $4.44 – $4.92 per SF NNN range for newer bulk industrial spaces, while flex rates are ranging from $6.60 to $9.00 per SF, depending on the allowance for tenant improvements and the location of the property. By property type, the average quoted NNN rental rates are as follows: $5.71 per SF for Warehouse Distribution space; $4.34 per SF for Bulk Logistics space; $10.11 per SF for Flex/Service space; with Tech/R&D space averaging $10.87 per SF, according to CoStar. Absorption & Demand Houston’s industrial market posted 1.6M SF of positive net absorption in the second quarter, with the North Corridor submarket contributing the largest amount, 821,071 SF, followed by the Northwest Corridor which posted 284,086 SF, the Southwest Corridor at 259,871 SF, and the Southern Corridor at 221,969 SF of net positive absorption. There were several major tenant move-ins contributing to net absorption gains in the second quarter, including Kauffman Tire (91,200 SF); Atlanta Food International (84,600 SF); Poly Bags (62,600 SF); International Rags, Ltd. (62,500 SF); Gas Process Equipment Co. (47,500 SF); FreshPak (44,800 SF); Chadwell Supply (43,500 SF); ToolMart (38,100 SF) and Nordyne LLC (37,500 SF). Leasing Houston’s industrial leasing activity reached 3.3M SF in the second quarter. A list of select second quarter industrial lease transactions are included in the table below. 1 Renewal 2 Expansion 3 Sublease 4Pre-lease proposed or under construction Building Name/Address Submarket SF Tenant Lease Date 1701 Crosspoint Avenue Southwest Far 72,505 BASF1 Jun-14 Carson Commerce Center East-Southeast Far 67,742 Elliott Electric Co. Apr-14 11629 N Houston Rosslyn Rd Hwy 290/Tomball Pky 47,500 Gas Process Equipment Co. Apr-14 8615 North Loop E Northeast Hwy 90 36,352 RL Building Supply, LLC May-14 Sam Houston Pkwy Dist Ctr Northwest Inner Loop 33,730 Graniti Vicentia, LLC May-14 Udelson Industrial Park North Outer Loop 30,000 Max Torque, LLC May-14 East Belt Business Park 4 East-Southeast Far 25,267 Jotun Paints Apr-14 Candlebridge Park North Hardy Toll Road Ind 20,400 Delta Subsea Apr-14 Clay-Campbell Business Park Northwest Inner Loop 19,950 Prairie Supply1 Jun-14 Greenspoint Business Center North Hardy Toll Road Ind 17,775 Tellworks Communications Jun-14 Northwoods Industrial Park West Outer Loop 13,125 Gulf Coast Conversions1 Apr-14 Q2 2014 SELECT INDUSTRIAL LEASES
  • 3. RESEARCH & FORECAST REPORT | Q2 2014 | HOUSTON INDUSTRIAL MARKET COLLIERS INTERNATIONAL | P.3 Houston Industrial Market Summary Sales Activity Q2 2014 Total Sales : $570M No. of Properties: 81 Total SF: 4.3M Average $/SF: $45 Average Cap Rate: 8.6% Falcon Southwest sold a 377,752-SF 12-building industrial warehouse portfolio to Hartman Mitchelldale Business Park, LLC for $19.2M or $51 per SF. The portfolio is 87.2% leased to various tenants. The buildings in the industrial park were built in 1979 and remodeled in 2004. C&W Investments sold a 151,260-SF Class B industrial warehouse to STAG Industrial Management, LLC for $8.9M or $59 per SF. The building is 100% leased to Smart Warehousing through April 2021. The reported cap rate was 8.6%. Sources: Real Capital Analytics; CoStar Comps 5400 Mitchelldale St 12614 Hempstead Rd Market Rentable Area Direct Vacant SF Direct Vacancy Rate Sublet Vacant SF Sublet Vacancy Rate Total Vacant SF Total Vacancy Rate 2Q14 Net Absorption 1Q14 Net Absorption 2Q14 Completions 1Q14 Completions SF Under Construction Greater Houston Total 491,720,505 26,181,150 5.3% 637,355 0.1% 26,818,505 5.5% 1,583,925 1,755,866 2,645,694 2,951,422 3,930,859 CBD-NW Inner Loop 11,500,406 559,996 4.9% 31,860 0.3% 591,856 5.1% 62,709 15,767 - - - Downtown 31,814,637 1,751,102 5.5% - 0.0% 1,751,102 5.5% (1,720) 101,850 - - - North Inner Loop 5,076,141 534,906 10.5% - 0.0% 534,906 10.5% - (21,525) - - - Southwest Inner Loop 7,198,717 61,171 0.8% - 0.0% 61,171 0.8% (15,601) - - - - CBD Corridor Total 55,589,901 2,907,175 5.2% 31,860 0.1% 2,939,035 5.3% 45,388 96,092 - - - North Fwy/Tomball Pky 17,347,742 1,489,803 8.6% 5,346 0.0% 1,495,149 8.6% 225,898 (66,181) 873,068 250,255 926,180 North Hardy Toll Rd 29,108,673 2,747,187 9.4% 59,122 0.2% 2,806,309 9.6% 441,818 495,206 449,474 797,506 423,440 North Outer Loop 18,791,750 1,386,001 7.4% 1,950 0.0% 1,387,951 7.4% 89,657 178,203 381,250 174,434 120,000 The Woodlands/Conroe 14,413,958 693,531 4.8% - 0.0% 693,531 4.8% 63,698 17,420 18,800 166,900 - North Corridor Total 79,662,123 6,316,522 7.9% 66,418 0.1% 6,382,940 8.0% 821,071 624,648 1,722,592 1,389,095 1,469,620 Northeast Hwy 321 1,201,673 - 0.0% - 0.0% - 0.0% 0 600 - - - Northeast Hwy 90 15,937,684 448,855 2.8% 136,200 0.9% 585,055 3.7% (54,458) (129,095) - 41,356 - Northeast I-10 3,672,845 30,652 0.8% - 0.0% 30,652 0.8% 109,628 12,801 - - - Northeast Inner Loop 11,591,910 430,372 3.7% - 0.0% 430,372 3.7% (7,842) 11,069 - - - Northeast Corridor Total 32,404,112 909,879 2.8% 136,200 0.4% 1,046,079 3.2% 47,328 (104,625) - 41,356 - Hwy 290/Tomball Pky 16,056,280 704,622 4.4% 20,541 0.1% 725,163 4.5% 154,657 72,540 - 105,358 1,578,981 Northwest Hwy 6 4,158,737 141,314 3.4% 24,000 0.6% 165,314 4.0% (24,086) (25,392) - - 357,887 Northwest Inner Loop 58,686,032 2,301,129 3.9% 74,554 0.1% 2,375,683 4.0% 22,402 (34,334) - 177,448 - Northwest Near 17,187,843 462,963 2.7% 49,824 0.3% 512,787 3.0% 26,623 597,368 - 255,962 . Northwest Outlier 17,160,063 1,054,831 6.1% - 0.0% 1,054,831 6.1% 106,728 80,354 79,743 63,382 64,313 West Outer Loop 23,683,929 707,903 3.0% 23,600 0.1% 731,503 3.1% (2,238) 83,495 189,125 332,581 86,250 Northwest Corridor Total 136,932,884 5,372,762 3.9% 192,519 0.1% 5,565,281 4.1% 284,086 774,031 268,868 934,731 2,087,431 East I-10 Outer Loop 13,047,099 264,136 2.0% - 0.0% 264,136 2.0% (1,000) (28,000) - - - East-Southeast Far 47,305,783 4,918,042 10.4% 7,078 0.0% 4,925,120 10.4% (41,123) (76,120) 91,140 385,462 . Southeast Outer Loop 18,374,310 496,361 2.7% 117,573 0.6% 613,934 3.3% (53,665) 33,741 - - - Southeast Corridor Total 78,727,192 5,678,539 7.2% 124,651 0.2% 5,803,190 7.4% (95,788) (70,379) 91,140 385,462 - South Highway 35 31,853,434 1,071,713 3.4% 23,600 0.1% 1,095,313 3.4% 201,820 384,427 327,294 143,390 283,808 South Inner Loop 12,771,468 762,132 6.0% - 0.0% 762,132 6.0% 20,149 51,596 - - - Southern Corridor Total 44,624,902 1,833,845 4.1% 23,600 0.1% 1,857,445 4.2% 221,969 436,023 327,294 143,390 283,808 Highway 59/Highway 90 22,209,481 1,037,827 4.7% 44,500 0.2% 1,082,327 4.9% 66,434 23,694 208,800 30,000 90,000 Southwest Far 10,080,924 536,531 5.3% - 0.0% 536,531 5.3% 89,030 (45,617) - - - Southwest Outer Loop 12,708,006 624,798 4.9% - 0.0% 624,798 4.9% 120,564 (72,481) - - - Sugar Land/Ft Bend Co 18,780,980 963,272 5.1% 17,607 0.1% 980,879 5.2% (16,157) 94,480 27,000 27,388 - Total Southwest Corridor 63,779,391 3,162,428 5.0% 62,107 0.1% 3,224,535 5.1% 259,871 76 235,800 57,388 90,000 HOUSTON INDUSTRIAL MARKET STATISTICAL SUMMARY Q2 2014
  • 4. RESEARCH & FORECAST REPORT | Q2 2014 | HOUSTON INDUSTRIAL MARKET COLLIERS INTERNATIONAL | P.4 Q2 2014 Industrial Under Construction – 60,000 SF or greater Q2 2014 Industrial Deliveries – 60,000 SF or greater SUBMARKET BUILDING ADDRESS RBA % LEASED DEVELOPER ESTIMATED DELIVERY DATE Hwy 290/Tomball Pky Ind 11810 N Gessner Rd 441,000 0.0% Panattoni Oct-14 Hwy 290/Tomball Pky Ind 8303 Fallbrook Dr 400,250 0.0% Liberty Property Trust Jul-14 Hwy 290/Tomball Pky Ind Gessner Road & Beltway 8 362,180 0.0% DCT Industrial Trust Nov-14 Northwest Hwy 6 Ind 20710 Hempstead Rd 357,887 0.0% Duke Realty Corporation Sep-14 North Fwy/Tomball Pky Ind 4800 W Greens Rd 350,820 0.0% Davis Commercial Development Oct-14 North Fwy/Tomball Pky Ind 660 Greens Pky 350,000 100.0% Holder Construction Mar-15 North Fwy/Tomball Pky Ind 300 Airtex Dr 225,360 0.0% Pontikes Development Dec-14 South Hwy 35 Ind 9254 Park South Vw 193,741 0.0% Transwestern Aug-14 Hwy 290/Tomball Pky Ind 11720 N Gessner Rd 155,400 0.0% Panattoni Dec-14 North Hardy Toll Road Ind 400 Century Plaza Dr 149,760 0.0% Avera Companies Aug-14 North Hardy Toll Road Ind 2020 Greens Rd 147,112 0.0% IDV Investment & Development VenutresDec-14 North Hardy Toll Road Ind 14820 North Fwy 126,568 0.0% DCT Industrial Trust Nov-14 North Outer Loop Ind JKF/Kennedy Greens Blvd 120,000 100.0% Clay Development Construction Aug-14 Hwy 290/Tomball Pky Ind 8780 West Rd 100,275 100.0% EastGroup Properties Sep-14 South Hwy 35 Ind 9258 Park South Vw 90,067 100.0% Transwestern Jul-14 Hwy 59/Hwy 90 (Alt) Ind 10401 S Sam Houston Pky W 90,000 0.0% ICO Commercial Sep-14 West Outer Loop Ind 5737 Brittmoore Rd 86,250 0.0% Taten Real Estate Parters Dec-14 Northwest Outliers Ind 22240 Merchants Way 64,313 0.0% EastGroup Properties Jul-14 Hwy 290/Tomball Pky Ind 8790 West Rd 63,000 0.0% EastGroup Properties Sep-14 SUBMARKET BUILDING ADDRESS RBA % LEASED DEVELOPER DELIVERED North Fwy/Tomball Pky 10565 Greens Crossing Blvd 600,750 82.9% Hines Jun-14 North Hardy Toll Road 8039 Humble Westfield Rd 250,200 0.0% K2 Logistics Jun-14 North Outer Loop 121 Esplanade 224,550 0.0% IDI Jun-14 South Hwy 35 11951 Spectrum Blvd 150,000 100.0% Unknown Jun-14 South Hwy 35 7232 Airport Blvd 137,297 100.0% Unknown Dec-13 Hwy 59/Hwy 90(Alt) 13615 S Gessner Rd 123,300 0.0% Stream Realty Partners Apr-14 West Outer Loop 5737 Brittmoore Rd 122,500 100.0% Taten Real Estate Partners Jun-14 North Fwy/Tomball Pky 433 Plaza Verde Dr 120,159 0.0% Hines May-14 North Fwy/Tomball Pky 545 Plaza Verde Dr 120,159 0.0% Hines May-14 North Outer Loop 71 Esplanade 106,700 0.0% IDI Jun-14 North Hardy Toll Road 15892 Diplomatic Plaza Dr 94,074 0.0% EastGroup Properties Jun-14 Hwy 59/Hwy 90(Alt) 13721 S Gessner Rd 85,500 44.5% Stream Realty Partners Apr-14 Northwest Outliers 22110 Merchants Way 67,743 54.1% InSite Realty Partners Apr-14
  • 5. RESEARCH & FORECAST REPORT | Q2 2014 | HOUSTON INDUSTRIAL MARKET Accelerating success. COLLIERS INTERNATIONAL 1233 W. Loop South Suite 900 Houston, Texas 77027 Main +1 713 222 2111 LISA R. BRIDGES Director of Market Research | Houston Direct +1 713 830 2125 Fax +1 713 830 2118 lisa.bridges@colliers.com The Colliers Advantage Enterprising Culture Colliers International is a leader in global real estate services, defined by our spirit of enterprise. Through a culture of service excellence and a shared sense of initiative, we integrate the resources of real estate specialists worldwide to accelerate the success of our partners. When you choose to work with Colliers, you choose to work with the best. In addition to being highly skilled experts in their field, our people are passionate about what they do. And they know we are invested in their success just as much as we are in our clients’ success. This is evident throughout our platform—from Colliers University, our proprietary education and professional development platform, to our client engagement strategy that encourages cross-functional service integration, to our culture of caring. We connect through a shared set of values that shape a collaborative environment throughout our organization that is unsurpassed in the industry. That’s why we attract top recruits and have one of the highest retention rates in the industry. Colliers International has also been recognized as one of the “best places to work” by top business organizations in many of our markets across the globe. Colliers International offers a comprehensive portfolio of real estate services to occupiers, owners and investors on a local, regional, national and international basis. *Information herein has been obtained from sources deemed reliable, however its accuracy cannot be guaranteed. COLLIERS INTERNATIONAL | P. 5