1. Q1 2011 | INDUSTRIAL
GREATER COLUMBUS REGION
INDUSTRIAL TRENDS REPORT
Market Stumbles into 2011
INDUSTRIAL MARKET OVERVIEW
Much of the gains from the close of 2010 have slipped as the Columbus industrial market incurred
468,993 square feet of negative absorption. However, optimism about growth and sustained recovery
should remain as the general economic and industrial picture is brightening in multiple sectors of the
Central Ohio economy. Further, despite strong direct real estate indications, businesses are
announcing plans for expansion and many of the region’s largest firms are reporting numbers in the
black. This will inevitably pour over into real estate as we’re seeing with the growth of office and
MARKET INDICATORS industrial parks in New Albany. Continued on page 2...
Q1 Q2
FORECASTS AND REFLECTIONS
2011 2011*
VACANCY
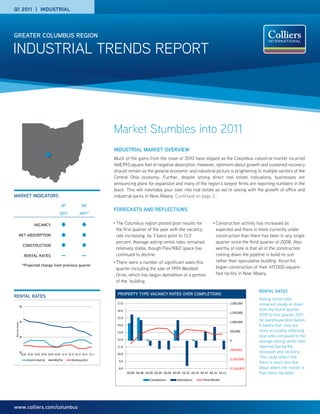
• The Columbus region posted poor results for • Construction activity has increased as
the first quarter of the year with the vacancy expected and there is more currently under
NET ABSORPTION rate increasing by 3 basis point to 13.2 construction than there has been in any single
percent. Average asking rental rates remained quarter since the third quarter of 2008. Also
CONSTRUCTION
relatively stable, though Flex/R&D space has worthy of note is that all of the construction
RENTAL RATES — — continued to decline. coming down the pipeline is build-to-suit
• There were a number of significant sales this rather than speculative building. Accel Inc
*Projected change from previous quarter
quarter including the sale of 1999 Westbelt began construction of their 417,000-square-
Drive, which has begun demolition of a portion foot facility in New Albany.
of the building.
RENTAL RATES
PROPERTY TYPE VACANCY RATES OVER COMPLETIONS
RENTAL RATES
Asking rental rates
Rates for the Major Product Types
17.0 2,000,000 remained steady or down
$8
2.5 $2.20 16.0 from the fourth quarter
1,500,000
$2.15 2010 to first quarter 2011
2.0 15.0
$6
$2.10
1,000,000 for warehouse/distribution.
Rental Rate
$2.05
1.5 14.0 It seems that they are
$2.00
1.0 $1.95 13.0 500,000 more accurately reflecting
$4 $1.90 deal rates compared to the
0.5 12.0
$1.85 0 average asking rental rates
0 $1.80 11.0 reported during the
3Q07 4Q07 1Q08 2Q08 3Q08 4Q08 1Q09 2Q09 3Q10 4Q10 (500,000)
$2
10.0
recession and recovery.
3Q 08 4Q 08 1Q 09 2Q 09 3Q 09 4Q 09 1Q 10 2Q 10 3Q 10 4Q 10 1Q 11
(1,000,000)
This could reflect that
General Industrial R&D/Flex Warehouse/Dist. 9.0 there is much less fear
8.0 (1,500,000) about where the market is
1 5 10 15 20 25
3Q 08 4Q 08 1Q 09 2Q 09 3Q 09 4Q 09 1Q 10 2Q 10 3Q 10 4Q 10 1Q 11 30 than there has been.
Completions Absorptions Total Market
www.colliers.com/columbus
2. RESEARCH & FORECAST REPORT | Q1 2011 | INDUSTRIAL | GREATER COLUMBUS REGION
Delaware REGIONAL INDUSTRIAL ECONOMICS has normalized as well. Freight transportation
County
Union The Federal Reserve Bank of Cleveland reports shipping volume rose from early February to
County
twice a quarter in the Federal Reserve’s Beige mid-March and most firms are expecting a
North
Book about the economic activity of the fourth greater increase in activity compared to 2010.
Licking
Madison
County County district, which includes the Columbus Diesel fuel costs are obviously creating need for
Metropolitan Statistical Area (MSA). The Beige logistics to find other ways to cut costs and avoid
West East
Book from March 2011 reported that industrial passing the increase on to customers.
CBD activity in the fourth district experienced
continued improvement in new orders and The Bureau of Labor Statistics reported that
Southwest Southeast
Fairfield
production during the previous six weeks. Freight Manufacturing employment, 62,600 employees,
County transportation executives again reported had not significantly changed from January to
Pickaway County concerns about fuel prices, though some had February, and was only down .4 percent from a
found ways to pass the higher diesel prices on to year ago. Trade, Transportation, and Utilities
The Columbus industrial market consists customers. Manufacturers reported that employment fell by 400 but was higher compared
of 10 suburban submarkets and the to a year ago by 1.7 percent. Mining, logging, and
production was higher than a year ago with
Central Business District. The total
some firms experiencing low double-digit Construction was up 300 and up 8.4 percent
inventory for the region is 205 million
square feet of space increases. Expectations called for continued from a year ago. (Note: Percent change year-
growth through at least the first half of 2011. over-year is a useful tool for removing potential
Capacity utilization continued to trend higher for seasonal employment factors.)
manufacturers and steel producers, and
inventories remained close to targeted levels. DISTRIBUTION ANALYSIS
Freight transportation experienced mixed results The Boyd Company released a comparative
because of severe winter weather, but most analysis of the operating costs of a
expected sales growth to be stronger in 2011 175,000-square-foot warehouse in 50 U.S.
than in years past. cities, which included Columbus. Surveyed cost
factors included “nonexempt labor costs for
The April 2011 Beige Book reported that activity warehouse, material handling, packing, light
in the fourth district had improved slightly on assembly and administrative support workers;
balance. Manufacturers saw stable or rising industrially-zoned land costs; new warehouse
orders and some continued to see double-digit construction costs; electric power costs; natural
increases since the December report. Most gas costs; real estate property taxes; as well as
manufacturers are expecting that orders will transportation costs.” Columbus was the middle
increase from 2010 levels and that seasonal of the road at 24th with yearly estimated
trends will return to normal. Capacity utilization operating costs of $8,748,247.
MARKET ACTIVITY
SALES AND DEALS
PROPERTY ADDRESS SALES DATE SALE PRICE SIZE SF SALES PRICE / SF TYPE
1999 Westbelt Drive Jan 2011 $5,200,000.00 202,000 $24.74 Warehouse/Distribution
2550 John Glenn Ave Feb 2011 $4,550,000.00 205,109 $22.18 Warehouse/Distribution
4343 Williams Road Jan 2011 $2,050,000.00 296,945 $6.90 Warehouse/Distribution
807 W. 3rd Ave. Jan 2011 $1,900,000.00 20,960 $90.65 Light Industrial
2000 Westbelt Drive Jan 2011 $1,900,000.00 53,604 $35.44 Warehouse/Distribution
2850 Charter Street Jan 2011 $1,312,370.00 50,000 $26.25 General Industrial
341 O’Neill Jan 2011 $850,000.00 81,106 $10.48 Light Industrial
PROPERTY ADDRESS LESSOR LESSEE LEASE SF ASKING PRICE / SF (NNN) TYPE
4458 Alum Creek Drive ProLogis SB Capital 209,947 $2.75 Warehouse/Distribution
2781 Westbelt Drive Trident AIM Logistics 70,000 $1.99 Warehouse/Distribution
4311 Janitrol First Industrial Reville Wholesale 36,111 $2.95 Warehouse/Distribution
2101 Southwest Blvd. ProLogis Confidential 36,000 $3.50 Warehouse/Distribution
P. 2 | COLLIERS INTERNATIONAL
3. RESEARCH & FORECAST REPORT | Q1 2011 | INDUSTRIAL | GREATER COLUMBUS REGION
UPDATE Market Comparisons
INDUSTRIAL MARKET
Net Absorption Construction Asking Rental Rates
SUBMARKET Total SF Vacant SF Vacancy % Current Quarter Year-to-date Current Completions WH/Dist R&D/Flex
CBD 5,907,062 1,039,290 17.6 39,385 39,385 - - - $4.97
EAST 20,185,366 3,919,952 19.4 (84,031) (84,031) 523,000 - $2.82 $5.18
FAIRFIELD 6,902,992 573,207 8.3 17,600 17,600 - - $5.02 -
LICKING 18,557,116 1,451,516 7.8 - - - - - -
MADISON 6,883,029 - 0.3 (16,179) (16,179) 1,470,000 - - -
NORTH 16,933,852 1,539,811 9.0 28,725 28,725 - - $3.46 $5.37
NORTH DELAWARE 9,039,642 830,162 9.3 (33,662) (33,662) - - $3.13 -
PICKAWAY 3,449,964 71,900 2.3 (8,800) (8,800) - - $2.48 -
SOUTHEAST 64,252,530 10,459,928 17.1 (396,855) (396,855) - - $2.82 $3.02
SOUTHWEST 17,651,352 1,453,809 9.3 (117,548) (117,548) - - $2.93 $4.67
UNION 6,245,713 562,055 9.1 (33,342) (33,342) - - $4.50 $6.08
WEST 35,914,981 5,251,755 14.8 135,714 135,714 - - $2.35 $4.26
TOTALS 211,923,599 27,972,230 13.2 (468,993) (468,993) 1,992,000 - $2.72 $4.19
Net Absorption Construction Asking Rental Rates
SUBMARKET Total SF Vacant SF Vacancy % Current Quarter Year-to-date Current Completions By Product Type
R&D/FLEX 20,210,125 3,017,655 20.7 (9,816) (9,816) - - $4.19
GENERAL INDUSTRIAL 71,826,637 5,897,135 9.7 98,875 98,875 587,000 - $3.13
WAREHOUSE/ 119,886,837 18,238,595 18.7 (558,052) (558,052) 1,405,000 - $2.72
DISTRIBUTION
TOTALS 211,923,599 27,972,230 13.2 (468,993) (468,993) 1,992,000 - -
QUARTERLY COMPARISON AND TOTALS
Net Absorption Construction Asking Rental Rates
QUARTER, YEAR Total SF Vacant SF Vacancy % Current Quarter Year-to-date Current Completions ($)
Q4, 2010 205,420,829 26,113,915 12.71 743,685 (766,901) 1,575,000 (536,292) $2.57
Q3, 2010 205,957,121 27,183,626 13.20 313,420 (1,381,820) 170,000 - $2.93
Q2, 2010 205,957,121 27,513,381 13.36 (337,420) (1,695,550) 170,000 (1,985,385) $3.18
Q1, 2010 207,989,506 27,991,561 13.46 (1,358,130) (1,358,130) 170,000 - $3.18
CONSTRUCTION CONTRACTS
The Columbus industrial market is
gaining significant build to suit space.
Notwithstanding the announcement
of many large projects in New Albany
and Madison County, industrial permit
growth has slowed compared to the
75 percent grow in 2010. McGraw-
Hill reported that in February new
commercial building contracts totalled
$57.8 million, a 16 percent gain from a
low in January.
COLLIERS INTERNATIONAL | P. 3
4. RESEARCH & FORECAST REPORT | Q1 2011 | INDUSTRIAL | GREATER COLUMBUS REGION
Average asking rental rates in 2010 dipped Construction is now well underway with the
closer to deal rates for warehouse/distribution aforementioned Accel facility and construction
space which is much closer to $2.00 per square continues for the Vee Pak site. 480 offices in
foot rather than $3.00 per square foot. Despite
the strong position for tenants, the amount of NORTH
61 countries on
build-to-suit construction is an obvious indicator
The submarkets comprising the northern 6 continents
that some firms weathered the recession very
columbus are North and North Delaware. The
well. It seems that the depressed leasing prices United States: 95
northern submarkets feature some of the lowest Canada: 17
and the aggressiveness of municipalities around
vacancy rates in the region considering that they Latin America: 17
Central Ohio are making the choice to build Asia Pacific: 52
make up 12 percent of the market. Pricing for
easier. EMEA: 85
these submarkets reflects that. As most
submarkets are experiencing soft asking rates • $1.6 billion in annual revenue
Market activity and interest did not increase because of low demand, the North and North • 672.9 million square feet under
substantially this quarter but there were a few Delaware are very close to their Q1 2008 asking management
more large players actively seeking space in the rates. • Over 10,000 professionals
market compared to 2009. Business development
groups such as TechColumbus, and Ohio’s
SOUTHEAST
aggressive tax abatement plans, run by the Ohio UNITED STATES:
Department of Development and local The Southeast submarket was the worst hit this
Columbus
municipalities such as Dublin and New Albany, quarter with Medline vacating nearly 400,000 Richard B. Schuen SIOR CCIM
have been greasing the wheels for bringing in square feet of space at 5900 Opus Drive. Kraft CEO | Principal | Columbus
new manufacturing in the energy and high tech also vacated roughly 160,000 from 2225 Speigel 8800 Lyra Drive
Drive. Suite # 150
sectors. These groups will continue to play a big
Columbus, Ohio 43240
factor in bringing in new tenants and for retaining
TEL +1 614 410 5612
current regional players. SOUTH
FAX +1 614 410 3312
The southern submarkets are Pickaway and
Market Activity Volume is the sum of the absolute Fairfield counties. Fairfield saw a change of Leslie Hobbs
value of each absorption change in the market. negative 17,600 square feet of absorption. Marketing and Research Manager
The Market Activity Volume was down Pickaway experienced 8,800 of negative 8800 Lyra Drive
Suite #150
significantly from Q1 2010 when nearly 5.5 absorption. The vacancy rates for these two
Columbus, Ohio, 43240
million square feet of space was in transition. submarkets are among the lowest in the region
TEL +1 614 410 5640
Slightly more than 2.8 million square feet of but neither submarket represents a significant
FAX +1 614 410 3310
space was in transition in Q1 2011. amount of total square footage.
Low transaction volume compared to year-ago Jonathan Badgley
numbers is an important measure of SOUTHWEST Research Analyst
8800 Lyra Drive
The Southwest submarket returned almost as Suite # 150
CENTRAL BUSINESS DISTRICT much as was gained in the fourth quarter 2010 Columbus, Ohio, 43240
with 117,548 negative absorption. Prices have TEL +1 614 410 5652
The Central Business District (CBD) recorded a
remained stable in this submarket. FAX +1 614 410 3327
second straight quarter of positive absorption
with 39,385 square feet, though it leaves the
vacancy rate relatively unchanged. WEST
The submarkets on the west side of Franklin This document/email has been prepared by Colliers
EAST county are West, Madison, and Union. The West International for advertising purposes. Colliers
International statistics and data are audited annually and
submarket experienced a relatively insignificant
The submarkets comprising eastern Columbus may result in revisions to previously reported quarterly
positive absorption of 135,714 square feet. and final year-end figures. Sources include Columbus
are East and Licking County. The East Dispatch, Business First, Xceligent, and the Wall Street
experienced a relatively small amount of negative Journal.
CSX purchased both 1999 Westbelt Drive and
absorption in the first quarter with slightly more
2000 Westbelt Drive. The firm plans to demolish
than 84,000 square feet left unoccupied. Two
the 202,000-square-foot 1999 Westbelt Drive.
larger changes did occur in Licking but the
The firms plans for 2000 Westbelt Drive are
vacancy remained unchanged: 100,000 square
unknown.
feet was vacated at 111 Enterprise Drive and
100,000 square feet was occupied at 113
Enterprise Drive.
Accelerating success.
www.colliers.com/columbus