SlideShare une entreprise Scribd logo
1  sur  81
Télécharger pour lire hors ligne
TALAT Lecture 2401


                  Fatigue Behaviour and Analysis

                                  81 pages, 56 figures

                                    Advanced Level

          prepared by Dimitris Kosteas, Technische Universität München


Objectives:
− To understand why, when and where fatigue problems may arise and the special
  significance to aluminium as structural material
− To understand the effects of material and loading parameters on fatigue
− To appreciate the statistical nature of fatigue and its importance in data analysis,
  evaluation and use
− To estimate fatigue life under service conditions of time-dependent, variable
  amplitude loading
− To estimate stresses acting in notches and welds with conceptual approaches other
  than nominal stress
− To provide qualitative and quantitative information on the classification of welded
  details and allow for more sophisticated design procedures

Prerequisites:
− Background in materials engineering, design and fatigue


Date of Issue: 1994
   EAA - Euro p ean Aluminium Asso ciatio n
2401 Fatigue Behaviour and Analysis


Table of Contents

 2401.01 Introduction............................................................................................... 4
    Significance of the Fatigue Problem and its Influence on Design ...........................4
    Significance of Fatigue for Aluminium Structures ..................................................5
    Potential Sites for Fatigue Cracks............................................................................5
    Conditions for Susceptibility ...................................................................................6
    Definitions ...............................................................................................................9
    Symbols..................................................................................................................16
 2401.02 Fatigue Damage and Influencing Parameters ...................................... 17
    Response of Material to Cyclic Loading................................................................18
    Generation of Fatigue Cracks ................................................................................20
    Fatigue Crack Growth............................................................................................23
    Crack Growth Mechanisms....................................................................................26
    Effect of other Parameters on Crack Propagation Rate .........................................28
    Endurance Limit.....................................................................................................29
    Predictive Theories of Fatigue ...............................................................................29
    Damage Accumulation Theories............................................................................30
    Manson-Coffin Law...............................................................................................30
    Crack Growth Laws ...............................................................................................32
    Ideal Cumulative Damage Theory .........................................................................32
 2401.03 Fatigue Data Analysis and Evaluation.................................................. 34
    Analysis of Data.....................................................................................................35
    Analysis in the Middle-Cycle Fatigue Range ........................................................36
    Analysis in the High-Cycle Fatigue Range ............................................................38
    Fatigue Diagrams ...................................................................................................39
    Linear P-S-N Curves..............................................................................................41
    Non-Linear P-S-N Curves......................................................................................42
    Some Problems of Data Analysis in Practice.........................................................43


TALAT 2401                                               2
2401.04 Load Spectra and Damage Accumulation ............................................ 46
    Service Behaviour..................................................................................................46
    Time Dependent Loads ..........................................................................................47
    Spectrum Definition and Cycle Counting..............................................................47
    The Rain-Flow Cycle Counting Method................................................................50
    The Service Behaviour Fatigue Test ......................................................................51
    Analytical Life Estimation and Damage Accumulation ........................................54
    The Palmgren-Miner Linear Damage Accumulation Hypothesis..........................55
    Service Behaviour Assessment ..............................................................................58
    Literature................................................................................................................60
 2401.05 Local Stress Concepts and Fatigue........................................................ 61
    Analytical Relationship between Strain and Fatigue Life......................................61
    Notch Theory Concept ...........................................................................................62
    The Strain-Life Diagram ........................................................................................63
    References..............................................................................................................65
    Remarks .................................................................................................................65
 2401.06 Effects of Weld Imperfections on Fatigue ............................................ 66
    Types of Imperfections ..........................................................................................67
    Influence of Imperfections on Static Strength .......................................................69
    Influence of Imperfections on Fatigue Strength.....................................................71
       Cracks ............................................................................................................... 72
       Porosity............................................................................................................. 72
       Inclusions, Oxides ............................................................................................. 74
       Lack of Penetration - Lack of Fusion ............................................................... 74
       Weld Shape........................................................................................................ 76
       Geometric Misalignment................................................................................... 76
       Arc Strike, Spatter............................................................................................. 77
       Post-Weld Mechanical Imperfections ............................................................... 77
 2401.07 Literature/References ............................................................................... 79
 2401.08 List of Figures............................................................................................ 80


TALAT 2401                                               3
2401.01        Introduction
          •   Significance of the fatigue problem and its influence on design
          •   Significance of fatigue for aluminium structures
          •   Potential sites for fatigue cracks
          •   Conditions for susceptibility
          •   Definitions
          •   Symbols

Significance of the Fatigue Problem and its Influence on Design

Structures subjected to fluctuating service loads in sufficient numbers are liable to fail
by fatigue. Although the number of structures that have failed by fatigue under service
conditions is low the consequences can be costly in terms of human life and/or property
damage. Consequences may be catastrophic especially when no appropriate inspection
intervals are observed and fatigue damage can grow and accumulate during service life.

Today's understanding of fatigue mechanisms, the experimental data available, in many
cases the manufacturing process of constructional components, and the analytical
methods applied offer a high degree of sophistication in the design procedures.
However, currently the most important task is educational. It must be granted that all
aspects of the fatigue problem and of fracture control are not yet universally available
during engineering education. The following chapters try to give an overall outline of
mechanisms, influencing parameters, analytical methods, and suggestions for better
design. Beyond this the engineer must deal with actual problems. Experience is the best
teacher, and so calculation examples have been added to the theoretical information.

For structures under fatigue loads the degree of compliance with the static limit state
criteria given in other sections of these design rules may not serve as any useful guide to
the risk of fatigue failure.

It is necessary therefore to establish as early as possible the extent to which fatigue is
likely to control the design. In doing this the following factors are important.

a)    an accurate prediction of the complete loading sequence throughout the design life
      should be available.
b)    the elastic response of the structure under these loads should be accurately
      assessed
c)    detail design, methods of manufacture and degree of quality control can have a
      major influence on fatigue strength, and should be defined more precisely than for
      statically controlled members. This can have a significant influence on design and
      construction cost.


TALAT 2401                               4
Significance of Fatigue for Aluminium Structures

Aluminium due to its physical and mechanical properties often finds application in areas
where the ratio of dead weight of the structure to the total weight is significantly lower
than in structures with steel or concrete. This implies that structural applications will be
governed by a different ratio of minimum to maximum stresses. Such applications may
also be frequently found in areas of severe environmental exposure. Because of
applications in transportation area there is also a pressure on the design engineer to
choose a light-weight, but then damage-prone, structure.

A great deal can be accomplished in terms of complementary methods of analysis
utilising recent developments in fracture mechanics and respective data for aluminium
alloys and joints in aluminium structures. It is only but recently that such methods and
data have been systematically documented and are now been made available to practical
design.

It should be kept in mind that rules and design values stated for steel structures cannot in
every case be assumed for or adapted to respective problems in aluminium.

Potential Sites for Fatigue Cracks

Most common initiation sites for fatigue cracks are as follows:

a) toes and roots of fusion welds
b) machined corners and drilled holes
c) surfaces under high contact pressure (fretting)
d) roots of fastener threads

In a typical structural component designed statically the fatigue assessment will not
normally present a more severe demand to be fulfilled. Only in cases of respective
applications with frequent and significant load variations fatigue will be the governing
criterion.

In a comparative study (Kosteas/Ondra: "Abgrenzung der Festigkeitsnachweise im
Leichtmetallbau. Research report 235/91, Munich 01.10.1992) for an aluminium column
for which both a static and a fatigue assessment were performed, it can be demonstrated
that the static limit state assessment (ultimate limit state, flexural/torsional buckling,
local buckling, deflection) limits the applicability range of the fatigue design S-N curves
to approx. above 105 cycles. An extrapolation of design S-N curves down to 104 will
rarely have any practical meaning. Bearing in mind that with a variation or enhancement
of the geometrical dimensions of the calculated case the relative static limit state
assessments will have a more pronounced influence, the applicability range of fatigue
design moves to even higher cycle numbers.


TALAT 2401                                5
Conditions for Susceptibility

The main conditions affecting fatigue performance are as follows:

a)   high ratio of dynamic to static load. Moving or lifting structures, such as land or
     sea transport vehicles, cranes, etc. are more likely to be prone to fatigue problems
     than fixed structures unless the latter are predominately carrying moving loads as
     in the case of bridges.
b)   frequent applications of load. This results in a high number of cycles in the design
     life. Slender structures or members with low natural frequencies are particularly
     prone to resonance and enhance magnification of dynamic stress, even though the
     static design stresses are low. Structures subjected predominantly to fluid loading,
     such as wind and structures supporting machinery, should be carefully checked for
     resonance effects.
c)   use of welding. Some commonly used welded details have low fatigue strength.
     This applies not only to joints between members, but also to any attachment to a
     loaded member, whether or not the resulting connection is considered to be
     'structural'.
d)   complexity of joint detail. Complex joints frequently result in high stress concen-
     trations due to local variations in stiffness of the load path. While these may have
     little effect on the ultimate static capacity of the joint, they can have a severe effect
     on fatigue resistance. If fatigue is dominant, the member cross-sectional shape
     should be selected to ensure smoothness and simplicity of joint design, so that
     stresses can be calculated and adequate standards of fabrication and inspection can
     be assured.
e)   environment. In certain thermal and chemical environments fatigue strength may
     be reduced.

Figure 2401.01.01 Fatigue - Where?


                                                          Fatigue - Where?
                            bridges

                            highway-sign-bridges

                            parts of buildings

                            cranes, machinery

                            off-shore components

                            components of land or

                            sea vehicles


          Source: D. Kosteas, TUM

                                                alu
                                                                Fatigue - Where?   2401.01.01
         Training in Aluminium Application Technologies


TALAT 2401                                                         6
Figure 2401.01.02 Fatigue - Location


                                                    Frequent Fatigue Location Sites

                                                                                            Toes and roots of
                                                                                            fusion welds

                                                                                            Surfaces under high
                                                                                            contact pressure

                                                                                            Fastener threads


                                                                                            Machined corners
                                                                                            and drilled holes


       Source: D. Kosteas, TUM

                                              alu
                                                                   Fatigue - Location                    2401.01.02
       Training in Aluminium Application Technologies


Figure 2401.01.03 Fatigue - When and What?


                                                        Fatigue - When and What?


                              When:                       subjected to fluctuating service loads in
                                                          sufficient numbers

                                  What: cracks initiate + propagate to final failure

                                                          consequences are costly in terms of
                                                          human life and property damage


         Source: D. Kosteas, TUM

                                               alu
                                                                 Fatigue - When and What?                2401.01.03
        Training in Aluminium Application Technologies


TALAT 2401                                                             7
Figure 2401.01.04 Fatigue - The Remedy


                                                                Fatigue - The Remedy

                                      # educate for good design + fracture control
                                      # predict service load history, assess damage

                                                       Bear in mind:
                                                                !   design,
                                                                !   manufacturing and
                                                                !   degree of quality control have major
                                                                    influence on fatigue strength, and influence
                                                                !   design and construction costs significantly

                Source: D. Kosteas, TUM

                                                      alu
                                                                          Fatigue - The Remedy               2401.01.04
               Training in Aluminium Application Technologies


Figure 2401.01.05 Fatigue - Significance for Aluminium

                                             Fatigue - Significance for Al


                                            Due to its physical and mechanical properties
                                            (low specific weight, low modulus of elasticity,
                                            corrosion resistance) aluminium is found frequently
                                            in applications with:

                                          ! ratio σmin/σmax different from steel or concrete

                                          !              severe environmental exposure

                                          !              light-weight transportation,         # damage-prone

   Source: D. Kosteas, TUM

                                            alu
                                                                     Fatigue - Significance for Al          2401.01.05
   Training in Aluminium Application Technologies


TALAT 2401                                                                      8
Definitions


Block                        a specified number of constant amplitude loading cy-
                             cles applied consecutively, or a spectrum loading se-
                             quence of finite length that is repeated identically

Confidence Interval          an interval estimate of a population parameter com-
                             puted so that the statement 'the population parameter
                             included in this interval will be true, on the average,
                             in a stated portion of the times such computations
                             are made based on different samples from the
                             population.

Confidence Level             the stated proportion of the times the confidence in-
                             terval is expected to include the population
                             parameter

Confidence Limits            the two statistics that define a confidence interval

Constant Amplitude Loading   a loading in which all of the peak loads are equal and
                             all of the valley loads are equal

Constant Life Diagram        a plot (usually on rectangular co-ordinates) of a
                             family of curves each of which is for a single fatigue
                             life, N, relating stress amplitude ∆σ, to mean stress
                             σm or maximum stress σmax, or to minimum stress,
                             σmin.

Corrosion Fatigue            synergistic effect of fatigue and aggressive environ-
                             ment acting simultaneously, which leads to a degra-
                             dation in fatigue behaviour.

Counting Method              a method of counting the occurrences and defining
                             the magnitude of various loading parameters from a
                             load-time history; (some of the counting methods
                             are: level crossing count, peak count, mean crossing
                             peak count, range count, range-pair count, rain-flow
                             count, race-track count).

Crack Size a                 a lineal measure of a principal planar dimension of a
                             crack, commonly used in the calculation of
                             quantities descriptive of the stress and displacement
                             fields, and often also termed 'crack length'.

Cut-Off Limit                the fatigue strength at 1*108 cycles corresponding to
                             the S-N curve. All stresses below this limit may be
                             ignored


TALAT 2401                        9
Cycle                       one complete sequence of values of load that is
                            repeated under constant amplitude loading. The
                            symbol n or N is used to indicate the number of
                            cycles (see definition of fatigue life).

Cycles Endured              the number of cycles of specified character (that pro-
                            duce fluctuating load) which a specimen has endured
                            at any time in its load history

Cycle Ratio                 the ratio of cycles endured, n, to the estimated
                            fatigue life (S-N) or the strain versus fatigue life (ε-
                            N) diagram for cycles of the same character, that is,
                            C=n/N

Design Life                 the period during which the structure is required to
                            perform without repair

Design Spectrum             the total of all stress spectra, caused by all loading
                            events during design life, to be used in the fatigue
                            assessment

Discontinuity               an absence of material causing stress concentration.
                            Typical discontinuities are cracks, scratches, corro-
                            sion pits, lack of penetration, porosity or undercut

Environment                 the aggregate of chemical species and energy that
                            surrounds the test specimen

Estimation                  a procedure for making a statistical inference about
                            the numerical values of one or more unknown popu-
                            lation parameters from observed values in sample

Fail-Safe                   fatigue limit state assessing the gradual, stable crack
                            propagation

Fatigue                     the process of progressive localised permanent struc-
                            tural change occurring in a material subjected to con-
                            ditions that produce fluctuating stresses and strains
                            at some point or points and that may culminate in
                            cracks or complete fracture after a sufficient number
                            of fluctuations

Fatigue Crack Growth Rate   the rate of crack extension caused by constant ampli-
                            tude fatigue loading, expressed in terms of crack ex-
                            tension per cycle of fatigue (da/dN)

Fatigue Life N              the number of loading cycles of a specified character
                            that a given specimen sustains before failure of a
                            specified nature occurs


TALAT 2401                       10
Fatigue Limit σf            theoretically the fatigue strength for N→∞, or the
                            limiting value of the median fatigue strength as the
                            fatigue life, N, becomes very large. When all stresses
                            are less than the fatigue limit, no fatigue assessment
                            is required. In most cases the fatigue limit is given at
                            2*106 or 5*106 cycles.

Fatigue Loading             periodic or non-periodic fluctuation loading applied
                            to a test specimen or experienced by a structure in
                            service (also known as cyclic loading).

Fatigue Notch Factor Kf     the ratio of the fatigue strength of a specimen with
                            no stress concentration to the fatigue strength of a
                            specimen with a stress concentration for the same
                            percent survival at N cycles and for the same
                            conditions

Fatigue Notch Sensitivity   a measure of the degree of agreement between
                            fatigue notch factor Kf and the theoretical stress
                            concentration factor Kt

Fatigue Strength            a value of stress for failure at exactly N cycles as de-
                            termined from a S-N diagram. The value of SN thus
                            determined is subject to the same conditions as those
                            which applied to the S-N diagram

Group                       the specimens of the same type tested at one time, or
                            consecutively, at one stress level. A group may com-
                            prise one or more specimens

Hysteresis                  the stress-strain path during the cycle

Loading Amplitude           one half of the range of a cycle

Loading Event               a well defined loading sequence on the entire struc-
                            ture caused by the occurrence of a loading. This may
                            be the approach, passage and departure of a vehicle
                            or device on the structure

Loading (Unloading) Rate    the time rate of change in the monotonic increasing
                            (decreasing) portion of the load time function

Load Stress Ratio R         the algebraic ratio of the two loading parameters of a
                            cycle; the most widely used ratio is

                            R = Pmin/Pmax = σmin/σmax

Maximum Load Pmax           the load having the highest algebraic value


TALAT 2401                       11
Maximum Stress σmax         the stress having the highest algebraic value

Mean Load Pm                the algebraic average of the maximum and minimum
                            loads in constant amplitude loading, or of individual
                            cycles in spectrum loading, or the integral average of
                            the instantaneous load values of a spectrum loading
                            history

Mean Stress σm              the algebraic average of the maximum and minimum
                            stresses in constant amplitude loading, or of
                            individual cycles in spectrum loading, or the integral
                            average of the instantaneous stress values of a
                            spectrum loading history

Miner's Summation           a linear damage             accumulation    calculation
                            (Palmgren-Miner rule)

Minimum Load Pmin           load having the lowest algebraic value

Minimum Stress σmin         stress having the lowest algebraic value

Nominal Stress              the applied stress calculated on the area of the net
                            section of the structural component by simple theory
                            ignoring stress raisers and disregarding plastic flow

Parameter                   a constant (usually to be estimated) defining some
                            property of the frequency distribution of the popula-
                            tion, such as a population median or a population of
                            a standard deviation

Peak                        the occurrence where the fatigue derivative of the
                            load time history changes from positive to negative
                            sign; the point of maximum load in constant
                            amplitude loading

Population                  the totality of set of test specimens, real or
                            conceptual, that could prepared in the specified way
                            from the material under consideration

Probability of Failure P    the ratio of the number of observations failing in
                            fatigue to the total number of observations

Probability of Survival Q   it follows that P + Q = 1

Random Loading              a spectrum load where the peak and valley loads and
                            their sequence result of a random process; the
                            loading is usually described in terms of its statistical
                            properties, such as the probability density function,


TALAT 2401                       12
the mean, the root mean square, the irregularity
                    factor, and others as appropriate

Range ∆P, ∆σ, ∆ε    the algebraic difference between successive valley
                    and peak loads (positive range or increasing load
                    range) or between successive peak and valley loads
                    (negative range or decreasing load range).

Reversal            the occurrence where the first derivative of the load-
                    time history changes sign

Run-Out             the piece at a number of cycles at which no apparent
                    fatigue damage has been observed and test is
                    continued

Sample              the specimens selected from the population for test
                    purposes

Significance        an effect or difference between populations is said to
                    be present if the value of a test-statistic is significant,
                    that is, lies outside of selected limits

Survival Limit p%   a curve fitted to the fatigue life for p% survival va-
                    lues of each several stress levels. It is an estimate of
                    the relationship between stress and the number of
                    cycles to failure that p% of the population would
                    survive, p may be any percent (in most cases p is set
                    equal 97.5%)

S-N Diagram         a plot of stresses against the number of cycles to
                    failure. The stress can be the maximum stress σmax,
                    the minimum stress σmin, or stress range ∆σ. The
                    diagram indicates the S-N relationship for a
                    specified value of σm or R and a specified
                    probability of survival. For N a log scale is almost
                    always used. For σ a linear scale or log scale is used
                    in most cases.

Spectrum Loading    a loading in which all of the peak loads are not equal
                    or all of the valley loads are not equal (also known
                    as variable amplitude loading)

Statistic           a summary value calculated from the observed
                    values in a sample

Stress Level        the pair of stress (or strain) components necessary to
                    define the applied cycle


TALAT 2401               13
Stress Ratio R                   the algebraic ratio of the minimum stress to the
                                 maximum stress in one cycle, R = σmin/σmax

Stress Intensity Factor K        the magnitude of the ideal-crack-tip stress field (a
                                 stress-field singularity) for a particular mode in a
                                 homogeneous, linear elastic body

Stress Concentration Factor Kt   the ratio of the greatest stress in the region of a notch
                                 as determined by advanced theory to the
                                 corresponding stress

Test of Significance             a statistical test that purports to provide a test of a
                                 null hypothesis, for example, that an imposed
                                 treatment in the experiment is without effect

Tolerance Interval               an interval computed so that it will include at least a
                                 stated percentage of the population with stated prob-
                                 ability

Tolerance Limit                  the two statistics that define a tolerance interval

Truncation                       the exclusion of cycles with values above, or the ex-
                                 clusion of cycles with values below a specified level
                                 (referred to as truncation level) of a loading para-
                                 meter

Valley                           The occurrence where the first derivative of the lad
                                 time history changes from negative to positive sign;
                                 the point of minimum load in constant amplitude
                                 loading

Variable Amplitude Loading       see spectrum loading


TALAT 2401                            14
Figure 2401.01.06 Definitions: Constant Amplitude Loading


                                          Definitions: Constant Amplitude Loading


                                                                                                              maximum, Pmax

                                                                                                       amplitude, Pa
                                                                                                              mean, Pm
                         Load


                                                     range
                                                                                                       amplitude, Pa

                                                                                                              minimum, Pmin
                                                                                    cycle


                                                                                                                 Time


                                            alu

    Training in Aluminium Application Technologies
                                                             Definitions: Constant Amplitude Loading                    2401.01.06


Figure 2401.01.07 Definitions: Spectrum Loading


                                                       Definitions: Spectrum Loading

                                                                             peak
                                                                                                  reversal


                             (+) range                                                                           (-) range
              Load


                                                                         mean
                                                                                                             mean crossing
                                                                    valley                  reversal

                                                                                                                       Time


                                           alu

    Training in Aluminium Application Technologies
                                                                 Definitions: Spectrum Loading                          2401.01.07


TALAT 2401                                                                   15
Symbols

a            crack length
e            eccentricity
E            modulus of elasticity
G            shear modulus
K            stress intensity factor
l            length of attachments
m            slope constant in fatigue strength equation
ni           number of cycles corresponding to specified stresses σi
N            number of cycles corresponding to a particular fatigue strength
Nc           cut-off-limit
R            stress ratio R = σmin/σmax
t            plate thickness
Rm           ultimate tensile strength
Rp,0.2       tensile strength at ε = 0.2 %
εmax         maximum strain
εmin         minimum strain
∆ε           strain range
σmax         maximum stress
σmin         minimum stress
σres         residual stress
∆σ           stress range ∆σ = σmax - σmin
∆σe          equivalent constant amplitude stress calculated from the respective
             stress range spectrum for a particular value for m
τ            shear stress


TALAT 2401                        16
2401.02        Fatigue Damage and Influencing Parameters
          •    Response of material to cyclic loading
          •    Generation of fatigue cracks
          •    Fatigue crack growth
          •    Crack growth mechanism
          •    Effect of other parameters on crack propagation rate
          •    Endurance limit
          •    Predictive theories of fatigue
          •    Damage accumulation theories
          •    Manson-Coffin law
          •    Crack growth laws
          •    Ideal cumulative damage theory


Fatigue damage occurs in metals due to local concentrations of plastic strain.
Consequently minimising these strain concentrations must be the first rule for avoiding
fatigue failure. As an alternative or complementary method a material must be chosen
which best resists the mechanisms which lead to cracks and their growth.

It is important to understand these mechanisms and the influence of them on material
properties, load amplitudes and their sequence, temperature and environment. We treat
the problem in a simplified view recognising the fact that real structures contain discon-
tinuities which may develop into cracks with applications of stress, progressive crack
extension following up to final failure. We study thus the material response to cyclic
loading at temperatures in the sub-creep range. Procedures for minimising, repairing and
detecting fatigue damage can be thus applied intelligently.

By far the most common mode of fatigue failure consists simply of initiation and propa-
gation of cracks to the point of static failure. A degradation of material properties during
fatigue is not normally observed.

Superimposed on the general response of the material to cyclic loading, i.e. hardening or
softening depending on the material, the load amplitude and the temperature, localised
plastic deformation develops at stress concentration points. This repeated, localised
plastic deformation leads to crack initiation. Provided the local stress concentration ex-
ceeds a certain threshold, a fatigue crack, once initiated, continues to grow a finite
amount during each cycle.

Crack propagation occupies a major portion of fatigue life, especially at high load am-
plitudes. Final failure may be the result of the growth of one crack, or of many small
cracks coalescing into a final crack. The higher the load amplitude, the more likely the
production of multiple cracks. Corrosive environment also produces multiple cracking
and accelerates failure.


TALAT 2401                                17
Final catastrophic failure occurs when a crack has grown to a critical length such that
the next application of load produces static failure of the remaining net section. Under
service conditions of variable amplitude loading, the critical crack length must be
defined of course, in terms of the highest expected load and the total load spectrum.
Redundant structures, i.e. structures designed with 'crack arrestors' stopping the rapid
growth of critical cracks before they weaken the integrity of the total structure, represent
an important advance in fatigue design based on the previously described crack growth
mechanisms.

Response of Material to Cyclic Loading

The familiar stress-strain relation and work hardening under static, tensile loading con-
dition forms practically the first quarter-cycle of an extended fatigue test. The fatigue
test itself can be performed in a stress- or strain-controlled manner. The stress amplitude
σ or strain amplitude ε, the mean stress or strain, and the number of cycles N
characterise the usual fatigue test. For strain-controlled tests one has to distinguish
between control of either the total or the plastic strain amplitude.


                                                     Stress- or Strain Control
                                    σ                                                      σ


                                  ∆σ                                                                σp
                                                                 $                         ∆tp         $


               (a) Stress-controlled stress strain loops                   (b) Strain-controlled stress-strain loops


               σp                                                           σp
                                                           σs                                        σs
                                                                     N                                         N
                (c) Strain-controlled hardening                             (d) Strain-controlled softening (initially
                                                                                cold worked metal)
    Source: J. C. Grosskreutz, 1970

                                           alu                  Stress-Strain Loops:
    Training in Aluminium Application Technologies      (a) Stress Control, (b) Strain Control              2401.02.01


If the stress range ∆σ is controlled and maintained constant, the strain amplitude gradu-
ally decreases, Figure 2401.02.01. If the plastic strain range ∆εp is controlled, the stress
amplitude required to maintain the strain limit gradually increases. A fatigue hardening
or softening curve is represented by the peak stress amplitude σp when each cycle is
plotted against the number of cycles. Such curves generally show that rapid hardening or
softening occurs in the first few percent of total fatigue life. Eventually the material
'shakes down' into a steady-state or saturation condition in which the rate of hardening
or softening becomes zero. The magnitude of the saturation stress, σs depends on the


TALAT 2401                                                           18
plastic strain amplitude, the temperature and the initial degree of cold work - σs
increases when ∆εp is increased or the temperature is decreased. Aluminium exhibits
generally a unique saturation stress σs for a given ∆εp and temperature independent of
prior load history (the so-called wavy-slip mode).

The locus of the tips of all stead-state cyclic loops of                                           width ∆εp forms the so-called
'cyclic stress-strain curve', i.e. the steady-state cyclic                                         stress strain behaviour of the
material. The curve is generated by plotting (for a                                                given temperature and initial
condition) the saturation stress vs. ∆εp/2, (Figure                                                2401.02.02). An approximate
expression for the cyclic stress-strain curve is:

                                                                      σs = σo (∆εp/2)n'

where

σo is a constant and n' is the cyclic strain hardening exponent with a value of approxi-
mately 0.15 for wavy-slip mode materials such as aluminium.

The above equation is extremely useful in low cycle fatigue applications. It gives in con-
venient form the stable stress amplitudes to be expected from a given imposed strain
amplitude, or vice-versa. Using it, one can convert easily from Manson-Coffin type
plots of log(∆σp) vs. log(n) to S-N plots.


                                                     Cyclic Stress-                            Monotonic Stress-Strain Curve
                                                     Strain Curve              σ
                                             σ
                                                                                          Cold Worked Material

                                                                                                                  Cyclic Stress-
                                                                                                                  Strain Curve
                                                                               Stress


                                                                  εp                          Annealed Material

                                                                                                                  Monotonic Stress-
                                                                                                                  Strain Curve

                                                       Stable Loops                     Plastic Strain of ∆εp/2
                Construction of the cyclic stress-                              Comparison of monotonic tensile and cyclic
                strain curve from stable loops                                  stress-strain curves. For aluminium - a wavy slip
                                                                                mode material - the two cyclic stress-
                                                                                strain curves would be identical.
    after Feltner and Laird, 1967

                                           alu
                                                                  Cyclic Stress-Strain Curve                           2401.02.02
    Training in Aluminium Application Technologies


TALAT 2401                                                                19
On a microscopic scale the movement of dislocations in the crystal structure leads to the
saturation condition as described above and serves only to determine the flow stress of
the metal, i.e. its hardness.

Fatigue hardening/softening mechanisms in complex, precipitation hardened alloys such
as the 7000 series of aluminium alloys are not as straightforward. Nevertheless, the main
product of the cycling is again a dense array of dislocations whose presence per se does
not serve to weaken the material. In certain, specific cases, cyclic straining can cause
actual degradation of the precipitate structure in an alloy, thus causing irreversible
softening. The softened zones can then become the sites of fatigue failure. A
controversy exists over whether such action occurs in high-purity Al-4Cu alloys. No
such softening has ever been observed in commercial aluminium alloys, however
(Figure 2402.02.02).

In the presence of stress concentration, enhanced fatigue hardening will occur in propor-
tion to the stress or strain concentration factor. One can expect this enhancement in the
vicinity of notches, fasteners, welds, and most importantly, near the tip of a fatigue
crack.


Generation of Fatigue Cracks

When is a crack ?

For the practitioner a crack exists when he can see it with the observational technique,
he normally employs for such purposes, the naked eye, a glass magnifier, a metallogra-
phic microscope, or an electron microscope. A fatigue crack may vary in length from
anywhere from 3mm down to 1000Å.

Defining a crack in terms of the highest resolving power instrument available (the elec-
tron microscope for instance) it is possible to establish a number of load cycles NI, to
generate an observable fatigue crack. It is usual to express the result in terms of the
fraction of total life, NI/NT. It has been shown that this ratio is normally a small number
in unnotched members, about 0.1, so that fatigue crack propagation occupies a large
percentage of total life. This is especially true in structural components with existing
imperfections due to manufacturing. Nevertheless the mechanisms of crack initiation
and respective estimation of life cycles are important for certain applications in the high-
cycle range.

As already mentioned fatigue cracks always begin at concentrations of plastic strain.
Consequently if no other manufacturing imperfections are present fatigue cracks have
their origins at the surface. The so-called slip band formation, extrusions and intrusions
on the surface of an otherwise uncracked material form fatigue crack initiation sites
(Figure 2401.02.03).


TALAT 2401                                20
Notch-Peak Geometry of Slip Bands at a Free Surface

                                                                            Surface


                                                                           nd
                                                                        pBa
                                                                     Sli


                                                 alu

          Training in Aluminium Application Technologies
                                                                Notch-Peak Geometry of Slip Bands            2401.02.03


Under high amplitude loading fatigue cracks start at grain boundaries in pure alumini-
um. In many commercial alloys the existence of large second phase particles, inclusions,
play a predominant role in crack generation. They cause localised plastic deformation
leading to cracking usually at the inclusion matrix interface (Figure 2401.02.04).


                                 Fatigue Crack Initiation at a Surface Inclusion
                                                                   after 5% of Total Life
                                                                 2024-T4 Aluminium Alloy


                                                             Inclusion


                                                                                 Fatigue Crack


       after J. C, Grosskreutz, ASTM STP 495, 1970

                                               alu

       Training in Aluminium Application Technologies
                                                           Fatigue Crack Initiation at a Surface Inclusion   2401.02.04


Other flaws such as internal voids or large surface scratches may be the sites of fatigue
crack generation. Such flaws need only the application of cyclic load to begin their
growth as bona fide fatigue cracks.


TALAT 2401                                                                      21
Joints are an important site for fatigue crack generation in structures since they exhibit
substantial stress concentration points, notches, either on the free surface of the compo-
nent or at internal surfaces, such as lack of penetration in welds. Another cause for fati-
gue crack formation at joints may be fretting.

There is indication that cracks must reach a minimum critical size before they can begin
propagating. Nonpropagating microcracks which have been observed at very low stress
amplitudes may be examples of cracks, for which the generation mechanism ceased to
operate before they reached critical size.

The value of NI/NT is dependent of the load amplitude, specimen geometry, material
properties, the temperature, previous loading history, and the environment. In very gene-
ral terms the following statements help to describe the various effects.

The value of NI/NT decreases with increasing load amplitude, so that in the extreme low
cycle range the entire life is consumed in crack propagation and in the extreme high cy-
cle range a substantial portion of the entire life is consumed in crack initiation. With in-
creasing load amplitude a larger number of cracks are generated. A stress concentration
will reduce NI/NT (Table 1). Microcracks will develop more quickly in wavy-slip mode
materials. Cracks develop sooner in more ductile materials as illustrated by comparing
the notched 2014 and 2024 aluminium alloy with the 7075 alloy.

The combination of fatigue stresses and even a mildly corrosive environment accelerates
the time for crack generation. The effects on later crack growth are even more pronou-
nced. One of the more important environmental constituents is water vapour which has a
strong effect on the fatigue of aluminium and its alloys. Previous load history can have
two effects. First, if the material has been hardened, as already mentioned in the case
with commercial aluminium alloys, the yield stress is increased, and under constant
stress conditions, the time to generate a crack would be increased. Secondly, prior load-
ing can produce significant residual stresses at the root of a notch. For example prior
tensile stress will leave a compressive residual stress, and cracks at the notch root will
be very slow in developing compared to the annealed state. A similar situation may arise
by superimposed stress conditions such as mean stresses due to external loads or to
residual stresses. Treatments such as shot-peening are used to induce compressive resid-
ual stresses on surfaces, so that NI can be significantly increased.

Before applying any of these guidelines to a specific situation it should first be ascertai-
ned whether cracks already may exist, in which case the crack generation state, often
referred to as crack initiation stage as well, is effectively bypassed. Many real structures
already contain microcracks before the first service load is ever applied.


TALAT 2401                                22
Material        Specimen        Crack Site      NT                Cracklength    NI/NT
                Geometry                        Cycles            at first
                                                                  observation
                                                                  10-2 mm
Pure Al         smooth          Grain           3 ⋅ 105           1.3            0.10
                                Boundary
2024-T3         smooth                          5 ⋅ 104           10.2           0.40
                smooth                          1 ⋅ 106           10.2           0.70
2024-T4         smooth                          150               25             0.60
                                                1 ⋅ 103           25             0.72
                                                5 ⋅ 103           25             0.88
Pure Al         notched         slip bands      2 ⋅ 106           0.025          0.005
                Kt≈2
2024-T4         notched         inclusions      1 ⋅ 105           2.0            0.05
                Kt≈2
                                                3 ⋅ 106           1              0.07
2014-T6         notched                         2 ⋅ 103           6.3            0.015
                Kt≈2
                                                2 ⋅ 104           6.3            0.02
                                                1 ⋅ 106           6.3            0.05
7075-T6         notched         inclusions      2 ⋅ 105           50             0.64
                Kt≈2
7075-T6         notched                         5 ⋅ 103           7.6            0.20
                Kt≈2
                                                1 ⋅ 105           7.6            0.40


Table 1: Crack generation time as a fraction of total life (after ASTM STP 495,
           Grosskreuz)

Fatigue Crack Growth

The increase in crack length ∆a for the increment ∆N of load cycles define the growth
rate, ∆a/∆N. This is a function of both, the crack length a and the stress or strain ampli-
tude. Observed growth rates may range between 10-10 m/cycle at low amplitudes to
about 10-3 m/cycle at high amplitudes. The importance of the growth rate lies in its use
to calculate remaining life times, given a certain initial crack length ai after NI load cy-
cles. Assuming that a is a continuous function of N, the instantaneous crack growth rate
da/dN can be used to give the total life for a crack propagation
                                                 aT
                                                        da
                               N P = NT − N I = ∫
                                                 aI (
                                                      da / dN )


TALAT 2401                                23
Desirable is a theory of fatigue crack growth yielding universal expressions for da/dN as
a function of a, σ or ∆εp, and material properties. Not only could such a theory be used
to predict fatigue lives, but it would allow a designer to choose those materials most re-
sistant to fatigue crack growth. Central to the construction of such a theory is a model
which can be described mathematically to give the incremental advance of the crack.
Such a model must be derived from experimental observation.

Respective analytical expressions, supported by experimental observations, in the case
of aluminium alloy structural components and their welded connections, as well as the
analytical procedures for life estimation will be explained in detail under a later chapter
on fracture mechanics applications. At this point some general observations on the pro-
pagation modes, the crack growth mechanisms and the effects of multiple load amplitu-
des and other parameters on da/dN will be briefly covered.

Cracks forming in slip bands propagate along the active slip planes which are inclined at
±45° with respect to the tensile stress axis. This shear mode propagation, Stage I
growth, tends to continue more deeply into the specimen the lower the amplitude of loa-
ding. The crack soon begins to turn and follow a course perpendicular to the tensile axis.
This tensile mode propagation as called Stage II growth, characterising crack growth up
to the critical length for which the next load peak produces tensile failure of the speci-
men (Figure 2401.02.05).


                                       Stage I and II Fatigue Crack Growth

                                                                      σ


                                                                      Stage II


                                                                          Stage I


     Source: C. Laird, 1967                                           σ
                                            alu

     Training in Aluminium Application Technologies
                                                      Stage I and II Fatigue Crack Growth   2401.02.05


Actually, the Stage I growth in a polycrystalline material involves hundreds of individu-
al slip band cracks linking up to form a dominant crack at about the time Stage II growth
begins. Stage II crack growth life increases with increasing load amplitude.

Cracks formed at inclusions grow only a few micrometers in Stage I before changing to
the Stage II mode. At low stress or strain amplitudes, very few inclusion cracks are gen-
erated and one such crack may grow all the way into the final failure crack. At higher


TALAT 2401                                                       24
amplitudes several inclusion cracks may joint together to form the final crack, thus
producing discontinuous jumps in da/dN. This case is of importance and will be de-
monstrated in more detail in the respective chapter on fracture mechanics applications to
welded connections.

Examination of fracture surfaces tells us a lot about the mechanism by which the crack
advances. For all practical purposes the entire fracture surface formed is governed by the
Stage II mode. Very near the crack nucleus, while the crack length is still small, condi-
tions of plane strain hold at the crack tip. The fracture surface is microscopically flat and
oriented perpendicular to the tensile axis. As the crack grows in length a shear lip begins
to develop where the fracture surface intersects the specimen surface (Figure
2401.02.06). This reorientation of the fracture surface to a 45° position with respect to
the tensile axis is caused by the plane stress conditions at the crack tip intersecting the
surface. As the plastic zone in front of the crack tip increases in dimension to become
comparable to that of the specimen thickness, plane stress conditions hold everywhere at
the crack tip and the fracture surface is one continuous shear lip or double shear lip.


               Fatigue Crack
                    Initiation                            Fatigue Crack Growth
                                                          Plane-strain crack growth occurs at 90°
                                                          w./r. to tensile axis near the point of initiation.
                                                                                    Propagation under plane-stress conditions
                                                                                    begins at a later stage and the crack
                                                                                    continues in 45° shear mode.


      after J. C, Grosskreutz, ASTM STP 495, 1970

                                            alu

     Training in Aluminium Application Technologies
                                                      Schematic Illustration of a Fatigue Fracture Surface           2401.02.06


The flat, plane strain surface is especially rich in detail, exhibiting regularly spaced stria-
tions, even visible at optical magnification. Each striation represents the crack advance
for one cycle of load and this was verified experimentally. The conclusion that each
striation corresponds to one cycle of crack advance allows one to measure the local rate
of crack growth by measuring the distance between adjacent striations. Careful ex-
periments have shown that these striations spacings correspond very closely to the mi-
croscopic rates of crack growth measured on the surface of the specimen. However the
first is consistently larger than the microscopic da/dN on the surface which indicates that
surface growth is only an average of local rates in the general direction of Stage II
growth.


TALAT 2401                                                                  25
Crack Growth Mechanisms

Crack growth rates can be expressed analytically for different crack lengths and for dif-
ferent loads in terms of the stress intensity factor range ∆K as will be shown later on.
The correlation of crack growth rates with a crack tip stress intensity factor provides the
key to a study of crack growth mechanisms. It is only recently that such correlations ha-
ve been experimentally verified on a reliable basis for aluminium alloys and especially
the material zones in aluminium weldments (Figure 2401.02.07).


                                                                                            ∆Keff [MPa√ m]
            Fatigue Crack                                               10-3
                                                                                 AlMg4.5Mn
            Growth Rate                                                 10-4     R=0
                                                                                 + base material
                                                                        10-5     x HAZ
                                                     da/dN [ m/LW ]


                                                                                 o weld
                                                                        10-6

                                                                        10-7

                                                                        10-8

                                                                        10-9

                                                                        10-10

                                                                        10-11
                                                                                0.6 1   2     4 6   10   20   40 60 100
                                                                                            ∆K [MPa√ m]
    Source: D. Kosteas and U. Graf, TUM

                                           alu

    Training in Aluminium Application Technologies
                                                                      Fatigue Crack Growth Rate                   2401.02.07


Cross sections taken through the crack tip at various parts of a load cycle have establis-
hed that Stage II growth occurs by repetitive blunting and re sharpening of the crack tip
(Figure 2401.02.08).


TALAT 2401                                                                      26
Fatigue Crack Growth by the Plastic Blunting Mechanism
                         (a) no load                                            (d) small compressive load


                        (b) small tensile load
                                                                                (e) max. compressive load


                         (c) max. tensile load                                   (f) small tensile load


        after C. Laird

                                             alu
                                                       Fatigue Crack Growth by the Plastic Blunting Mechanism   2401.02.08
      Training in Aluminium Application Technologies


Although many investigations of the micromechanisms of fatigue crack growth under
spectrum loading have been undertaken in the last decades as there is still an urgent
need for further work. However, results are available allowing to some general
statements on the effect of multiple load amplitudes.

In the first place it is important to distinguish between the effects of spectrum loading
on total life on a laboratory specimen and on the growth rate of an existing crack. Much
of the literature of spectrum loading has dealt only with total life and the concept of cu-
mulative damage. Because total life includes both crack initiation and crack propagati-
on, we cannot expect to apply such results to understanding the effect of multiple loads
on just crack growth.

The effects of multiple load amplitude can be best understood in terms of crack tip plas-
tic deformation. The concept of stress intensity factor is of limited use here because it
relates only to elastic stresses. The two important concepts are localised work hardening
and localised residual stresses at the crack tip. More on the practical application of such
analytical and experimental results will follow under the chapter on fracture mechanics,
especially in defining a so-called effective stress intensity range.

A particularly instructive set of experiments demonstrated in Figure 2401.02.09 depicts
the effect of various load sequences on the microscopic growth rate, as determined in
experiments on 2024-T3 aluminium, from striation spacings on the fracture surface.
Keeping the maximum load constant and varying the amplitude range had no significant
effect on crack growth. Reversing the sequence did not affect the results either. If the
load amplitude range was kept constant and the maximum load was varied, interaction
effects were observed.


TALAT 2401                                                                 27
No interaction effects.
                                                                                      Striation spacing stable for
                                                                                      each load amplitude range.


                                                                                      First cycle of each sequence
                                                                                      causes abnormally large
                                                                                      striation spacing.


                                                                                      Striation spacing in given
                                                                                      sequence is smaller than
                                                                                      in corresponding sequence
                                                                                      in ascending series above.
        after McMillan and Pelloux

                                            alu

     Training in Aluminium Application Technologies
                                                      Effect of Variable Load Sequence on Fatigue Crack Growth       2401.02.09


The importance of separating crack initiation and crack propagation interaction effects
was stressed. Intermittent overloads can delay the subsequent growth of cracks at lower
loads. On the other hand, such overloads are capable of generating new cracks, which
can then grow on the lower amplitudes. The overall effect would be to shorten the
effective service life of the member by linking together many individual cracks
generated in this manner. An opposite case is the so called 'coaxing', in which fatigue at
low amplitudes followed by high amplitudes leads to longer, overall lives, even though
such a sequence can produce larger than normal crack growth rates. In this case
nucleation of cracks is suppressed by the coaxing procedure which hardens the surface
layers.


Effect of other Parameters on Crack Propagation Rate

Crack growth rates are affected by temperature, environment, strain rate or frequency,
and material properties.

Raising the temperature usually promotes dislocation and slip processes so that the
plastic blunting mechanism can act more freely, thereby increasing the rate of Stage II
crack growth. Because Stage II crack mechanisms are governed largely by unidirectional
mechanical properties (modulus of elasticity, yield and ultimate strength, strain harden-
ing coefficient), the effect of temperature of these properties can be extrapolated directly
to crack growth rates. However, structural engineering components rarely have to oper-
ate at such elevated temperatures.

Environment has a significant influence on crack growth rate and may affect the mecha-
nism of fracture. The presence of a corrosive environment often will change a ductile
fracture mode into a brittle one. The effect is for environmental attack to increase the


TALAT 2401                                                                  28
rate of crack growth. It is not uncommon for the crack growth rate to increase by a factor
of about 10 in aluminium alloys exposed in humid air compared to the rate in vacuum.
Attention should be given however to the interpretation of laboratory tests on the
environmental effects on fatigue and their extrapolation to service conditions. The
frequency of loading and the severity of the environmental attack cannot be estimated
reliably without prior experimental verification.

The effect of material properties on da/dN is of great importance because such informa-
tion can be used by the engineer to choose crack resistant materials. Such information is
unfortunately not documented in an easily and retrievable and adequate manner. The
research in this field is still going on. It can be stated that Stage I crack growth is more
rapid in wavy slip mode materials like aluminium. The growth rate in Stage II is gover-
ned as already mentioned by the unidirectional properties of the material. Slower rates
are obtained by raising the modulus of elasticity, the ultimate tensile strength, and the
strain hardening rate. The effect of small grain size in reducing crack growth rates is
considerably at low stress amplitudes but negligible at large amplitudes. It should be
mentioned that significant variations in fatigue crack propagation rates may be observed
in the same material obtained from different sources.

Endurance Limit

The endurance limit or fatigue limit, is recognised as a change in the slope of a conven-
tional S-N curve from negative to zero (flat). Aluminium and its alloys does not give S-
N curves with strictly zero slopes at long lives. Nevertheless the curve is nearly flat, and
it is usual to speak of the endurance limit at 107 or 108 cycles. The definite endurance
limit is connected strongly with the existence of a sharp yield point in the tensile stress-
strain curve, as for instance in the case of iron or steel. On the other hand in the case of
aluminium alloys, dislocation locking does not occur - which is associated with the
sharp yield point - so that there is no definite stress below which cracks refuse to grow.


Predictive Theories of Fatigue

When will a given construction or component fail?

The design engineer needs the answer to provide safe design. The operator demands the
answer to provide safe operation. The question can usually be answered through a com-
bination of past experience, experimental inspection and testing, and semi-empirical fa-
tigue theories. While the latter provide only approximate answers, they are especially
important to the design engineer.


TALAT 2401                                29
Damage Accumulation Theories

The first theories of fatigue were aimed at describing the typical constant amplitude S-N
curve. In terms of the accumulation of some vague, undefined damage within the mater-
ial. Failure was assumed to occur with the accumulation of a critical amount of damage.
The parameters which had to be adjusted were the rate of damage accumulation and the
critical amount for failure. A useful extension of this concept was made by Palmgren-
Miner to the case of variable amplitude loading. The criterion for failure under a series
of different load amplitudes is given as

                                              ni
                                         ∑N
                                          i
                                                   =1
                                               i


the linear damage accumulation rule.

Detailed information on the Palmgren-Miner rule and its applicability in practice will be
given in Lecture 2401.04 dealing with load and stress spectra and damage
accumulation. Comparison of the rule with experiment has shown it to err in most cases,
often on the unsafe side. Yet the rule is close enough to reality, so it is being used
frequently as a guide when other more precise information is lacking. That such a
simple concept of damage accumulation works at all lies in the basic nature of fatigue
failure. Whether the basic process is crack generation or crack growth, each proceeds by
a definite increment in each cycle of stress. Crack generation proceeds until a critical
stage is reached such that crack growth can than proceed. The crack propagates until it
reaches a critical length, such that the next load application brings catastrophic failure.
In each case, the term damage can be substituted for crack generation or growth, and the
critical stage of the development can be termed a critical amount of damage
accumulation. Assuming no interaction effects between different load amplitudes leads
directly to the above linear damage accumulation rule.

Manson-Coffin Law

Under conditions of constant plastic strain range ∆εp the numbers of cycles to failure is
found to be (for ∆εp > 0.01)
                                      ∆ε p ⋅ ( N T ) = C
                                                   Z


where C and the exponent z are material constants, z weakly dependent on material and
with a value in the order 0.5 to 0.7 and the constant C related to ductility and the true
tensile fracture strain. This general relationship has been modified to include the total
strain range and is usually referred to as the Manson-Coffin law.

The development of numerical analysis procedures, especially the finite element method
allow a rapid and accurate analysis of local stress and strains at notches or cracks. Rela-
ted to the true strain behaviour of the material under repeated loading - the cyclic stress-
strain curve as compared to the initial monotonic, static stress-strain curve - the possibil-
ity of applying such relationships especially in the area of low-cycle fatigue are outlined
in the following. Some more details on local stress concepts in fatigue will follow in


TALAT 2401                                30
Lecture 2401.05. The overall procedure of analysis and life estimation through the
Manson-Coffin relation is outlined in. Figure 2401.02.10 and Figure 2401.02.11.


                                                                            Hysteresis
                                                                  σ                                  ∆σ          = stress range
                                                                                                     σa          = stress amplitude
                                                                                                     ∆ε          = strain range
                               σa


                                                                                                     ∆εp         = plastic strain range
                                                              arctan E
                                                                                                     ∆εe         = elastic strain range
                         ∆σ


                                                                                                     ∆ε/2 = strain amplitude
                                                          ∆εp                         ε
                                                              2                                         E        = Young's Modulus
                                σa


                                                                                                        Pf
                                                                                                   σf =          = engineering stress
                                                                                                        A0
                                                                                                        Pf
                                                                                                   σf = A        = true stress
                                                               ∆ε0         ∆εe                           f

                                                       ∆ε/2              ∆ε/2                                 A0
                                                                                                   D = ln        = ductility
                                                                                                              Af
                                                                  ∆ε
      Source: D. Kosteas, TUM

                                             alu
                                                                  Fatigue Damage and Influencing Parameters                       2401.02.10
      Training in Aluminium Application Technologies


                                                                      Strain-Life Relationship

          Strain                                                                           ∆ε           σ'f
                                                                                                                 (2Nf ) + ε (2Nf )
                                                                                                                       b          c
                                                       D0.6
          Amplitude                                                                        2            E
          log (∆ε/2)
                                                       σf /E                                                                   Morrow
                                                                                 plastic 1    1
                                                                                           c         b
                                                                                 strain           elastic strain
                                                                                  Cycles to Failure logN f
                                                       D0.6
                                                                                                          σf -0.12
     Strain Range                                                                            ∆ε = 3.5       Nf + D0.6 Nf-0.6
                                                                                                          E
     log ∆ε
                                             3.5 σ /E
                                                  f
                                                                                                                           Manson-
                                                                           plastic                                         Coffin
                                                                           strain        elastic strain
     Source: D. Kosteas, TUM
                                                                                Cycles to Failure logN f

                                            alu

     Training in Aluminium Application Technologies
                                                                                  Strain-Life Relationship                       2401.02.11


When plotted on log-log paper, the relationship becomes a straight line. With the aid of
the cyclic stress-strain relation this plot can be converted to a S-N curve. A useful ex-
pression for the exponent z is given in terms of the cyclic hardening exponent n'


TALAT 2401                                                                            31
1
                                        z=
                                             2n ' + 1

Since n' ≈ 0.15 we get z ≈ 0.75, this value being about 25% larger than measured values.
The detailed dependence of C and z on material constants is not resolved completely. In
our opinion the Manson-Coffin relation and further derivations may be a useful tool for
comparative studies and initiation life estimations for different materials. The
advancement of life estimation methods on the basis of fracture mechanics, especially in
cases where fatigue life is governed mainly by propagation, is nowadays a more
powerful and sophisticated tool in the hands of a knowledgeable design engineer.


Crack Growth Laws

Many empirical crack growth laws have been proposed. The most popular have the form

                                   da/dN = C ⋅ F(a,s)

where C is a constant which depends on the material and F(a,s) is a function determined
empirically from the data. There are two important ingredients which are necessary to
any successful crack growth theory. First, a realistic model for crack growth. Second,
analytical methods for expressing the model in mathematical terms so that a quantitative
relation may be derived. It is worth noting that theoretical crack growth laws are of the
form

                                     da/dN = C ⋅ Km

where C is again a material constant and K is the stress intensity factor depending on the
instantaneous crack length and the overall nominal stress and affected by geometrical
and loading parameters. This is the form found empirically by Paris and others and is
discussed in more detail under Chapter 12 on fracture mechanics and life estimation.

Ideal Cumulative Damage Theory

Ideally one would like to predict the failure of structural components which are subject
to a spectrum of loads in a variable environment. While such a theory is not fully
available the framework for achieving it is fairly clear. Fatigue mechanisms provide the
basic idea, namely that the number of cycles to failure is the sum of the crack initiation
time NI and the crack propagation time NP (see Figure 2401.02.12)

                                     NT = NI + NP

Quantitative expression of NI is a difficult problem, the effect of aggressive
environment on crack initiation time is also largely unknown. However, if NI << Np
then the problem is minimised. This is often the case with structural components
containing substantial notches, for instance welded structures.


TALAT 2401                               32
Loadings
                                                                                                    σm, εm
                                                                                                    ∆σ, ∆ε


                     Material Properties                               Geometry                          Geometry                   Material Properties
                       stress-strain relation                     FE-methods (el.-pl.)                FE-methods (el.-pl.)           crack prop. behavior
                                   hardening                      empirical methods                   empirical methods              % ' behavior
                                                                                                                                         $
                         %                                                                                      crack                       10-1


                                                                                                                                       da/dN
                                   softening                                 $
                                                                             m      &$
                                                                                     el
                                                                                    &$
                                    $                                                pl
                                                                                                                      ∆KI                   10-8
                                                                                                                                                   Kth KIc


                                                Crack Initiation Life                                                Crack Propagation
                                               low cycle fatigue concepts
                                                      ∆ε                                                              da / dN = f ( ∆K )
                                                         = BNb + Cic
                                                             i
                                                       2                                                               Paris, Forman etc.
                                               Manson-Coffin, Morrow etc.


                                               Damage Accumulation                                                 Damage Accumulation
                                                                                                                             ac
                                                     N
                                                   ∑ Ni = 1 ( crack a0                                                NP =   ∫ f (∆K )da
                                                   i  t
                                                                                                                             a0
                                                     Palmgren-Miner


                                                                 Crack Initiation        Ni         Np       Crack Propagation

                                                                                               NT    Component Life
  Source: D. Kosteas, TUM

                                         alu

  Training in Aluminium Application Technologies
                                                               Outline of Fatigue Life Prediction Methods                                                    2401.02.12


Such an approach to cumulative damage and the prediction of fatigue lives requires an
accurate model for the simulation of the service life of the structure as well. Such esti-
mations are performed almost entirely nowadays by computer simulation.


TALAT 2401                                                                                    33
2401.03           Fatigue Data Analysis and Evaluation
              •   Analysis of data
              •   Analysis in the middle-cycle fatigue range
              •   Analysis in the high-cycle fatigue range
              •   Fatigue diagrams
              •   Linear P-S-N curves
              •   Non-linear P-S-N curves
              •   Some problems of data analysis in practice


It is a requirement for fatigue design stresses to be related to some probability of failure.
This is particularly true in the context of structures whose failure could be catastrophic
but it also arises in relation to design rules which are based on limit states. A need for
statistical analysis also arises during an actual design procedure, when further levels of
sophistication beyond the rules of a recommendation have to be established. In such
cases own data or comparisons of data have to be performed on a homogeneous way and
compatible to the procedures of the recommendations themselves. In order to meet such
requirements, fatigue data need to be analysed statistically.

Fatigue data have long been the subject of statistical considerations because of their
inherent scatter. However, in practice, fatigue data, especially for welded joints, are
seldom ideal material for statistical treatment. Either in the case of literature data, which
usually come from several sources, and need to be analysed to provide the basis for
design rules - or in the case of data from special fatigue tests carried out under well
defined and controlled conditions to validate a particular design. Despite the merits of
computerised analysis it must be reminded that the ability to make a qualified, well
weighted decision, based on engineering judgement (whatever this may be more than
experience) is still extremely valuable. We normally encounter three different types of
data:
      •   many results for identical specimens made and tested at the same laboratory
      •   many results for similar specimens, representing more severe stress concentra-
          tions than in the first type, obtained mainly at one laboratory over a period of
          years
      •   many results for similar specimens obtained from many different investigations
          over a period of years.

No simple statistical method is suitable for treating all three types of data. Further more,
the greatest problem is presented by the third type; this is the type of data which need to
be evaluated in the formulation of design rules.


TALAT 2401                                34
Analysis of Data

Fatigue life of a specimen will be expressed in cycles to failure. This is the observed
variable dependent on the investigated property, i.e. fatigue strength. Practically we
perform a test data analysis in order to calculate characteristic values for a statistical
population out of the random sample observation. These are the mean value x and the
variance s2 or the standard deviation s which identify the population and enable further
comparisons.

As a next element we need confidence intervals for the observed data which again
describe the relation of the sample to the whole population. In the case of fatigue test
data we are interested in the calculation of probability of failure or probability of
survival limits.

Through comparative evaluation of test results by means of variance analysis significant
or non-significant deviations may be calculated. Finally the functional relationship be-
tween two variables, here fatigue strength and cycles to failure, has to be established by
using methods of regression analysis.

It is pointed out that statistical and regression methods are included in the operations of
the 'Aluminium Data Bank' installed at the Department Aluminium Structures and
Fatigue of the University of Munich. Details on these procedures are given in Lecture
2403.02.


                                                 Statistical/Regressional Analysis
                                                           for the middle cycle fatigue range

                       Su ,,,                           Ultimate strength
                          ,,!
                          ,!!
                          !!!
                       [MPa]


                                                                                   P-S-N Curve
                                                                                   LogN = m logσ + C

                                      Probability of survival P
                       maxS


                                      at confidence level γ                 ) ) )* ))


                                                                                       )) ))*         )))
                                                                                                            ++++
                       Se                            Endurance limit                                        ,,++
                                                                                                            ,,++
                                                                                                            ,,,+
                                                                                                            ,,,,
                                                                ~104                                   Nc

                                                        LCF                      MCF                           HCF
     Source: D. Kosteas, TUM                                                            Cycles to Failure
                                           alu

    Training in Aluminium Application Technologies
                                                                Statistical / Regressional Analysis                2401.03.01


TALAT 2401                                                                  35
TALAT Lecture 2401: Fatigue Behaviour and Analysis

Contenu connexe

Tendances

Unit 2 theory_of_plasticity
Unit 2 theory_of_plasticityUnit 2 theory_of_plasticity
Unit 2 theory_of_plasticityavinash shinde
 
Constant strain triangular
Constant strain triangular Constant strain triangular
Constant strain triangular rahul183
 
MATERIALS TECHNOLOGY
MATERIALS TECHNOLOGYMATERIALS TECHNOLOGY
MATERIALS TECHNOLOGYpalanivendhan
 
Ch 2-stress-strains and yield criterion
Ch 2-stress-strains and yield criterionCh 2-stress-strains and yield criterion
Ch 2-stress-strains and yield criterionVJTI Production
 
A case study on Fatigue failure analysis.
A case study on Fatigue failure analysis. A case study on Fatigue failure analysis.
A case study on Fatigue failure analysis. AbdulAlMamun4
 
Analysis of Linear Spring system
Analysis of Linear Spring systemAnalysis of Linear Spring system
Analysis of Linear Spring systemCPDLR
 
Fracture toughness measurement testing
Fracture toughness measurement testingFracture toughness measurement testing
Fracture toughness measurement testingkhileshkrbhandari
 
Fatigue of materials
Fatigue of materialsFatigue of materials
Fatigue of materialsBilal
 
Design for fluctuation loads
Design for fluctuation loadsDesign for fluctuation loads
Design for fluctuation loadsFeroz Ahmed
 
12 fatigue of metals
12 fatigue of metals12 fatigue of metals
12 fatigue of metalsRajeev Ranjan
 
Mechanical properties of materials by ombaran singh
Mechanical properties of materials by ombaran singhMechanical properties of materials by ombaran singh
Mechanical properties of materials by ombaran singhrajatomar123
 
Mechanical Joints in LS-Dyna for Explicit Analysis
Mechanical Joints in LS-Dyna for Explicit AnalysisMechanical Joints in LS-Dyna for Explicit Analysis
Mechanical Joints in LS-Dyna for Explicit AnalysisAkshay Mistri
 

Tendances (20)

Unit 2 theory_of_plasticity
Unit 2 theory_of_plasticityUnit 2 theory_of_plasticity
Unit 2 theory_of_plasticity
 
Constant strain triangular
Constant strain triangular Constant strain triangular
Constant strain triangular
 
Creep of metals
Creep of metalsCreep of metals
Creep of metals
 
Mech props
Mech propsMech props
Mech props
 
MATERIALS TECHNOLOGY
MATERIALS TECHNOLOGYMATERIALS TECHNOLOGY
MATERIALS TECHNOLOGY
 
Ch 2-stress-strains and yield criterion
Ch 2-stress-strains and yield criterionCh 2-stress-strains and yield criterion
Ch 2-stress-strains and yield criterion
 
A case study on Fatigue failure analysis.
A case study on Fatigue failure analysis. A case study on Fatigue failure analysis.
A case study on Fatigue failure analysis.
 
Analysis of Linear Spring system
Analysis of Linear Spring systemAnalysis of Linear Spring system
Analysis of Linear Spring system
 
Fracture toughness measurement testing
Fracture toughness measurement testingFracture toughness measurement testing
Fracture toughness measurement testing
 
Fatigue of materials
Fatigue of materialsFatigue of materials
Fatigue of materials
 
Design for fluctuation loads
Design for fluctuation loadsDesign for fluctuation loads
Design for fluctuation loads
 
Fem frame
Fem frameFem frame
Fem frame
 
12 fatigue of metals
12 fatigue of metals12 fatigue of metals
12 fatigue of metals
 
Introduction to FEA
Introduction to FEAIntroduction to FEA
Introduction to FEA
 
Mechanical properties of materials by ombaran singh
Mechanical properties of materials by ombaran singhMechanical properties of materials by ombaran singh
Mechanical properties of materials by ombaran singh
 
Mechanical Joints in LS-Dyna for Explicit Analysis
Mechanical Joints in LS-Dyna for Explicit AnalysisMechanical Joints in LS-Dyna for Explicit Analysis
Mechanical Joints in LS-Dyna for Explicit Analysis
 
Stresses in bolts &amp; nuts
Stresses in bolts &amp; nutsStresses in bolts &amp; nuts
Stresses in bolts &amp; nuts
 
Lecture 11
Lecture 11Lecture 11
Lecture 11
 
Polymer matrix composite
Polymer matrix compositePolymer matrix composite
Polymer matrix composite
 
Fatigue
FatigueFatigue
Fatigue
 

En vedette

TALAT Lecture 2101.01: Understanding aluminium as a material
TALAT Lecture 2101.01: Understanding aluminium as a materialTALAT Lecture 2101.01: Understanding aluminium as a material
TALAT Lecture 2101.01: Understanding aluminium as a materialCORE-Materials
 
TALAT Lecture 1401: Aluminium Powder Metallurgy
TALAT Lecture 1401: Aluminium Powder MetallurgyTALAT Lecture 1401: Aluminium Powder Metallurgy
TALAT Lecture 1401: Aluminium Powder MetallurgyCORE-Materials
 
TALAT Lecture 1601: Process modelling applied to age hardening aluminium alloys
TALAT Lecture 1601: Process modelling applied to age hardening aluminium alloysTALAT Lecture 1601: Process modelling applied to age hardening aluminium alloys
TALAT Lecture 1601: Process modelling applied to age hardening aluminium alloysCORE-Materials
 
TALAT Lecture 1203: Phase Diagrams
TALAT Lecture 1203: Phase DiagramsTALAT Lecture 1203: Phase Diagrams
TALAT Lecture 1203: Phase DiagramsCORE-Materials
 
TALAT Lecture 1302: Aluminium Extrusion: Alloys, Shapes and Properties
TALAT Lecture 1302: Aluminium Extrusion: Alloys, Shapes and PropertiesTALAT Lecture 1302: Aluminium Extrusion: Alloys, Shapes and Properties
TALAT Lecture 1302: Aluminium Extrusion: Alloys, Shapes and PropertiesCORE-Materials
 
TALAT Lecture 1205: Introduction to Mechanical Properties, Casting, Forming, ...
TALAT Lecture 1205: Introduction to Mechanical Properties, Casting, Forming, ...TALAT Lecture 1205: Introduction to Mechanical Properties, Casting, Forming, ...
TALAT Lecture 1205: Introduction to Mechanical Properties, Casting, Forming, ...CORE-Materials
 
TALAT Lecture 2503: Calculation Methods for Fire Design
TALAT Lecture 2503: Calculation Methods for Fire DesignTALAT Lecture 2503: Calculation Methods for Fire Design
TALAT Lecture 2503: Calculation Methods for Fire DesignCORE-Materials
 
TALAT Lecture 3201: Introduction to Casting Technology
TALAT Lecture 3201: Introduction to Casting TechnologyTALAT Lecture 3201: Introduction to Casting Technology
TALAT Lecture 3201: Introduction to Casting TechnologyCORE-Materials
 
TALAT Lecture 3702: Tribology in Cold Forming of Aluminium Sheet
TALAT Lecture 3702: Tribology in Cold Forming of Aluminium SheetTALAT Lecture 3702: Tribology in Cold Forming of Aluminium Sheet
TALAT Lecture 3702: Tribology in Cold Forming of Aluminium SheetCORE-Materials
 
TALAT Lecture 1502: Criteria in Material Selection
TALAT Lecture 1502: Criteria in Material SelectionTALAT Lecture 1502: Criteria in Material Selection
TALAT Lecture 1502: Criteria in Material SelectionCORE-Materials
 
TALAT Lecture 3403: Designing of Forgings
TALAT Lecture 3403: Designing of ForgingsTALAT Lecture 3403: Designing of Forgings
TALAT Lecture 3403: Designing of ForgingsCORE-Materials
 
Testing Techniques for Composite Materials
Testing Techniques for Composite MaterialsTesting Techniques for Composite Materials
Testing Techniques for Composite MaterialsCORE-Materials
 
TALAT Lecture 3704: Deep Drawing
TALAT Lecture 3704: Deep DrawingTALAT Lecture 3704: Deep Drawing
TALAT Lecture 3704: Deep DrawingCORE-Materials
 
TALAT Lecture 2302: Design of Joints
TALAT Lecture 2302: Design of JointsTALAT Lecture 2302: Design of Joints
TALAT Lecture 2302: Design of JointsCORE-Materials
 
TALAT Lecture 3402: Forging Process
TALAT Lecture 3402: Forging ProcessTALAT Lecture 3402: Forging Process
TALAT Lecture 3402: Forging ProcessCORE-Materials
 
Snap Fit Design by Neeraj Kumar Jha
Snap Fit Design by Neeraj Kumar JhaSnap Fit Design by Neeraj Kumar Jha
Snap Fit Design by Neeraj Kumar JhaAnkit Srivastava
 
Disrupting Tech With Diversity and Inclusion
Disrupting Tech With Diversity and Inclusion Disrupting Tech With Diversity and Inclusion
Disrupting Tech With Diversity and Inclusion Wayne Sutton
 
Cyber Tech Israel 2016: Get Your Head in the Cloud
Cyber Tech Israel 2016: Get Your Head in the CloudCyber Tech Israel 2016: Get Your Head in the Cloud
Cyber Tech Israel 2016: Get Your Head in the CloudSymantec
 
TALAT Lecture 5103: Corrosion Control of Aluminium - Forms of Corrosion and P...
TALAT Lecture 5103: Corrosion Control of Aluminium - Forms of Corrosion and P...TALAT Lecture 5103: Corrosion Control of Aluminium - Forms of Corrosion and P...
TALAT Lecture 5103: Corrosion Control of Aluminium - Forms of Corrosion and P...CORE-Materials
 

En vedette (20)

TALAT Lecture 2101.01: Understanding aluminium as a material
TALAT Lecture 2101.01: Understanding aluminium as a materialTALAT Lecture 2101.01: Understanding aluminium as a material
TALAT Lecture 2101.01: Understanding aluminium as a material
 
TALAT Lecture 1401: Aluminium Powder Metallurgy
TALAT Lecture 1401: Aluminium Powder MetallurgyTALAT Lecture 1401: Aluminium Powder Metallurgy
TALAT Lecture 1401: Aluminium Powder Metallurgy
 
TALAT Lecture 1601: Process modelling applied to age hardening aluminium alloys
TALAT Lecture 1601: Process modelling applied to age hardening aluminium alloysTALAT Lecture 1601: Process modelling applied to age hardening aluminium alloys
TALAT Lecture 1601: Process modelling applied to age hardening aluminium alloys
 
TALAT Lecture 1203: Phase Diagrams
TALAT Lecture 1203: Phase DiagramsTALAT Lecture 1203: Phase Diagrams
TALAT Lecture 1203: Phase Diagrams
 
TALAT Lecture 1302: Aluminium Extrusion: Alloys, Shapes and Properties
TALAT Lecture 1302: Aluminium Extrusion: Alloys, Shapes and PropertiesTALAT Lecture 1302: Aluminium Extrusion: Alloys, Shapes and Properties
TALAT Lecture 1302: Aluminium Extrusion: Alloys, Shapes and Properties
 
TALAT Lecture 1205: Introduction to Mechanical Properties, Casting, Forming, ...
TALAT Lecture 1205: Introduction to Mechanical Properties, Casting, Forming, ...TALAT Lecture 1205: Introduction to Mechanical Properties, Casting, Forming, ...
TALAT Lecture 1205: Introduction to Mechanical Properties, Casting, Forming, ...
 
TALAT Lecture 2503: Calculation Methods for Fire Design
TALAT Lecture 2503: Calculation Methods for Fire DesignTALAT Lecture 2503: Calculation Methods for Fire Design
TALAT Lecture 2503: Calculation Methods for Fire Design
 
TALAT Lecture 3201: Introduction to Casting Technology
TALAT Lecture 3201: Introduction to Casting TechnologyTALAT Lecture 3201: Introduction to Casting Technology
TALAT Lecture 3201: Introduction to Casting Technology
 
TALAT Lecture 3702: Tribology in Cold Forming of Aluminium Sheet
TALAT Lecture 3702: Tribology in Cold Forming of Aluminium SheetTALAT Lecture 3702: Tribology in Cold Forming of Aluminium Sheet
TALAT Lecture 3702: Tribology in Cold Forming of Aluminium Sheet
 
TALAT Lecture 1502: Criteria in Material Selection
TALAT Lecture 1502: Criteria in Material SelectionTALAT Lecture 1502: Criteria in Material Selection
TALAT Lecture 1502: Criteria in Material Selection
 
TALAT Lecture 3403: Designing of Forgings
TALAT Lecture 3403: Designing of ForgingsTALAT Lecture 3403: Designing of Forgings
TALAT Lecture 3403: Designing of Forgings
 
Testing Techniques for Composite Materials
Testing Techniques for Composite MaterialsTesting Techniques for Composite Materials
Testing Techniques for Composite Materials
 
TALAT Lecture 3704: Deep Drawing
TALAT Lecture 3704: Deep DrawingTALAT Lecture 3704: Deep Drawing
TALAT Lecture 3704: Deep Drawing
 
TALAT Lecture 2302: Design of Joints
TALAT Lecture 2302: Design of JointsTALAT Lecture 2302: Design of Joints
TALAT Lecture 2302: Design of Joints
 
TALAT Lecture 3402: Forging Process
TALAT Lecture 3402: Forging ProcessTALAT Lecture 3402: Forging Process
TALAT Lecture 3402: Forging Process
 
Snap Fit Design by Neeraj Kumar Jha
Snap Fit Design by Neeraj Kumar JhaSnap Fit Design by Neeraj Kumar Jha
Snap Fit Design by Neeraj Kumar Jha
 
Disrupting Tech With Diversity and Inclusion
Disrupting Tech With Diversity and Inclusion Disrupting Tech With Diversity and Inclusion
Disrupting Tech With Diversity and Inclusion
 
Drawing Processes
Drawing ProcessesDrawing Processes
Drawing Processes
 
Cyber Tech Israel 2016: Get Your Head in the Cloud
Cyber Tech Israel 2016: Get Your Head in the CloudCyber Tech Israel 2016: Get Your Head in the Cloud
Cyber Tech Israel 2016: Get Your Head in the Cloud
 
TALAT Lecture 5103: Corrosion Control of Aluminium - Forms of Corrosion and P...
TALAT Lecture 5103: Corrosion Control of Aluminium - Forms of Corrosion and P...TALAT Lecture 5103: Corrosion Control of Aluminium - Forms of Corrosion and P...
TALAT Lecture 5103: Corrosion Control of Aluminium - Forms of Corrosion and P...
 

Similaire à TALAT Lecture 2401: Fatigue Behaviour and Analysis

Blodgett.et.al. .guide.to.welded.steel.constructions.(1999)
Blodgett.et.al. .guide.to.welded.steel.constructions.(1999)Blodgett.et.al. .guide.to.welded.steel.constructions.(1999)
Blodgett.et.al. .guide.to.welded.steel.constructions.(1999)elmorro
 
The gage block handbook
The gage block handbookThe gage block handbook
The gage block handbookgoyito13
 
[A. hobbacher] fatigue_design_of_welded_joints_and
[A. hobbacher] fatigue_design_of_welded_joints_and[A. hobbacher] fatigue_design_of_welded_joints_and
[A. hobbacher] fatigue_design_of_welded_joints_andIlham Ilham
 
guide to offshore structures design for engineers
guide to offshore structures design for engineersguide to offshore structures design for engineers
guide to offshore structures design for engineersProfSNallayarasu
 
82937107 iiw-recommendations-for-fatigue-design-of-welded-joints-and-componen...
82937107 iiw-recommendations-for-fatigue-design-of-welded-joints-and-componen...82937107 iiw-recommendations-for-fatigue-design-of-welded-joints-and-componen...
82937107 iiw-recommendations-for-fatigue-design-of-welded-joints-and-componen...restinho
 
TALAT Lecture 2301: Design of Members
TALAT Lecture 2301: Design of MembersTALAT Lecture 2301: Design of Members
TALAT Lecture 2301: Design of MembersCORE-Materials
 
Chassis
ChassisChassis
Chassishome
 
Lightning protection guide e
Lightning protection guide eLightning protection guide e
Lightning protection guide efabriziotappi
 
Combined heat and power design guide by ASHRAE
Combined heat and power design guide by ASHRAECombined heat and power design guide by ASHRAE
Combined heat and power design guide by ASHRAEAli Hasimi Pane
 
2004 zuckerberg a set theoretic approach to lifting procedures for 0-1 inte...
2004 zuckerberg   a set theoretic approach to lifting procedures for 0-1 inte...2004 zuckerberg   a set theoretic approach to lifting procedures for 0-1 inte...
2004 zuckerberg a set theoretic approach to lifting procedures for 0-1 inte...Alejandro Angulo
 
ASME-Y14.5-2018-Dimensioning-and-Tolerancing - Copy.doc
ASME-Y14.5-2018-Dimensioning-and-Tolerancing - Copy.docASME-Y14.5-2018-Dimensioning-and-Tolerancing - Copy.doc
ASME-Y14.5-2018-Dimensioning-and-Tolerancing - Copy.docvishwanathvh
 
High Voltage DC Surge Arresters for Railway Industry - Overvoltage Protection...
High Voltage DC Surge Arresters for Railway Industry - Overvoltage Protection...High Voltage DC Surge Arresters for Railway Industry - Overvoltage Protection...
High Voltage DC Surge Arresters for Railway Industry - Overvoltage Protection...Thorne & Derrick International
 
Experimental Investigation of Optimal Aerodynamics of a Flying Wing UAV(Link)
Experimental Investigation of Optimal Aerodynamics of a Flying Wing UAV(Link)Experimental Investigation of Optimal Aerodynamics of a Flying Wing UAV(Link)
Experimental Investigation of Optimal Aerodynamics of a Flying Wing UAV(Link)Baba Kakkar
 

Similaire à TALAT Lecture 2401: Fatigue Behaviour and Analysis (20)

Engineering structural welding
Engineering structural weldingEngineering structural welding
Engineering structural welding
 
Blodgett.et.al. .guide.to.welded.steel.constructions.(1999)
Blodgett.et.al. .guide.to.welded.steel.constructions.(1999)Blodgett.et.al. .guide.to.welded.steel.constructions.(1999)
Blodgett.et.al. .guide.to.welded.steel.constructions.(1999)
 
Offshore structures
Offshore structuresOffshore structures
Offshore structures
 
The gage block handbook
The gage block handbookThe gage block handbook
The gage block handbook
 
[A. hobbacher] fatigue_design_of_welded_joints_and
[A. hobbacher] fatigue_design_of_welded_joints_and[A. hobbacher] fatigue_design_of_welded_joints_and
[A. hobbacher] fatigue_design_of_welded_joints_and
 
ASME B31.4-2022 estandar ductos año 2022
ASME B31.4-2022 estandar ductos año 2022ASME B31.4-2022 estandar ductos año 2022
ASME B31.4-2022 estandar ductos año 2022
 
ASME-B31.4-2019-estandar para diseño de ductos
ASME-B31.4-2019-estandar para diseño de ductosASME-B31.4-2019-estandar para diseño de ductos
ASME-B31.4-2019-estandar para diseño de ductos
 
guide to offshore structures design for engineers
guide to offshore structures design for engineersguide to offshore structures design for engineers
guide to offshore structures design for engineers
 
The complete guide_to_chain
The complete guide_to_chainThe complete guide_to_chain
The complete guide_to_chain
 
82937107 iiw-recommendations-for-fatigue-design-of-welded-joints-and-componen...
82937107 iiw-recommendations-for-fatigue-design-of-welded-joints-and-componen...82937107 iiw-recommendations-for-fatigue-design-of-welded-joints-and-componen...
82937107 iiw-recommendations-for-fatigue-design-of-welded-joints-and-componen...
 
Tilak's Report
Tilak's ReportTilak's Report
Tilak's Report
 
TALAT Lecture 2301: Design of Members
TALAT Lecture 2301: Design of MembersTALAT Lecture 2301: Design of Members
TALAT Lecture 2301: Design of Members
 
Chassis
ChassisChassis
Chassis
 
Lightning protection guide e
Lightning protection guide eLightning protection guide e
Lightning protection guide e
 
Combined heat and power design guide by ASHRAE
Combined heat and power design guide by ASHRAECombined heat and power design guide by ASHRAE
Combined heat and power design guide by ASHRAE
 
Asmeb30.2 2001
Asmeb30.2 2001Asmeb30.2 2001
Asmeb30.2 2001
 
2004 zuckerberg a set theoretic approach to lifting procedures for 0-1 inte...
2004 zuckerberg   a set theoretic approach to lifting procedures for 0-1 inte...2004 zuckerberg   a set theoretic approach to lifting procedures for 0-1 inte...
2004 zuckerberg a set theoretic approach to lifting procedures for 0-1 inte...
 
ASME-Y14.5-2018-Dimensioning-and-Tolerancing - Copy.doc
ASME-Y14.5-2018-Dimensioning-and-Tolerancing - Copy.docASME-Y14.5-2018-Dimensioning-and-Tolerancing - Copy.doc
ASME-Y14.5-2018-Dimensioning-and-Tolerancing - Copy.doc
 
High Voltage DC Surge Arresters for Railway Industry - Overvoltage Protection...
High Voltage DC Surge Arresters for Railway Industry - Overvoltage Protection...High Voltage DC Surge Arresters for Railway Industry - Overvoltage Protection...
High Voltage DC Surge Arresters for Railway Industry - Overvoltage Protection...
 
Experimental Investigation of Optimal Aerodynamics of a Flying Wing UAV(Link)
Experimental Investigation of Optimal Aerodynamics of a Flying Wing UAV(Link)Experimental Investigation of Optimal Aerodynamics of a Flying Wing UAV(Link)
Experimental Investigation of Optimal Aerodynamics of a Flying Wing UAV(Link)
 

Plus de CORE-Materials

Composite Forming Techniques
Composite Forming TechniquesComposite Forming Techniques
Composite Forming TechniquesCORE-Materials
 
The role of technology in sporting performance
The role of technology in sporting performanceThe role of technology in sporting performance
The role of technology in sporting performanceCORE-Materials
 
Chemical analysis in the electron microscope
Chemical analysis in the electron microscopeChemical analysis in the electron microscope
Chemical analysis in the electron microscopeCORE-Materials
 
The scanning electron microscope
The scanning electron microscopeThe scanning electron microscope
The scanning electron microscopeCORE-Materials
 
The transmission electron microscope
The transmission electron microscopeThe transmission electron microscope
The transmission electron microscopeCORE-Materials
 
Electrons and their interaction with the specimen
Electrons and their interaction with the specimenElectrons and their interaction with the specimen
Electrons and their interaction with the specimenCORE-Materials
 
Electron microscopy and other techniques
Electron microscopy and other techniquesElectron microscopy and other techniques
Electron microscopy and other techniquesCORE-Materials
 
Microscopy with light and electrons
Microscopy with light and electronsMicroscopy with light and electrons
Microscopy with light and electronsCORE-Materials
 
TALAT Lecture 5301: The Surface Treatment and Coil Coating of Aluminium
TALAT Lecture 5301: The Surface Treatment and Coil Coating of AluminiumTALAT Lecture 5301: The Surface Treatment and Coil Coating of Aluminium
TALAT Lecture 5301: The Surface Treatment and Coil Coating of AluminiumCORE-Materials
 
TALAT Lecture 5205: Plating on Aluminium
TALAT Lecture 5205: Plating on AluminiumTALAT Lecture 5205: Plating on Aluminium
TALAT Lecture 5205: Plating on AluminiumCORE-Materials
 
TALAT Lecture 5203: Anodizing of Aluminium
TALAT Lecture 5203: Anodizing of AluminiumTALAT Lecture 5203: Anodizing of Aluminium
TALAT Lecture 5203: Anodizing of AluminiumCORE-Materials
 
TALAT Lecture 5202: Conversion Coatings
TALAT Lecture 5202: Conversion CoatingsTALAT Lecture 5202: Conversion Coatings
TALAT Lecture 5202: Conversion CoatingsCORE-Materials
 
TALAT Lecture 5105: Surface Treatment of Aluminium
TALAT Lecture 5105: Surface Treatment of AluminiumTALAT Lecture 5105: Surface Treatment of Aluminium
TALAT Lecture 5105: Surface Treatment of AluminiumCORE-Materials
 
TALAT Lecture 5104: Basic Approaches to Prevent Corrosion of Aluminium
TALAT Lecture 5104: Basic Approaches to Prevent Corrosion of AluminiumTALAT Lecture 5104: Basic Approaches to Prevent Corrosion of Aluminium
TALAT Lecture 5104: Basic Approaches to Prevent Corrosion of AluminiumCORE-Materials
 
TALAT Lecture 5102: Reactivity of the Aluminium Surface in Aqueous Solutions
TALAT Lecture 5102: Reactivity of the Aluminium Surface in Aqueous SolutionsTALAT Lecture 5102: Reactivity of the Aluminium Surface in Aqueous Solutions
TALAT Lecture 5102: Reactivity of the Aluminium Surface in Aqueous SolutionsCORE-Materials
 
TALAT Lecture 5101: Surface Characteristics of Aluminium and Aluminium Alloys
TALAT Lecture 5101: Surface Characteristics of Aluminium and Aluminium AlloysTALAT Lecture 5101: Surface Characteristics of Aluminium and Aluminium Alloys
TALAT Lecture 5101: Surface Characteristics of Aluminium and Aluminium AlloysCORE-Materials
 
TALAT Lecture 4705: Quality Assurance
TALAT Lecture 4705: Quality AssuranceTALAT Lecture 4705: Quality Assurance
TALAT Lecture 4705: Quality AssuranceCORE-Materials
 
TALAT Lecture 4704: Surface Preparation and Application Procedures
TALAT Lecture 4704: Surface Preparation and Application ProceduresTALAT Lecture 4704: Surface Preparation and Application Procedures
TALAT Lecture 4704: Surface Preparation and Application ProceduresCORE-Materials
 

Plus de CORE-Materials (20)

Composite Forming Techniques
Composite Forming TechniquesComposite Forming Techniques
Composite Forming Techniques
 
The role of technology in sporting performance
The role of technology in sporting performanceThe role of technology in sporting performance
The role of technology in sporting performance
 
Chemical analysis in the electron microscope
Chemical analysis in the electron microscopeChemical analysis in the electron microscope
Chemical analysis in the electron microscope
 
The scanning electron microscope
The scanning electron microscopeThe scanning electron microscope
The scanning electron microscope
 
The transmission electron microscope
The transmission electron microscopeThe transmission electron microscope
The transmission electron microscope
 
Electron diffraction
Electron diffractionElectron diffraction
Electron diffraction
 
Electrons and their interaction with the specimen
Electrons and their interaction with the specimenElectrons and their interaction with the specimen
Electrons and their interaction with the specimen
 
Electron microscopy and other techniques
Electron microscopy and other techniquesElectron microscopy and other techniques
Electron microscopy and other techniques
 
Microscopy with light and electrons
Microscopy with light and electronsMicroscopy with light and electrons
Microscopy with light and electrons
 
Durability of Materials
Durability of MaterialsDurability of Materials
Durability of Materials
 
TALAT Lecture 5301: The Surface Treatment and Coil Coating of Aluminium
TALAT Lecture 5301: The Surface Treatment and Coil Coating of AluminiumTALAT Lecture 5301: The Surface Treatment and Coil Coating of Aluminium
TALAT Lecture 5301: The Surface Treatment and Coil Coating of Aluminium
 
TALAT Lecture 5205: Plating on Aluminium
TALAT Lecture 5205: Plating on AluminiumTALAT Lecture 5205: Plating on Aluminium
TALAT Lecture 5205: Plating on Aluminium
 
TALAT Lecture 5203: Anodizing of Aluminium
TALAT Lecture 5203: Anodizing of AluminiumTALAT Lecture 5203: Anodizing of Aluminium
TALAT Lecture 5203: Anodizing of Aluminium
 
TALAT Lecture 5202: Conversion Coatings
TALAT Lecture 5202: Conversion CoatingsTALAT Lecture 5202: Conversion Coatings
TALAT Lecture 5202: Conversion Coatings
 
TALAT Lecture 5105: Surface Treatment of Aluminium
TALAT Lecture 5105: Surface Treatment of AluminiumTALAT Lecture 5105: Surface Treatment of Aluminium
TALAT Lecture 5105: Surface Treatment of Aluminium
 
TALAT Lecture 5104: Basic Approaches to Prevent Corrosion of Aluminium
TALAT Lecture 5104: Basic Approaches to Prevent Corrosion of AluminiumTALAT Lecture 5104: Basic Approaches to Prevent Corrosion of Aluminium
TALAT Lecture 5104: Basic Approaches to Prevent Corrosion of Aluminium
 
TALAT Lecture 5102: Reactivity of the Aluminium Surface in Aqueous Solutions
TALAT Lecture 5102: Reactivity of the Aluminium Surface in Aqueous SolutionsTALAT Lecture 5102: Reactivity of the Aluminium Surface in Aqueous Solutions
TALAT Lecture 5102: Reactivity of the Aluminium Surface in Aqueous Solutions
 
TALAT Lecture 5101: Surface Characteristics of Aluminium and Aluminium Alloys
TALAT Lecture 5101: Surface Characteristics of Aluminium and Aluminium AlloysTALAT Lecture 5101: Surface Characteristics of Aluminium and Aluminium Alloys
TALAT Lecture 5101: Surface Characteristics of Aluminium and Aluminium Alloys
 
TALAT Lecture 4705: Quality Assurance
TALAT Lecture 4705: Quality AssuranceTALAT Lecture 4705: Quality Assurance
TALAT Lecture 4705: Quality Assurance
 
TALAT Lecture 4704: Surface Preparation and Application Procedures
TALAT Lecture 4704: Surface Preparation and Application ProceduresTALAT Lecture 4704: Surface Preparation and Application Procedures
TALAT Lecture 4704: Surface Preparation and Application Procedures
 

Dernier

Visit to a blind student's school🧑‍🦯🧑‍🦯(community medicine)
Visit to a blind student's school🧑‍🦯🧑‍🦯(community medicine)Visit to a blind student's school🧑‍🦯🧑‍🦯(community medicine)
Visit to a blind student's school🧑‍🦯🧑‍🦯(community medicine)lakshayb543
 
How to do quick user assign in kanban in Odoo 17 ERP
How to do quick user assign in kanban in Odoo 17 ERPHow to do quick user assign in kanban in Odoo 17 ERP
How to do quick user assign in kanban in Odoo 17 ERPCeline George
 
GRADE 4 - SUMMATIVE TEST QUARTER 4 ALL SUBJECTS
GRADE 4 - SUMMATIVE TEST QUARTER 4 ALL SUBJECTSGRADE 4 - SUMMATIVE TEST QUARTER 4 ALL SUBJECTS
GRADE 4 - SUMMATIVE TEST QUARTER 4 ALL SUBJECTSJoshuaGantuangco2
 
HỌC TỐT TIẾNG ANH 11 THEO CHƯƠNG TRÌNH GLOBAL SUCCESS ĐÁP ÁN CHI TIẾT - CẢ NĂ...
HỌC TỐT TIẾNG ANH 11 THEO CHƯƠNG TRÌNH GLOBAL SUCCESS ĐÁP ÁN CHI TIẾT - CẢ NĂ...HỌC TỐT TIẾNG ANH 11 THEO CHƯƠNG TRÌNH GLOBAL SUCCESS ĐÁP ÁN CHI TIẾT - CẢ NĂ...
HỌC TỐT TIẾNG ANH 11 THEO CHƯƠNG TRÌNH GLOBAL SUCCESS ĐÁP ÁN CHI TIẾT - CẢ NĂ...Nguyen Thanh Tu Collection
 
Choosing the Right CBSE School A Comprehensive Guide for Parents
Choosing the Right CBSE School A Comprehensive Guide for ParentsChoosing the Right CBSE School A Comprehensive Guide for Parents
Choosing the Right CBSE School A Comprehensive Guide for Parentsnavabharathschool99
 
Proudly South Africa powerpoint Thorisha.pptx
Proudly South Africa powerpoint Thorisha.pptxProudly South Africa powerpoint Thorisha.pptx
Proudly South Africa powerpoint Thorisha.pptxthorishapillay1
 
Grade 9 Q4-MELC1-Active and Passive Voice.pptx
Grade 9 Q4-MELC1-Active and Passive Voice.pptxGrade 9 Q4-MELC1-Active and Passive Voice.pptx
Grade 9 Q4-MELC1-Active and Passive Voice.pptxChelloAnnAsuncion2
 
Influencing policy (training slides from Fast Track Impact)
Influencing policy (training slides from Fast Track Impact)Influencing policy (training slides from Fast Track Impact)
Influencing policy (training slides from Fast Track Impact)Mark Reed
 
ANG SEKTOR NG agrikultura.pptx QUARTER 4
ANG SEKTOR NG agrikultura.pptx QUARTER 4ANG SEKTOR NG agrikultura.pptx QUARTER 4
ANG SEKTOR NG agrikultura.pptx QUARTER 4MiaBumagat1
 
call girls in Kamla Market (DELHI) 🔝 >༒9953330565🔝 genuine Escort Service 🔝✔️✔️
call girls in Kamla Market (DELHI) 🔝 >༒9953330565🔝 genuine Escort Service 🔝✔️✔️call girls in Kamla Market (DELHI) 🔝 >༒9953330565🔝 genuine Escort Service 🔝✔️✔️
call girls in Kamla Market (DELHI) 🔝 >༒9953330565🔝 genuine Escort Service 🔝✔️✔️9953056974 Low Rate Call Girls In Saket, Delhi NCR
 
Computed Fields and api Depends in the Odoo 17
Computed Fields and api Depends in the Odoo 17Computed Fields and api Depends in the Odoo 17
Computed Fields and api Depends in the Odoo 17Celine George
 
AMERICAN LANGUAGE HUB_Level2_Student'sBook_Answerkey.pdf
AMERICAN LANGUAGE HUB_Level2_Student'sBook_Answerkey.pdfAMERICAN LANGUAGE HUB_Level2_Student'sBook_Answerkey.pdf
AMERICAN LANGUAGE HUB_Level2_Student'sBook_Answerkey.pdfphamnguyenenglishnb
 
Field Attribute Index Feature in Odoo 17
Field Attribute Index Feature in Odoo 17Field Attribute Index Feature in Odoo 17
Field Attribute Index Feature in Odoo 17Celine George
 
Full Stack Web Development Course for Beginners
Full Stack Web Development Course  for BeginnersFull Stack Web Development Course  for Beginners
Full Stack Web Development Course for BeginnersSabitha Banu
 
Barangay Council for the Protection of Children (BCPC) Orientation.pptx
Barangay Council for the Protection of Children (BCPC) Orientation.pptxBarangay Council for the Protection of Children (BCPC) Orientation.pptx
Barangay Council for the Protection of Children (BCPC) Orientation.pptxCarlos105
 
ECONOMIC CONTEXT - LONG FORM TV DRAMA - PPT
ECONOMIC CONTEXT - LONG FORM TV DRAMA - PPTECONOMIC CONTEXT - LONG FORM TV DRAMA - PPT
ECONOMIC CONTEXT - LONG FORM TV DRAMA - PPTiammrhaywood
 
What is Model Inheritance in Odoo 17 ERP
What is Model Inheritance in Odoo 17 ERPWhat is Model Inheritance in Odoo 17 ERP
What is Model Inheritance in Odoo 17 ERPCeline George
 

Dernier (20)

Visit to a blind student's school🧑‍🦯🧑‍🦯(community medicine)
Visit to a blind student's school🧑‍🦯🧑‍🦯(community medicine)Visit to a blind student's school🧑‍🦯🧑‍🦯(community medicine)
Visit to a blind student's school🧑‍🦯🧑‍🦯(community medicine)
 
How to do quick user assign in kanban in Odoo 17 ERP
How to do quick user assign in kanban in Odoo 17 ERPHow to do quick user assign in kanban in Odoo 17 ERP
How to do quick user assign in kanban in Odoo 17 ERP
 
GRADE 4 - SUMMATIVE TEST QUARTER 4 ALL SUBJECTS
GRADE 4 - SUMMATIVE TEST QUARTER 4 ALL SUBJECTSGRADE 4 - SUMMATIVE TEST QUARTER 4 ALL SUBJECTS
GRADE 4 - SUMMATIVE TEST QUARTER 4 ALL SUBJECTS
 
HỌC TỐT TIẾNG ANH 11 THEO CHƯƠNG TRÌNH GLOBAL SUCCESS ĐÁP ÁN CHI TIẾT - CẢ NĂ...
HỌC TỐT TIẾNG ANH 11 THEO CHƯƠNG TRÌNH GLOBAL SUCCESS ĐÁP ÁN CHI TIẾT - CẢ NĂ...HỌC TỐT TIẾNG ANH 11 THEO CHƯƠNG TRÌNH GLOBAL SUCCESS ĐÁP ÁN CHI TIẾT - CẢ NĂ...
HỌC TỐT TIẾNG ANH 11 THEO CHƯƠNG TRÌNH GLOBAL SUCCESS ĐÁP ÁN CHI TIẾT - CẢ NĂ...
 
Choosing the Right CBSE School A Comprehensive Guide for Parents
Choosing the Right CBSE School A Comprehensive Guide for ParentsChoosing the Right CBSE School A Comprehensive Guide for Parents
Choosing the Right CBSE School A Comprehensive Guide for Parents
 
Proudly South Africa powerpoint Thorisha.pptx
Proudly South Africa powerpoint Thorisha.pptxProudly South Africa powerpoint Thorisha.pptx
Proudly South Africa powerpoint Thorisha.pptx
 
Grade 9 Q4-MELC1-Active and Passive Voice.pptx
Grade 9 Q4-MELC1-Active and Passive Voice.pptxGrade 9 Q4-MELC1-Active and Passive Voice.pptx
Grade 9 Q4-MELC1-Active and Passive Voice.pptx
 
Influencing policy (training slides from Fast Track Impact)
Influencing policy (training slides from Fast Track Impact)Influencing policy (training slides from Fast Track Impact)
Influencing policy (training slides from Fast Track Impact)
 
ANG SEKTOR NG agrikultura.pptx QUARTER 4
ANG SEKTOR NG agrikultura.pptx QUARTER 4ANG SEKTOR NG agrikultura.pptx QUARTER 4
ANG SEKTOR NG agrikultura.pptx QUARTER 4
 
call girls in Kamla Market (DELHI) 🔝 >༒9953330565🔝 genuine Escort Service 🔝✔️✔️
call girls in Kamla Market (DELHI) 🔝 >༒9953330565🔝 genuine Escort Service 🔝✔️✔️call girls in Kamla Market (DELHI) 🔝 >༒9953330565🔝 genuine Escort Service 🔝✔️✔️
call girls in Kamla Market (DELHI) 🔝 >༒9953330565🔝 genuine Escort Service 🔝✔️✔️
 
Computed Fields and api Depends in the Odoo 17
Computed Fields and api Depends in the Odoo 17Computed Fields and api Depends in the Odoo 17
Computed Fields and api Depends in the Odoo 17
 
AMERICAN LANGUAGE HUB_Level2_Student'sBook_Answerkey.pdf
AMERICAN LANGUAGE HUB_Level2_Student'sBook_Answerkey.pdfAMERICAN LANGUAGE HUB_Level2_Student'sBook_Answerkey.pdf
AMERICAN LANGUAGE HUB_Level2_Student'sBook_Answerkey.pdf
 
TataKelola dan KamSiber Kecerdasan Buatan v022.pdf
TataKelola dan KamSiber Kecerdasan Buatan v022.pdfTataKelola dan KamSiber Kecerdasan Buatan v022.pdf
TataKelola dan KamSiber Kecerdasan Buatan v022.pdf
 
Field Attribute Index Feature in Odoo 17
Field Attribute Index Feature in Odoo 17Field Attribute Index Feature in Odoo 17
Field Attribute Index Feature in Odoo 17
 
YOUVE_GOT_EMAIL_PRELIMS_EL_DORADO_2024.pptx
YOUVE_GOT_EMAIL_PRELIMS_EL_DORADO_2024.pptxYOUVE_GOT_EMAIL_PRELIMS_EL_DORADO_2024.pptx
YOUVE_GOT_EMAIL_PRELIMS_EL_DORADO_2024.pptx
 
Full Stack Web Development Course for Beginners
Full Stack Web Development Course  for BeginnersFull Stack Web Development Course  for Beginners
Full Stack Web Development Course for Beginners
 
Raw materials used in Herbal Cosmetics.pptx
Raw materials used in Herbal Cosmetics.pptxRaw materials used in Herbal Cosmetics.pptx
Raw materials used in Herbal Cosmetics.pptx
 
Barangay Council for the Protection of Children (BCPC) Orientation.pptx
Barangay Council for the Protection of Children (BCPC) Orientation.pptxBarangay Council for the Protection of Children (BCPC) Orientation.pptx
Barangay Council for the Protection of Children (BCPC) Orientation.pptx
 
ECONOMIC CONTEXT - LONG FORM TV DRAMA - PPT
ECONOMIC CONTEXT - LONG FORM TV DRAMA - PPTECONOMIC CONTEXT - LONG FORM TV DRAMA - PPT
ECONOMIC CONTEXT - LONG FORM TV DRAMA - PPT
 
What is Model Inheritance in Odoo 17 ERP
What is Model Inheritance in Odoo 17 ERPWhat is Model Inheritance in Odoo 17 ERP
What is Model Inheritance in Odoo 17 ERP
 

TALAT Lecture 2401: Fatigue Behaviour and Analysis

  • 1. TALAT Lecture 2401 Fatigue Behaviour and Analysis 81 pages, 56 figures Advanced Level prepared by Dimitris Kosteas, Technische Universität München Objectives: − To understand why, when and where fatigue problems may arise and the special significance to aluminium as structural material − To understand the effects of material and loading parameters on fatigue − To appreciate the statistical nature of fatigue and its importance in data analysis, evaluation and use − To estimate fatigue life under service conditions of time-dependent, variable amplitude loading − To estimate stresses acting in notches and welds with conceptual approaches other than nominal stress − To provide qualitative and quantitative information on the classification of welded details and allow for more sophisticated design procedures Prerequisites: − Background in materials engineering, design and fatigue Date of Issue: 1994  EAA - Euro p ean Aluminium Asso ciatio n
  • 2. 2401 Fatigue Behaviour and Analysis Table of Contents 2401.01 Introduction............................................................................................... 4 Significance of the Fatigue Problem and its Influence on Design ...........................4 Significance of Fatigue for Aluminium Structures ..................................................5 Potential Sites for Fatigue Cracks............................................................................5 Conditions for Susceptibility ...................................................................................6 Definitions ...............................................................................................................9 Symbols..................................................................................................................16 2401.02 Fatigue Damage and Influencing Parameters ...................................... 17 Response of Material to Cyclic Loading................................................................18 Generation of Fatigue Cracks ................................................................................20 Fatigue Crack Growth............................................................................................23 Crack Growth Mechanisms....................................................................................26 Effect of other Parameters on Crack Propagation Rate .........................................28 Endurance Limit.....................................................................................................29 Predictive Theories of Fatigue ...............................................................................29 Damage Accumulation Theories............................................................................30 Manson-Coffin Law...............................................................................................30 Crack Growth Laws ...............................................................................................32 Ideal Cumulative Damage Theory .........................................................................32 2401.03 Fatigue Data Analysis and Evaluation.................................................. 34 Analysis of Data.....................................................................................................35 Analysis in the Middle-Cycle Fatigue Range ........................................................36 Analysis in the High-Cycle Fatigue Range ............................................................38 Fatigue Diagrams ...................................................................................................39 Linear P-S-N Curves..............................................................................................41 Non-Linear P-S-N Curves......................................................................................42 Some Problems of Data Analysis in Practice.........................................................43 TALAT 2401 2
  • 3. 2401.04 Load Spectra and Damage Accumulation ............................................ 46 Service Behaviour..................................................................................................46 Time Dependent Loads ..........................................................................................47 Spectrum Definition and Cycle Counting..............................................................47 The Rain-Flow Cycle Counting Method................................................................50 The Service Behaviour Fatigue Test ......................................................................51 Analytical Life Estimation and Damage Accumulation ........................................54 The Palmgren-Miner Linear Damage Accumulation Hypothesis..........................55 Service Behaviour Assessment ..............................................................................58 Literature................................................................................................................60 2401.05 Local Stress Concepts and Fatigue........................................................ 61 Analytical Relationship between Strain and Fatigue Life......................................61 Notch Theory Concept ...........................................................................................62 The Strain-Life Diagram ........................................................................................63 References..............................................................................................................65 Remarks .................................................................................................................65 2401.06 Effects of Weld Imperfections on Fatigue ............................................ 66 Types of Imperfections ..........................................................................................67 Influence of Imperfections on Static Strength .......................................................69 Influence of Imperfections on Fatigue Strength.....................................................71 Cracks ............................................................................................................... 72 Porosity............................................................................................................. 72 Inclusions, Oxides ............................................................................................. 74 Lack of Penetration - Lack of Fusion ............................................................... 74 Weld Shape........................................................................................................ 76 Geometric Misalignment................................................................................... 76 Arc Strike, Spatter............................................................................................. 77 Post-Weld Mechanical Imperfections ............................................................... 77 2401.07 Literature/References ............................................................................... 79 2401.08 List of Figures............................................................................................ 80 TALAT 2401 3
  • 4. 2401.01 Introduction • Significance of the fatigue problem and its influence on design • Significance of fatigue for aluminium structures • Potential sites for fatigue cracks • Conditions for susceptibility • Definitions • Symbols Significance of the Fatigue Problem and its Influence on Design Structures subjected to fluctuating service loads in sufficient numbers are liable to fail by fatigue. Although the number of structures that have failed by fatigue under service conditions is low the consequences can be costly in terms of human life and/or property damage. Consequences may be catastrophic especially when no appropriate inspection intervals are observed and fatigue damage can grow and accumulate during service life. Today's understanding of fatigue mechanisms, the experimental data available, in many cases the manufacturing process of constructional components, and the analytical methods applied offer a high degree of sophistication in the design procedures. However, currently the most important task is educational. It must be granted that all aspects of the fatigue problem and of fracture control are not yet universally available during engineering education. The following chapters try to give an overall outline of mechanisms, influencing parameters, analytical methods, and suggestions for better design. Beyond this the engineer must deal with actual problems. Experience is the best teacher, and so calculation examples have been added to the theoretical information. For structures under fatigue loads the degree of compliance with the static limit state criteria given in other sections of these design rules may not serve as any useful guide to the risk of fatigue failure. It is necessary therefore to establish as early as possible the extent to which fatigue is likely to control the design. In doing this the following factors are important. a) an accurate prediction of the complete loading sequence throughout the design life should be available. b) the elastic response of the structure under these loads should be accurately assessed c) detail design, methods of manufacture and degree of quality control can have a major influence on fatigue strength, and should be defined more precisely than for statically controlled members. This can have a significant influence on design and construction cost. TALAT 2401 4
  • 5. Significance of Fatigue for Aluminium Structures Aluminium due to its physical and mechanical properties often finds application in areas where the ratio of dead weight of the structure to the total weight is significantly lower than in structures with steel or concrete. This implies that structural applications will be governed by a different ratio of minimum to maximum stresses. Such applications may also be frequently found in areas of severe environmental exposure. Because of applications in transportation area there is also a pressure on the design engineer to choose a light-weight, but then damage-prone, structure. A great deal can be accomplished in terms of complementary methods of analysis utilising recent developments in fracture mechanics and respective data for aluminium alloys and joints in aluminium structures. It is only but recently that such methods and data have been systematically documented and are now been made available to practical design. It should be kept in mind that rules and design values stated for steel structures cannot in every case be assumed for or adapted to respective problems in aluminium. Potential Sites for Fatigue Cracks Most common initiation sites for fatigue cracks are as follows: a) toes and roots of fusion welds b) machined corners and drilled holes c) surfaces under high contact pressure (fretting) d) roots of fastener threads In a typical structural component designed statically the fatigue assessment will not normally present a more severe demand to be fulfilled. Only in cases of respective applications with frequent and significant load variations fatigue will be the governing criterion. In a comparative study (Kosteas/Ondra: "Abgrenzung der Festigkeitsnachweise im Leichtmetallbau. Research report 235/91, Munich 01.10.1992) for an aluminium column for which both a static and a fatigue assessment were performed, it can be demonstrated that the static limit state assessment (ultimate limit state, flexural/torsional buckling, local buckling, deflection) limits the applicability range of the fatigue design S-N curves to approx. above 105 cycles. An extrapolation of design S-N curves down to 104 will rarely have any practical meaning. Bearing in mind that with a variation or enhancement of the geometrical dimensions of the calculated case the relative static limit state assessments will have a more pronounced influence, the applicability range of fatigue design moves to even higher cycle numbers. TALAT 2401 5
  • 6. Conditions for Susceptibility The main conditions affecting fatigue performance are as follows: a) high ratio of dynamic to static load. Moving or lifting structures, such as land or sea transport vehicles, cranes, etc. are more likely to be prone to fatigue problems than fixed structures unless the latter are predominately carrying moving loads as in the case of bridges. b) frequent applications of load. This results in a high number of cycles in the design life. Slender structures or members with low natural frequencies are particularly prone to resonance and enhance magnification of dynamic stress, even though the static design stresses are low. Structures subjected predominantly to fluid loading, such as wind and structures supporting machinery, should be carefully checked for resonance effects. c) use of welding. Some commonly used welded details have low fatigue strength. This applies not only to joints between members, but also to any attachment to a loaded member, whether or not the resulting connection is considered to be 'structural'. d) complexity of joint detail. Complex joints frequently result in high stress concen- trations due to local variations in stiffness of the load path. While these may have little effect on the ultimate static capacity of the joint, they can have a severe effect on fatigue resistance. If fatigue is dominant, the member cross-sectional shape should be selected to ensure smoothness and simplicity of joint design, so that stresses can be calculated and adequate standards of fabrication and inspection can be assured. e) environment. In certain thermal and chemical environments fatigue strength may be reduced. Figure 2401.01.01 Fatigue - Where? Fatigue - Where? bridges highway-sign-bridges parts of buildings cranes, machinery off-shore components components of land or sea vehicles Source: D. Kosteas, TUM alu Fatigue - Where? 2401.01.01 Training in Aluminium Application Technologies TALAT 2401 6
  • 7. Figure 2401.01.02 Fatigue - Location Frequent Fatigue Location Sites Toes and roots of fusion welds Surfaces under high contact pressure Fastener threads Machined corners and drilled holes Source: D. Kosteas, TUM alu Fatigue - Location 2401.01.02 Training in Aluminium Application Technologies Figure 2401.01.03 Fatigue - When and What? Fatigue - When and What? When: subjected to fluctuating service loads in sufficient numbers What: cracks initiate + propagate to final failure consequences are costly in terms of human life and property damage Source: D. Kosteas, TUM alu Fatigue - When and What? 2401.01.03 Training in Aluminium Application Technologies TALAT 2401 7
  • 8. Figure 2401.01.04 Fatigue - The Remedy Fatigue - The Remedy # educate for good design + fracture control # predict service load history, assess damage Bear in mind: ! design, ! manufacturing and ! degree of quality control have major influence on fatigue strength, and influence ! design and construction costs significantly Source: D. Kosteas, TUM alu Fatigue - The Remedy 2401.01.04 Training in Aluminium Application Technologies Figure 2401.01.05 Fatigue - Significance for Aluminium Fatigue - Significance for Al Due to its physical and mechanical properties (low specific weight, low modulus of elasticity, corrosion resistance) aluminium is found frequently in applications with: ! ratio σmin/σmax different from steel or concrete ! severe environmental exposure ! light-weight transportation, # damage-prone Source: D. Kosteas, TUM alu Fatigue - Significance for Al 2401.01.05 Training in Aluminium Application Technologies TALAT 2401 8
  • 9. Definitions Block a specified number of constant amplitude loading cy- cles applied consecutively, or a spectrum loading se- quence of finite length that is repeated identically Confidence Interval an interval estimate of a population parameter com- puted so that the statement 'the population parameter included in this interval will be true, on the average, in a stated portion of the times such computations are made based on different samples from the population. Confidence Level the stated proportion of the times the confidence in- terval is expected to include the population parameter Confidence Limits the two statistics that define a confidence interval Constant Amplitude Loading a loading in which all of the peak loads are equal and all of the valley loads are equal Constant Life Diagram a plot (usually on rectangular co-ordinates) of a family of curves each of which is for a single fatigue life, N, relating stress amplitude ∆σ, to mean stress σm or maximum stress σmax, or to minimum stress, σmin. Corrosion Fatigue synergistic effect of fatigue and aggressive environ- ment acting simultaneously, which leads to a degra- dation in fatigue behaviour. Counting Method a method of counting the occurrences and defining the magnitude of various loading parameters from a load-time history; (some of the counting methods are: level crossing count, peak count, mean crossing peak count, range count, range-pair count, rain-flow count, race-track count). Crack Size a a lineal measure of a principal planar dimension of a crack, commonly used in the calculation of quantities descriptive of the stress and displacement fields, and often also termed 'crack length'. Cut-Off Limit the fatigue strength at 1*108 cycles corresponding to the S-N curve. All stresses below this limit may be ignored TALAT 2401 9
  • 10. Cycle one complete sequence of values of load that is repeated under constant amplitude loading. The symbol n or N is used to indicate the number of cycles (see definition of fatigue life). Cycles Endured the number of cycles of specified character (that pro- duce fluctuating load) which a specimen has endured at any time in its load history Cycle Ratio the ratio of cycles endured, n, to the estimated fatigue life (S-N) or the strain versus fatigue life (ε- N) diagram for cycles of the same character, that is, C=n/N Design Life the period during which the structure is required to perform without repair Design Spectrum the total of all stress spectra, caused by all loading events during design life, to be used in the fatigue assessment Discontinuity an absence of material causing stress concentration. Typical discontinuities are cracks, scratches, corro- sion pits, lack of penetration, porosity or undercut Environment the aggregate of chemical species and energy that surrounds the test specimen Estimation a procedure for making a statistical inference about the numerical values of one or more unknown popu- lation parameters from observed values in sample Fail-Safe fatigue limit state assessing the gradual, stable crack propagation Fatigue the process of progressive localised permanent struc- tural change occurring in a material subjected to con- ditions that produce fluctuating stresses and strains at some point or points and that may culminate in cracks or complete fracture after a sufficient number of fluctuations Fatigue Crack Growth Rate the rate of crack extension caused by constant ampli- tude fatigue loading, expressed in terms of crack ex- tension per cycle of fatigue (da/dN) Fatigue Life N the number of loading cycles of a specified character that a given specimen sustains before failure of a specified nature occurs TALAT 2401 10
  • 11. Fatigue Limit σf theoretically the fatigue strength for N→∞, or the limiting value of the median fatigue strength as the fatigue life, N, becomes very large. When all stresses are less than the fatigue limit, no fatigue assessment is required. In most cases the fatigue limit is given at 2*106 or 5*106 cycles. Fatigue Loading periodic or non-periodic fluctuation loading applied to a test specimen or experienced by a structure in service (also known as cyclic loading). Fatigue Notch Factor Kf the ratio of the fatigue strength of a specimen with no stress concentration to the fatigue strength of a specimen with a stress concentration for the same percent survival at N cycles and for the same conditions Fatigue Notch Sensitivity a measure of the degree of agreement between fatigue notch factor Kf and the theoretical stress concentration factor Kt Fatigue Strength a value of stress for failure at exactly N cycles as de- termined from a S-N diagram. The value of SN thus determined is subject to the same conditions as those which applied to the S-N diagram Group the specimens of the same type tested at one time, or consecutively, at one stress level. A group may com- prise one or more specimens Hysteresis the stress-strain path during the cycle Loading Amplitude one half of the range of a cycle Loading Event a well defined loading sequence on the entire struc- ture caused by the occurrence of a loading. This may be the approach, passage and departure of a vehicle or device on the structure Loading (Unloading) Rate the time rate of change in the monotonic increasing (decreasing) portion of the load time function Load Stress Ratio R the algebraic ratio of the two loading parameters of a cycle; the most widely used ratio is R = Pmin/Pmax = σmin/σmax Maximum Load Pmax the load having the highest algebraic value TALAT 2401 11
  • 12. Maximum Stress σmax the stress having the highest algebraic value Mean Load Pm the algebraic average of the maximum and minimum loads in constant amplitude loading, or of individual cycles in spectrum loading, or the integral average of the instantaneous load values of a spectrum loading history Mean Stress σm the algebraic average of the maximum and minimum stresses in constant amplitude loading, or of individual cycles in spectrum loading, or the integral average of the instantaneous stress values of a spectrum loading history Miner's Summation a linear damage accumulation calculation (Palmgren-Miner rule) Minimum Load Pmin load having the lowest algebraic value Minimum Stress σmin stress having the lowest algebraic value Nominal Stress the applied stress calculated on the area of the net section of the structural component by simple theory ignoring stress raisers and disregarding plastic flow Parameter a constant (usually to be estimated) defining some property of the frequency distribution of the popula- tion, such as a population median or a population of a standard deviation Peak the occurrence where the fatigue derivative of the load time history changes from positive to negative sign; the point of maximum load in constant amplitude loading Population the totality of set of test specimens, real or conceptual, that could prepared in the specified way from the material under consideration Probability of Failure P the ratio of the number of observations failing in fatigue to the total number of observations Probability of Survival Q it follows that P + Q = 1 Random Loading a spectrum load where the peak and valley loads and their sequence result of a random process; the loading is usually described in terms of its statistical properties, such as the probability density function, TALAT 2401 12
  • 13. the mean, the root mean square, the irregularity factor, and others as appropriate Range ∆P, ∆σ, ∆ε the algebraic difference between successive valley and peak loads (positive range or increasing load range) or between successive peak and valley loads (negative range or decreasing load range). Reversal the occurrence where the first derivative of the load- time history changes sign Run-Out the piece at a number of cycles at which no apparent fatigue damage has been observed and test is continued Sample the specimens selected from the population for test purposes Significance an effect or difference between populations is said to be present if the value of a test-statistic is significant, that is, lies outside of selected limits Survival Limit p% a curve fitted to the fatigue life for p% survival va- lues of each several stress levels. It is an estimate of the relationship between stress and the number of cycles to failure that p% of the population would survive, p may be any percent (in most cases p is set equal 97.5%) S-N Diagram a plot of stresses against the number of cycles to failure. The stress can be the maximum stress σmax, the minimum stress σmin, or stress range ∆σ. The diagram indicates the S-N relationship for a specified value of σm or R and a specified probability of survival. For N a log scale is almost always used. For σ a linear scale or log scale is used in most cases. Spectrum Loading a loading in which all of the peak loads are not equal or all of the valley loads are not equal (also known as variable amplitude loading) Statistic a summary value calculated from the observed values in a sample Stress Level the pair of stress (or strain) components necessary to define the applied cycle TALAT 2401 13
  • 14. Stress Ratio R the algebraic ratio of the minimum stress to the maximum stress in one cycle, R = σmin/σmax Stress Intensity Factor K the magnitude of the ideal-crack-tip stress field (a stress-field singularity) for a particular mode in a homogeneous, linear elastic body Stress Concentration Factor Kt the ratio of the greatest stress in the region of a notch as determined by advanced theory to the corresponding stress Test of Significance a statistical test that purports to provide a test of a null hypothesis, for example, that an imposed treatment in the experiment is without effect Tolerance Interval an interval computed so that it will include at least a stated percentage of the population with stated prob- ability Tolerance Limit the two statistics that define a tolerance interval Truncation the exclusion of cycles with values above, or the ex- clusion of cycles with values below a specified level (referred to as truncation level) of a loading para- meter Valley The occurrence where the first derivative of the lad time history changes from negative to positive sign; the point of minimum load in constant amplitude loading Variable Amplitude Loading see spectrum loading TALAT 2401 14
  • 15. Figure 2401.01.06 Definitions: Constant Amplitude Loading Definitions: Constant Amplitude Loading maximum, Pmax amplitude, Pa mean, Pm Load range amplitude, Pa minimum, Pmin cycle Time alu Training in Aluminium Application Technologies Definitions: Constant Amplitude Loading 2401.01.06 Figure 2401.01.07 Definitions: Spectrum Loading Definitions: Spectrum Loading peak reversal (+) range (-) range Load mean mean crossing valley reversal Time alu Training in Aluminium Application Technologies Definitions: Spectrum Loading 2401.01.07 TALAT 2401 15
  • 16. Symbols a crack length e eccentricity E modulus of elasticity G shear modulus K stress intensity factor l length of attachments m slope constant in fatigue strength equation ni number of cycles corresponding to specified stresses σi N number of cycles corresponding to a particular fatigue strength Nc cut-off-limit R stress ratio R = σmin/σmax t plate thickness Rm ultimate tensile strength Rp,0.2 tensile strength at ε = 0.2 % εmax maximum strain εmin minimum strain ∆ε strain range σmax maximum stress σmin minimum stress σres residual stress ∆σ stress range ∆σ = σmax - σmin ∆σe equivalent constant amplitude stress calculated from the respective stress range spectrum for a particular value for m τ shear stress TALAT 2401 16
  • 17. 2401.02 Fatigue Damage and Influencing Parameters • Response of material to cyclic loading • Generation of fatigue cracks • Fatigue crack growth • Crack growth mechanism • Effect of other parameters on crack propagation rate • Endurance limit • Predictive theories of fatigue • Damage accumulation theories • Manson-Coffin law • Crack growth laws • Ideal cumulative damage theory Fatigue damage occurs in metals due to local concentrations of plastic strain. Consequently minimising these strain concentrations must be the first rule for avoiding fatigue failure. As an alternative or complementary method a material must be chosen which best resists the mechanisms which lead to cracks and their growth. It is important to understand these mechanisms and the influence of them on material properties, load amplitudes and their sequence, temperature and environment. We treat the problem in a simplified view recognising the fact that real structures contain discon- tinuities which may develop into cracks with applications of stress, progressive crack extension following up to final failure. We study thus the material response to cyclic loading at temperatures in the sub-creep range. Procedures for minimising, repairing and detecting fatigue damage can be thus applied intelligently. By far the most common mode of fatigue failure consists simply of initiation and propa- gation of cracks to the point of static failure. A degradation of material properties during fatigue is not normally observed. Superimposed on the general response of the material to cyclic loading, i.e. hardening or softening depending on the material, the load amplitude and the temperature, localised plastic deformation develops at stress concentration points. This repeated, localised plastic deformation leads to crack initiation. Provided the local stress concentration ex- ceeds a certain threshold, a fatigue crack, once initiated, continues to grow a finite amount during each cycle. Crack propagation occupies a major portion of fatigue life, especially at high load am- plitudes. Final failure may be the result of the growth of one crack, or of many small cracks coalescing into a final crack. The higher the load amplitude, the more likely the production of multiple cracks. Corrosive environment also produces multiple cracking and accelerates failure. TALAT 2401 17
  • 18. Final catastrophic failure occurs when a crack has grown to a critical length such that the next application of load produces static failure of the remaining net section. Under service conditions of variable amplitude loading, the critical crack length must be defined of course, in terms of the highest expected load and the total load spectrum. Redundant structures, i.e. structures designed with 'crack arrestors' stopping the rapid growth of critical cracks before they weaken the integrity of the total structure, represent an important advance in fatigue design based on the previously described crack growth mechanisms. Response of Material to Cyclic Loading The familiar stress-strain relation and work hardening under static, tensile loading con- dition forms practically the first quarter-cycle of an extended fatigue test. The fatigue test itself can be performed in a stress- or strain-controlled manner. The stress amplitude σ or strain amplitude ε, the mean stress or strain, and the number of cycles N characterise the usual fatigue test. For strain-controlled tests one has to distinguish between control of either the total or the plastic strain amplitude. Stress- or Strain Control σ σ ∆σ σp $ ∆tp $ (a) Stress-controlled stress strain loops (b) Strain-controlled stress-strain loops σp σp σs σs N N (c) Strain-controlled hardening (d) Strain-controlled softening (initially cold worked metal) Source: J. C. Grosskreutz, 1970 alu Stress-Strain Loops: Training in Aluminium Application Technologies (a) Stress Control, (b) Strain Control 2401.02.01 If the stress range ∆σ is controlled and maintained constant, the strain amplitude gradu- ally decreases, Figure 2401.02.01. If the plastic strain range ∆εp is controlled, the stress amplitude required to maintain the strain limit gradually increases. A fatigue hardening or softening curve is represented by the peak stress amplitude σp when each cycle is plotted against the number of cycles. Such curves generally show that rapid hardening or softening occurs in the first few percent of total fatigue life. Eventually the material 'shakes down' into a steady-state or saturation condition in which the rate of hardening or softening becomes zero. The magnitude of the saturation stress, σs depends on the TALAT 2401 18
  • 19. plastic strain amplitude, the temperature and the initial degree of cold work - σs increases when ∆εp is increased or the temperature is decreased. Aluminium exhibits generally a unique saturation stress σs for a given ∆εp and temperature independent of prior load history (the so-called wavy-slip mode). The locus of the tips of all stead-state cyclic loops of width ∆εp forms the so-called 'cyclic stress-strain curve', i.e. the steady-state cyclic stress strain behaviour of the material. The curve is generated by plotting (for a given temperature and initial condition) the saturation stress vs. ∆εp/2, (Figure 2401.02.02). An approximate expression for the cyclic stress-strain curve is: σs = σo (∆εp/2)n' where σo is a constant and n' is the cyclic strain hardening exponent with a value of approxi- mately 0.15 for wavy-slip mode materials such as aluminium. The above equation is extremely useful in low cycle fatigue applications. It gives in con- venient form the stable stress amplitudes to be expected from a given imposed strain amplitude, or vice-versa. Using it, one can convert easily from Manson-Coffin type plots of log(∆σp) vs. log(n) to S-N plots. Cyclic Stress- Monotonic Stress-Strain Curve Strain Curve σ σ Cold Worked Material Cyclic Stress- Strain Curve Stress εp Annealed Material Monotonic Stress- Strain Curve Stable Loops Plastic Strain of ∆εp/2 Construction of the cyclic stress- Comparison of monotonic tensile and cyclic strain curve from stable loops stress-strain curves. For aluminium - a wavy slip mode material - the two cyclic stress- strain curves would be identical. after Feltner and Laird, 1967 alu Cyclic Stress-Strain Curve 2401.02.02 Training in Aluminium Application Technologies TALAT 2401 19
  • 20. On a microscopic scale the movement of dislocations in the crystal structure leads to the saturation condition as described above and serves only to determine the flow stress of the metal, i.e. its hardness. Fatigue hardening/softening mechanisms in complex, precipitation hardened alloys such as the 7000 series of aluminium alloys are not as straightforward. Nevertheless, the main product of the cycling is again a dense array of dislocations whose presence per se does not serve to weaken the material. In certain, specific cases, cyclic straining can cause actual degradation of the precipitate structure in an alloy, thus causing irreversible softening. The softened zones can then become the sites of fatigue failure. A controversy exists over whether such action occurs in high-purity Al-4Cu alloys. No such softening has ever been observed in commercial aluminium alloys, however (Figure 2402.02.02). In the presence of stress concentration, enhanced fatigue hardening will occur in propor- tion to the stress or strain concentration factor. One can expect this enhancement in the vicinity of notches, fasteners, welds, and most importantly, near the tip of a fatigue crack. Generation of Fatigue Cracks When is a crack ? For the practitioner a crack exists when he can see it with the observational technique, he normally employs for such purposes, the naked eye, a glass magnifier, a metallogra- phic microscope, or an electron microscope. A fatigue crack may vary in length from anywhere from 3mm down to 1000Å. Defining a crack in terms of the highest resolving power instrument available (the elec- tron microscope for instance) it is possible to establish a number of load cycles NI, to generate an observable fatigue crack. It is usual to express the result in terms of the fraction of total life, NI/NT. It has been shown that this ratio is normally a small number in unnotched members, about 0.1, so that fatigue crack propagation occupies a large percentage of total life. This is especially true in structural components with existing imperfections due to manufacturing. Nevertheless the mechanisms of crack initiation and respective estimation of life cycles are important for certain applications in the high- cycle range. As already mentioned fatigue cracks always begin at concentrations of plastic strain. Consequently if no other manufacturing imperfections are present fatigue cracks have their origins at the surface. The so-called slip band formation, extrusions and intrusions on the surface of an otherwise uncracked material form fatigue crack initiation sites (Figure 2401.02.03). TALAT 2401 20
  • 21. Notch-Peak Geometry of Slip Bands at a Free Surface Surface nd pBa Sli alu Training in Aluminium Application Technologies Notch-Peak Geometry of Slip Bands 2401.02.03 Under high amplitude loading fatigue cracks start at grain boundaries in pure alumini- um. In many commercial alloys the existence of large second phase particles, inclusions, play a predominant role in crack generation. They cause localised plastic deformation leading to cracking usually at the inclusion matrix interface (Figure 2401.02.04). Fatigue Crack Initiation at a Surface Inclusion after 5% of Total Life 2024-T4 Aluminium Alloy Inclusion Fatigue Crack after J. C, Grosskreutz, ASTM STP 495, 1970 alu Training in Aluminium Application Technologies Fatigue Crack Initiation at a Surface Inclusion 2401.02.04 Other flaws such as internal voids or large surface scratches may be the sites of fatigue crack generation. Such flaws need only the application of cyclic load to begin their growth as bona fide fatigue cracks. TALAT 2401 21
  • 22. Joints are an important site for fatigue crack generation in structures since they exhibit substantial stress concentration points, notches, either on the free surface of the compo- nent or at internal surfaces, such as lack of penetration in welds. Another cause for fati- gue crack formation at joints may be fretting. There is indication that cracks must reach a minimum critical size before they can begin propagating. Nonpropagating microcracks which have been observed at very low stress amplitudes may be examples of cracks, for which the generation mechanism ceased to operate before they reached critical size. The value of NI/NT is dependent of the load amplitude, specimen geometry, material properties, the temperature, previous loading history, and the environment. In very gene- ral terms the following statements help to describe the various effects. The value of NI/NT decreases with increasing load amplitude, so that in the extreme low cycle range the entire life is consumed in crack propagation and in the extreme high cy- cle range a substantial portion of the entire life is consumed in crack initiation. With in- creasing load amplitude a larger number of cracks are generated. A stress concentration will reduce NI/NT (Table 1). Microcracks will develop more quickly in wavy-slip mode materials. Cracks develop sooner in more ductile materials as illustrated by comparing the notched 2014 and 2024 aluminium alloy with the 7075 alloy. The combination of fatigue stresses and even a mildly corrosive environment accelerates the time for crack generation. The effects on later crack growth are even more pronou- nced. One of the more important environmental constituents is water vapour which has a strong effect on the fatigue of aluminium and its alloys. Previous load history can have two effects. First, if the material has been hardened, as already mentioned in the case with commercial aluminium alloys, the yield stress is increased, and under constant stress conditions, the time to generate a crack would be increased. Secondly, prior load- ing can produce significant residual stresses at the root of a notch. For example prior tensile stress will leave a compressive residual stress, and cracks at the notch root will be very slow in developing compared to the annealed state. A similar situation may arise by superimposed stress conditions such as mean stresses due to external loads or to residual stresses. Treatments such as shot-peening are used to induce compressive resid- ual stresses on surfaces, so that NI can be significantly increased. Before applying any of these guidelines to a specific situation it should first be ascertai- ned whether cracks already may exist, in which case the crack generation state, often referred to as crack initiation stage as well, is effectively bypassed. Many real structures already contain microcracks before the first service load is ever applied. TALAT 2401 22
  • 23. Material Specimen Crack Site NT Cracklength NI/NT Geometry Cycles at first observation 10-2 mm Pure Al smooth Grain 3 ⋅ 105 1.3 0.10 Boundary 2024-T3 smooth 5 ⋅ 104 10.2 0.40 smooth 1 ⋅ 106 10.2 0.70 2024-T4 smooth 150 25 0.60 1 ⋅ 103 25 0.72 5 ⋅ 103 25 0.88 Pure Al notched slip bands 2 ⋅ 106 0.025 0.005 Kt≈2 2024-T4 notched inclusions 1 ⋅ 105 2.0 0.05 Kt≈2 3 ⋅ 106 1 0.07 2014-T6 notched 2 ⋅ 103 6.3 0.015 Kt≈2 2 ⋅ 104 6.3 0.02 1 ⋅ 106 6.3 0.05 7075-T6 notched inclusions 2 ⋅ 105 50 0.64 Kt≈2 7075-T6 notched 5 ⋅ 103 7.6 0.20 Kt≈2 1 ⋅ 105 7.6 0.40 Table 1: Crack generation time as a fraction of total life (after ASTM STP 495, Grosskreuz) Fatigue Crack Growth The increase in crack length ∆a for the increment ∆N of load cycles define the growth rate, ∆a/∆N. This is a function of both, the crack length a and the stress or strain ampli- tude. Observed growth rates may range between 10-10 m/cycle at low amplitudes to about 10-3 m/cycle at high amplitudes. The importance of the growth rate lies in its use to calculate remaining life times, given a certain initial crack length ai after NI load cy- cles. Assuming that a is a continuous function of N, the instantaneous crack growth rate da/dN can be used to give the total life for a crack propagation aT da N P = NT − N I = ∫ aI ( da / dN ) TALAT 2401 23
  • 24. Desirable is a theory of fatigue crack growth yielding universal expressions for da/dN as a function of a, σ or ∆εp, and material properties. Not only could such a theory be used to predict fatigue lives, but it would allow a designer to choose those materials most re- sistant to fatigue crack growth. Central to the construction of such a theory is a model which can be described mathematically to give the incremental advance of the crack. Such a model must be derived from experimental observation. Respective analytical expressions, supported by experimental observations, in the case of aluminium alloy structural components and their welded connections, as well as the analytical procedures for life estimation will be explained in detail under a later chapter on fracture mechanics applications. At this point some general observations on the pro- pagation modes, the crack growth mechanisms and the effects of multiple load amplitu- des and other parameters on da/dN will be briefly covered. Cracks forming in slip bands propagate along the active slip planes which are inclined at ±45° with respect to the tensile stress axis. This shear mode propagation, Stage I growth, tends to continue more deeply into the specimen the lower the amplitude of loa- ding. The crack soon begins to turn and follow a course perpendicular to the tensile axis. This tensile mode propagation as called Stage II growth, characterising crack growth up to the critical length for which the next load peak produces tensile failure of the speci- men (Figure 2401.02.05). Stage I and II Fatigue Crack Growth σ Stage II Stage I Source: C. Laird, 1967 σ alu Training in Aluminium Application Technologies Stage I and II Fatigue Crack Growth 2401.02.05 Actually, the Stage I growth in a polycrystalline material involves hundreds of individu- al slip band cracks linking up to form a dominant crack at about the time Stage II growth begins. Stage II crack growth life increases with increasing load amplitude. Cracks formed at inclusions grow only a few micrometers in Stage I before changing to the Stage II mode. At low stress or strain amplitudes, very few inclusion cracks are gen- erated and one such crack may grow all the way into the final failure crack. At higher TALAT 2401 24
  • 25. amplitudes several inclusion cracks may joint together to form the final crack, thus producing discontinuous jumps in da/dN. This case is of importance and will be de- monstrated in more detail in the respective chapter on fracture mechanics applications to welded connections. Examination of fracture surfaces tells us a lot about the mechanism by which the crack advances. For all practical purposes the entire fracture surface formed is governed by the Stage II mode. Very near the crack nucleus, while the crack length is still small, condi- tions of plane strain hold at the crack tip. The fracture surface is microscopically flat and oriented perpendicular to the tensile axis. As the crack grows in length a shear lip begins to develop where the fracture surface intersects the specimen surface (Figure 2401.02.06). This reorientation of the fracture surface to a 45° position with respect to the tensile axis is caused by the plane stress conditions at the crack tip intersecting the surface. As the plastic zone in front of the crack tip increases in dimension to become comparable to that of the specimen thickness, plane stress conditions hold everywhere at the crack tip and the fracture surface is one continuous shear lip or double shear lip. Fatigue Crack Initiation Fatigue Crack Growth Plane-strain crack growth occurs at 90° w./r. to tensile axis near the point of initiation. Propagation under plane-stress conditions begins at a later stage and the crack continues in 45° shear mode. after J. C, Grosskreutz, ASTM STP 495, 1970 alu Training in Aluminium Application Technologies Schematic Illustration of a Fatigue Fracture Surface 2401.02.06 The flat, plane strain surface is especially rich in detail, exhibiting regularly spaced stria- tions, even visible at optical magnification. Each striation represents the crack advance for one cycle of load and this was verified experimentally. The conclusion that each striation corresponds to one cycle of crack advance allows one to measure the local rate of crack growth by measuring the distance between adjacent striations. Careful ex- periments have shown that these striations spacings correspond very closely to the mi- croscopic rates of crack growth measured on the surface of the specimen. However the first is consistently larger than the microscopic da/dN on the surface which indicates that surface growth is only an average of local rates in the general direction of Stage II growth. TALAT 2401 25
  • 26. Crack Growth Mechanisms Crack growth rates can be expressed analytically for different crack lengths and for dif- ferent loads in terms of the stress intensity factor range ∆K as will be shown later on. The correlation of crack growth rates with a crack tip stress intensity factor provides the key to a study of crack growth mechanisms. It is only recently that such correlations ha- ve been experimentally verified on a reliable basis for aluminium alloys and especially the material zones in aluminium weldments (Figure 2401.02.07). ∆Keff [MPa√ m] Fatigue Crack 10-3 AlMg4.5Mn Growth Rate 10-4 R=0 + base material 10-5 x HAZ da/dN [ m/LW ] o weld 10-6 10-7 10-8 10-9 10-10 10-11 0.6 1 2 4 6 10 20 40 60 100 ∆K [MPa√ m] Source: D. Kosteas and U. Graf, TUM alu Training in Aluminium Application Technologies Fatigue Crack Growth Rate 2401.02.07 Cross sections taken through the crack tip at various parts of a load cycle have establis- hed that Stage II growth occurs by repetitive blunting and re sharpening of the crack tip (Figure 2401.02.08). TALAT 2401 26
  • 27. Fatigue Crack Growth by the Plastic Blunting Mechanism (a) no load (d) small compressive load (b) small tensile load (e) max. compressive load (c) max. tensile load (f) small tensile load after C. Laird alu Fatigue Crack Growth by the Plastic Blunting Mechanism 2401.02.08 Training in Aluminium Application Technologies Although many investigations of the micromechanisms of fatigue crack growth under spectrum loading have been undertaken in the last decades as there is still an urgent need for further work. However, results are available allowing to some general statements on the effect of multiple load amplitudes. In the first place it is important to distinguish between the effects of spectrum loading on total life on a laboratory specimen and on the growth rate of an existing crack. Much of the literature of spectrum loading has dealt only with total life and the concept of cu- mulative damage. Because total life includes both crack initiation and crack propagati- on, we cannot expect to apply such results to understanding the effect of multiple loads on just crack growth. The effects of multiple load amplitude can be best understood in terms of crack tip plas- tic deformation. The concept of stress intensity factor is of limited use here because it relates only to elastic stresses. The two important concepts are localised work hardening and localised residual stresses at the crack tip. More on the practical application of such analytical and experimental results will follow under the chapter on fracture mechanics, especially in defining a so-called effective stress intensity range. A particularly instructive set of experiments demonstrated in Figure 2401.02.09 depicts the effect of various load sequences on the microscopic growth rate, as determined in experiments on 2024-T3 aluminium, from striation spacings on the fracture surface. Keeping the maximum load constant and varying the amplitude range had no significant effect on crack growth. Reversing the sequence did not affect the results either. If the load amplitude range was kept constant and the maximum load was varied, interaction effects were observed. TALAT 2401 27
  • 28. No interaction effects. Striation spacing stable for each load amplitude range. First cycle of each sequence causes abnormally large striation spacing. Striation spacing in given sequence is smaller than in corresponding sequence in ascending series above. after McMillan and Pelloux alu Training in Aluminium Application Technologies Effect of Variable Load Sequence on Fatigue Crack Growth 2401.02.09 The importance of separating crack initiation and crack propagation interaction effects was stressed. Intermittent overloads can delay the subsequent growth of cracks at lower loads. On the other hand, such overloads are capable of generating new cracks, which can then grow on the lower amplitudes. The overall effect would be to shorten the effective service life of the member by linking together many individual cracks generated in this manner. An opposite case is the so called 'coaxing', in which fatigue at low amplitudes followed by high amplitudes leads to longer, overall lives, even though such a sequence can produce larger than normal crack growth rates. In this case nucleation of cracks is suppressed by the coaxing procedure which hardens the surface layers. Effect of other Parameters on Crack Propagation Rate Crack growth rates are affected by temperature, environment, strain rate or frequency, and material properties. Raising the temperature usually promotes dislocation and slip processes so that the plastic blunting mechanism can act more freely, thereby increasing the rate of Stage II crack growth. Because Stage II crack mechanisms are governed largely by unidirectional mechanical properties (modulus of elasticity, yield and ultimate strength, strain harden- ing coefficient), the effect of temperature of these properties can be extrapolated directly to crack growth rates. However, structural engineering components rarely have to oper- ate at such elevated temperatures. Environment has a significant influence on crack growth rate and may affect the mecha- nism of fracture. The presence of a corrosive environment often will change a ductile fracture mode into a brittle one. The effect is for environmental attack to increase the TALAT 2401 28
  • 29. rate of crack growth. It is not uncommon for the crack growth rate to increase by a factor of about 10 in aluminium alloys exposed in humid air compared to the rate in vacuum. Attention should be given however to the interpretation of laboratory tests on the environmental effects on fatigue and their extrapolation to service conditions. The frequency of loading and the severity of the environmental attack cannot be estimated reliably without prior experimental verification. The effect of material properties on da/dN is of great importance because such informa- tion can be used by the engineer to choose crack resistant materials. Such information is unfortunately not documented in an easily and retrievable and adequate manner. The research in this field is still going on. It can be stated that Stage I crack growth is more rapid in wavy slip mode materials like aluminium. The growth rate in Stage II is gover- ned as already mentioned by the unidirectional properties of the material. Slower rates are obtained by raising the modulus of elasticity, the ultimate tensile strength, and the strain hardening rate. The effect of small grain size in reducing crack growth rates is considerably at low stress amplitudes but negligible at large amplitudes. It should be mentioned that significant variations in fatigue crack propagation rates may be observed in the same material obtained from different sources. Endurance Limit The endurance limit or fatigue limit, is recognised as a change in the slope of a conven- tional S-N curve from negative to zero (flat). Aluminium and its alloys does not give S- N curves with strictly zero slopes at long lives. Nevertheless the curve is nearly flat, and it is usual to speak of the endurance limit at 107 or 108 cycles. The definite endurance limit is connected strongly with the existence of a sharp yield point in the tensile stress- strain curve, as for instance in the case of iron or steel. On the other hand in the case of aluminium alloys, dislocation locking does not occur - which is associated with the sharp yield point - so that there is no definite stress below which cracks refuse to grow. Predictive Theories of Fatigue When will a given construction or component fail? The design engineer needs the answer to provide safe design. The operator demands the answer to provide safe operation. The question can usually be answered through a com- bination of past experience, experimental inspection and testing, and semi-empirical fa- tigue theories. While the latter provide only approximate answers, they are especially important to the design engineer. TALAT 2401 29
  • 30. Damage Accumulation Theories The first theories of fatigue were aimed at describing the typical constant amplitude S-N curve. In terms of the accumulation of some vague, undefined damage within the mater- ial. Failure was assumed to occur with the accumulation of a critical amount of damage. The parameters which had to be adjusted were the rate of damage accumulation and the critical amount for failure. A useful extension of this concept was made by Palmgren- Miner to the case of variable amplitude loading. The criterion for failure under a series of different load amplitudes is given as ni ∑N i =1 i the linear damage accumulation rule. Detailed information on the Palmgren-Miner rule and its applicability in practice will be given in Lecture 2401.04 dealing with load and stress spectra and damage accumulation. Comparison of the rule with experiment has shown it to err in most cases, often on the unsafe side. Yet the rule is close enough to reality, so it is being used frequently as a guide when other more precise information is lacking. That such a simple concept of damage accumulation works at all lies in the basic nature of fatigue failure. Whether the basic process is crack generation or crack growth, each proceeds by a definite increment in each cycle of stress. Crack generation proceeds until a critical stage is reached such that crack growth can than proceed. The crack propagates until it reaches a critical length, such that the next load application brings catastrophic failure. In each case, the term damage can be substituted for crack generation or growth, and the critical stage of the development can be termed a critical amount of damage accumulation. Assuming no interaction effects between different load amplitudes leads directly to the above linear damage accumulation rule. Manson-Coffin Law Under conditions of constant plastic strain range ∆εp the numbers of cycles to failure is found to be (for ∆εp > 0.01) ∆ε p ⋅ ( N T ) = C Z where C and the exponent z are material constants, z weakly dependent on material and with a value in the order 0.5 to 0.7 and the constant C related to ductility and the true tensile fracture strain. This general relationship has been modified to include the total strain range and is usually referred to as the Manson-Coffin law. The development of numerical analysis procedures, especially the finite element method allow a rapid and accurate analysis of local stress and strains at notches or cracks. Rela- ted to the true strain behaviour of the material under repeated loading - the cyclic stress- strain curve as compared to the initial monotonic, static stress-strain curve - the possibil- ity of applying such relationships especially in the area of low-cycle fatigue are outlined in the following. Some more details on local stress concepts in fatigue will follow in TALAT 2401 30
  • 31. Lecture 2401.05. The overall procedure of analysis and life estimation through the Manson-Coffin relation is outlined in. Figure 2401.02.10 and Figure 2401.02.11. Hysteresis σ ∆σ = stress range σa = stress amplitude ∆ε = strain range σa ∆εp = plastic strain range arctan E ∆εe = elastic strain range ∆σ ∆ε/2 = strain amplitude ∆εp ε 2 E = Young's Modulus σa Pf σf = = engineering stress A0 Pf σf = A = true stress ∆ε0 ∆εe f ∆ε/2 ∆ε/2 A0 D = ln = ductility Af ∆ε Source: D. Kosteas, TUM alu Fatigue Damage and Influencing Parameters 2401.02.10 Training in Aluminium Application Technologies Strain-Life Relationship Strain ∆ε σ'f (2Nf ) + ε (2Nf ) b c D0.6 Amplitude 2 E log (∆ε/2) σf /E Morrow plastic 1 1 c b strain elastic strain Cycles to Failure logN f D0.6 σf -0.12 Strain Range ∆ε = 3.5 Nf + D0.6 Nf-0.6 E log ∆ε 3.5 σ /E f Manson- plastic Coffin strain elastic strain Source: D. Kosteas, TUM Cycles to Failure logN f alu Training in Aluminium Application Technologies Strain-Life Relationship 2401.02.11 When plotted on log-log paper, the relationship becomes a straight line. With the aid of the cyclic stress-strain relation this plot can be converted to a S-N curve. A useful ex- pression for the exponent z is given in terms of the cyclic hardening exponent n' TALAT 2401 31
  • 32. 1 z= 2n ' + 1 Since n' ≈ 0.15 we get z ≈ 0.75, this value being about 25% larger than measured values. The detailed dependence of C and z on material constants is not resolved completely. In our opinion the Manson-Coffin relation and further derivations may be a useful tool for comparative studies and initiation life estimations for different materials. The advancement of life estimation methods on the basis of fracture mechanics, especially in cases where fatigue life is governed mainly by propagation, is nowadays a more powerful and sophisticated tool in the hands of a knowledgeable design engineer. Crack Growth Laws Many empirical crack growth laws have been proposed. The most popular have the form da/dN = C ⋅ F(a,s) where C is a constant which depends on the material and F(a,s) is a function determined empirically from the data. There are two important ingredients which are necessary to any successful crack growth theory. First, a realistic model for crack growth. Second, analytical methods for expressing the model in mathematical terms so that a quantitative relation may be derived. It is worth noting that theoretical crack growth laws are of the form da/dN = C ⋅ Km where C is again a material constant and K is the stress intensity factor depending on the instantaneous crack length and the overall nominal stress and affected by geometrical and loading parameters. This is the form found empirically by Paris and others and is discussed in more detail under Chapter 12 on fracture mechanics and life estimation. Ideal Cumulative Damage Theory Ideally one would like to predict the failure of structural components which are subject to a spectrum of loads in a variable environment. While such a theory is not fully available the framework for achieving it is fairly clear. Fatigue mechanisms provide the basic idea, namely that the number of cycles to failure is the sum of the crack initiation time NI and the crack propagation time NP (see Figure 2401.02.12) NT = NI + NP Quantitative expression of NI is a difficult problem, the effect of aggressive environment on crack initiation time is also largely unknown. However, if NI << Np then the problem is minimised. This is often the case with structural components containing substantial notches, for instance welded structures. TALAT 2401 32
  • 33. Loadings σm, εm ∆σ, ∆ε Material Properties Geometry Geometry Material Properties stress-strain relation FE-methods (el.-pl.) FE-methods (el.-pl.) crack prop. behavior hardening empirical methods empirical methods % ' behavior $ % crack 10-1 da/dN softening $ m &$ el &$ $ pl ∆KI 10-8 Kth KIc Crack Initiation Life Crack Propagation low cycle fatigue concepts ∆ε da / dN = f ( ∆K ) = BNb + Cic i 2 Paris, Forman etc. Manson-Coffin, Morrow etc. Damage Accumulation Damage Accumulation ac N ∑ Ni = 1 ( crack a0 NP = ∫ f (∆K )da i t a0 Palmgren-Miner Crack Initiation Ni Np Crack Propagation NT Component Life Source: D. Kosteas, TUM alu Training in Aluminium Application Technologies Outline of Fatigue Life Prediction Methods 2401.02.12 Such an approach to cumulative damage and the prediction of fatigue lives requires an accurate model for the simulation of the service life of the structure as well. Such esti- mations are performed almost entirely nowadays by computer simulation. TALAT 2401 33
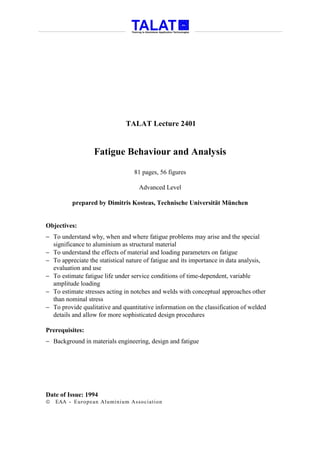
  • 34. 2401.03 Fatigue Data Analysis and Evaluation • Analysis of data • Analysis in the middle-cycle fatigue range • Analysis in the high-cycle fatigue range • Fatigue diagrams • Linear P-S-N curves • Non-linear P-S-N curves • Some problems of data analysis in practice It is a requirement for fatigue design stresses to be related to some probability of failure. This is particularly true in the context of structures whose failure could be catastrophic but it also arises in relation to design rules which are based on limit states. A need for statistical analysis also arises during an actual design procedure, when further levels of sophistication beyond the rules of a recommendation have to be established. In such cases own data or comparisons of data have to be performed on a homogeneous way and compatible to the procedures of the recommendations themselves. In order to meet such requirements, fatigue data need to be analysed statistically. Fatigue data have long been the subject of statistical considerations because of their inherent scatter. However, in practice, fatigue data, especially for welded joints, are seldom ideal material for statistical treatment. Either in the case of literature data, which usually come from several sources, and need to be analysed to provide the basis for design rules - or in the case of data from special fatigue tests carried out under well defined and controlled conditions to validate a particular design. Despite the merits of computerised analysis it must be reminded that the ability to make a qualified, well weighted decision, based on engineering judgement (whatever this may be more than experience) is still extremely valuable. We normally encounter three different types of data: • many results for identical specimens made and tested at the same laboratory • many results for similar specimens, representing more severe stress concentra- tions than in the first type, obtained mainly at one laboratory over a period of years • many results for similar specimens obtained from many different investigations over a period of years. No simple statistical method is suitable for treating all three types of data. Further more, the greatest problem is presented by the third type; this is the type of data which need to be evaluated in the formulation of design rules. TALAT 2401 34
  • 35. Analysis of Data Fatigue life of a specimen will be expressed in cycles to failure. This is the observed variable dependent on the investigated property, i.e. fatigue strength. Practically we perform a test data analysis in order to calculate characteristic values for a statistical population out of the random sample observation. These are the mean value x and the variance s2 or the standard deviation s which identify the population and enable further comparisons. As a next element we need confidence intervals for the observed data which again describe the relation of the sample to the whole population. In the case of fatigue test data we are interested in the calculation of probability of failure or probability of survival limits. Through comparative evaluation of test results by means of variance analysis significant or non-significant deviations may be calculated. Finally the functional relationship be- tween two variables, here fatigue strength and cycles to failure, has to be established by using methods of regression analysis. It is pointed out that statistical and regression methods are included in the operations of the 'Aluminium Data Bank' installed at the Department Aluminium Structures and Fatigue of the University of Munich. Details on these procedures are given in Lecture 2403.02. Statistical/Regressional Analysis for the middle cycle fatigue range Su ,,, Ultimate strength ,,! ,!! !!! [MPa] P-S-N Curve LogN = m logσ + C Probability of survival P maxS at confidence level γ ) ) )* )) )) ))* ))) ++++ Se Endurance limit ,,++ ,,++ ,,,+ ,,,, ~104 Nc LCF MCF HCF Source: D. Kosteas, TUM Cycles to Failure alu Training in Aluminium Application Technologies Statistical / Regressional Analysis 2401.03.01 TALAT 2401 35