SlideShare une entreprise Scribd logo
1  sur  8
Télécharger pour lire hors ligne
Q4 2010 | OFFICE


NORTH AMERICA


HIGHLIGHTS


                                               Office Markets Look and Feel a Lot Better—
                                               But Higher Rents Still Some Way Off
                                               ROSS J. MOORE Chief Economist | USA
MARKET INDICATORS
Relative to prior period                       The U.S. office market finished the year on a relatively strong note, with a sharp drop in vacancy and a
                                               healthy increase in occupied space. Rents continue to languish but the fourth quarter looks to be a key
                            Q4       Q1
                           2010     2011*
                                               turning point. With the economy now posting robust growth, all that is needed for a full recovery is a
                                               surge in employment. Canadian markets also registered reasonably good growth, helping to round out a
           VACANCY                             good quarter for North American office markets. With both the U.S. and Canadian economies back on
                                               more solid footing and the addition of private sector jobs, leasing markets are expected to continue im-
  NET ABSORPTION                               proving as 2011 unfolds.

    CONSTRUCTION                               Fourth quarter data confirms our view that the U.S. office market has entered the recovery stage and
                                               will likely make continued progress, assuming the economy stays on the current path. Most encouraging
      RENTAL RATE
                                               is the twelve-month-long gain in private sector employment. Furthermore, office-using employment
                                  *Projected   was reasonably strong during the October-December period, with professional and businesses employ-
                                               ment in particular up 2.2 percent year-over-year. Widespread increases in rents are still unlikely any-
                                               time soon and any boost is likely to be presaged by a reduction in inducements, which have not material-
                                               ized yet beyond a handful of markets.

                                               U.S. office vacancy rate down sharply. The U.S. national office vacancy rate moved substantially lower
U.S. OFFICE MARKET
SUMMARY STATISTICS, Q4 2010                    during the fourth quarter, moving twenty-nine basis points lower (100 basis points equals one percent).
                                               This represented the first drop after twelve quarters of rising vacancy. Office vacancies finished the
Vacancy Rate: 16.11%
                                                                                                                                                        continued on page 7
 Change from Q3 2010: –0.29
                                                U.S. OFFICE MARKET Q4 2009 – Q4 2010
Absorption:
14.8 Million Square Feet                                               30                                                        17                 With nearly 15 million
                                                                                                                                      Vacancy (%)


                                                                                                                                                    square feet of
New Construction:                                                                                                                                   absorption in the
                                                 Million Square Feet


                                                                                                                                 16
3.8 Million Square Feet                                                20
                                                                                                                                                    fourth quarter, the
                                                                                                                                 15                 U.S. office market
Under Construction:                                                    10                                                                           has unquestionably
22.3 Million Square Feet                                                                                                         14                 turned the corner.

Asking Rents Per Square Foot                                            0
                                                                                                                                 13
 (Change from Q3 2010):
Downtown Class A: $39.29 (0.9%)                                        -10                                                       12
Suburban Class A: $26.04 (-0.9%)                                             Q4 2009   Q1 2010   Q2 2010   Q3 2010     Q4 2010

                                                                                   Absorption    Completions         Vacancy


WWW.COLLIERS.COM
HIGHLIGHTS | Q4 2010 | OFFICE | NORTH AMERICA


 UNITED STATES | DOWNTOWN OFFICE | ALL INVENTORY

                                          EXISTING       NEW SUPPLY   NEW SUPPLY    UNDER          VACANCY        VACANCY        ABSORPTION     ABSORPTION
                                       INVENTORY (SF)      Q4 2010     YTD 2010  CONSTRUCTION      RATE (%)       RATE (%)         Q4 2010       YTD 2010
 MARKET                                  DEC. 31, 2010      (SF)         (SF)        (SF)        SEP. 30, 2010   DEC. 31, 2010      (SF)           (SF)
 Atlanta, GA                              56,869,000              0       753,000            0        15.2            14.7           292,000        428,000
 Bakersfield, CA                           2,966,000              0             0            0         8.8             9.9          (34,000)       (45,000)
 Baltimore, MD                            21,965,000              0        28,000            0        16.9            16.7             32,000      (58,000)
 Boise, ID                                 3,470,000              0             0       30,000        10.7            12.0          (44,000)           2,000
 Boston, MA                               60,235,000        504,000    1,268,000       760,000        16.2            16.6           209,000      (749,000)
 Charleston, SC                            1,991,000      (162,000)    (101,000)        63,000        11.0            10.0             39,000         37,000
 Charlotte, NC                            21,665,000              0    2,050,000             0        13.5            13.5            (4,000)       457,000
 Chicago, IL                             131,673,000              0       679,000            0        17.2            17.0           194,000       (95,000)
 Cincinnati, OH                           11,920,000              0             0      805,000        17.8            18.4          (75,000)      (131,000)
 Cleveland, OH                            34,612,000              0             0            0        18.5            18.5             84,000       115,000
 Columbia, SC                              4,986,000              0       190,000            0        24.6            23.5             57,000      (30,000)
 Columbus, OH                             12,465,000              0             0            0        17.5            17.7              3,000         42,000
 Dallas/Fort Worth, TX                    36,649,000              0             0            0        25.5            25.4             51,000     (323,000)
 Denver, CO                               25,704,000              0             0            0        14.4            13.5           218,000        394,000
 Detroit, MI                              30,446,000              0             0            0        17.0            17.0             50,000     (449,000)
 Fresno, CA                                3,263,000              0        58,000            0        10.9            11.4          (18,000)       (25,000)
 Ft. Lauderdale/Broward Co., FL            8,222,000              0        13,000            0        14.5            15.7          (99,000)        227,000
 Greenville, SC                            3,125,000              0        53,000            0        18.9            18.9            (5,000)      (58,000)
 Hartford, CT                              9,637,000              0             0      180,000        22.6            22.9          (27,000)      (270,000)
 Honolulu, HI                              8,074,000              0             0            0        11.7            12.3          (55,000)      (141,000)
 Houston, TX                              37,514,000              0             0    1,817,000        14.7            14.9        (107,000)       (593,000)
 Indianapolis, IN                         22,910,000              0             0            0        10.8            11.0          (31,000)      (290,000)
 Jacksonville, FL                         16,172,000              0             0            0        14.1            13.9             56,000       101,000
 Kansas City, MO-KS                       18,769,000              0             0            0        17.8            17.1           128,000         (9,000)
 Las Vegas, NV                             3,601,000              0             0            0        15.6            14.6             26,000     (138,000)
 Little Rock, AR                           6,577,000              0      (49,000)            0        10.8            14.5        (247,000)       (122,000)
 Los Angeles, CA                          32,039,000              0             0            0        16.4            16.4          (15,000)      (542,000)
 Louisville, KY                           16,978,000              0        15,000            0         9.4            10.1        (112,000)       (136,000)
 Memphis, TN                               8,470,000              0             0            0        17.4            18.0          (52,000)      (108,000)
 Miami-Dade County, FL                    17,427,000              0    1,335,000       606,000        21.9            21.0           154,000        233,000
 Nashville, TN                            30,984,000              0       528,000      102,000        14.1            13.9           101,000        609,000
 New York, NY – Downtown Manhattan        87,333,000              0    2,000,000     2,600,000        16.4            16.9        (369,000)     (4,179,000)
 New York, NY – Midtown Manhattan        200,280,000              0    1,100,000             0        12.7            12.4           637,000      4,994,000
 New York, NY – Midtown S. Manhattan      71,893,000              0       317,000            0        11.1            10.1           702,000      1,002,000
 Oakland, CA                              16,892,000              0             0            0        12.8            12.2           108,000        107,000
 Orlando, FL                              12,386,000              0       284,000      105,000        15.7            14.2           192,000        353,000
 Philadelphia, PA                         41,599,000              0             0            0        12.9            12.7             58,000     (238,000)
 Phoenix, AZ                              19,368,000              0       769,000            0        21.3            22.0        (141,000)       (635,000)
 Pleasanton/Walnut Creek, CA              12,110,000              0             0            0        16.9            16.9            (8,000)      (16,000)
 Portland, OR                             24,419,000              0       369,000      195,000         9.5             8.8           230,000        410,000
 Raleigh/Durham/Chapel Hill, NC           10,918,000              0             0      165,000         5.1             4.6             56,000       257,000
 Reno, NV                                  1,327,000              0             0            0        27.5            28.2            (9,000)      (68,000)
 Sacramento, CA                           18,247,000              0        18,000      155,000         9.0             9.1          (19,000)      (110,000)
 San Diego County, CA                     10,204,000              0             0            0        17.2            19.4        (220,000)       (245,000)
 San Francisco, CA                        83,434,000        210,000       320,000      288,000        14.9            14.8           326,000        292,000
 San Jose/Silicon Valley, CA               7,593,000              0             0            0        25.0            22.0           198,000          42,000
 Seattle/Puget Sound, WA                  59,555,000              0    1,101,000     1,437,000        15.4            14.7           419,000        945,000
 St. Louis, MO                            24,931,000              0             0            0        23.9            19.2           103,000        863,000
 Stamford, CT                             18,557,000        140,000       140,000            0        17.8            18.4             23,000     (692,000)
 Stockton/San Joaquin County, CA           8,500,000              0             0            0        17.3            18.0          (55,000)        117,000
 Tampa, FL                                 8,565,000              0             0            0        16.3            16.4          (14,000)        112,000
 Washington, DC                          138,367,000              0    3,489,000     1,625,000        11.7            11.1           930,000      3,785,000
 West Palm Beach/Palm Beach Co., FL        9,773,000              0             0            0        19.8            19.9          (17,000)       (66,000)
 White Plains, NY                          8,262,000              0             0            0        11.2            12.6        (120,000)         122,000
 U.S. TOTAL/AVERAGE                    1,595,885,000        693,000   16,727,000    10,933,000        15.05           14.81       3,778,000      5,486,000


P. 2   | COLLIERS INTERNATIONAL
HIGHLIGHTS | Q4 2010 | OFFICE | NORTH AMERICA


UNITED STATES | DOWNTOWN OFFICE | CLASS A

                                                        VACANCY     VACANCY                                  AVERAGE ANNUAL       QUARTERLY   ANNUAL
                                         EXISTING       RATE (%)    RATE (%)    ABSORPTION    ABSORPTION       QUOTED RENT         CHANGE     CHANGE
                                      INVENTORY (SF)     SEP. 30,    DEC. 31,     Q4 2010      YTD 2010         (USD PSF)          IN RENT    IN RENT
MARKET                                  DEC. 31, 2010     2010        2010         (SF)          (SF)          DEC. 31, 2010         (%)        (%)
Atlanta, GA                             31,399,000        19.5        19.3           64,000       432,000        21.40                0.0       0.1
Bakersfield, CA                            670,000         6.5         6.3            1,000         14,000       17.40                0.0       0.0
Baltimore, MD                            9,811,000        18.5        18.2           27,000      (38,000)        23.00               -3.0      -6.0
Boise, ID                                2,038,000         4.6         5.1        (10,000)          17,000       18.00                0.0       0.0
Boston, MA                              41,168,000        15.3        15.7         259,000     (246,000)         46.00                1.0      -3.9
Charleston, SC                           1,102,000         8.9         9.3        (10,000)       (25,000)        28.70                2.6       0.0
Charlotte, NC                           15,553,000        15.5        15.7        (25,000)        503,000        25.00               -2.5     -10.1
Chicago, IL                             74,689,000        17.8        17.3         334,000        572,000        32.00               -1.5       0.0
Cincinnati, OH                           5,996,000        18.7        19.0        (20,000)       (50,000)        21.90                0.1         –
Cleveland, OH                            9,728,000        11.7        13.1      (137,000)      (129,000)         20.40               -1.4      -1.1
Columbia, SC                             2,194,000        15.4        14.1        (30,000)       (64,000)        19.80                0.6       3.0
Columbus, OH                             5,600,000        16.6        18.3        (94,000)       (12,000)        19.30               -0.6      13.5
Dallas/Fort Worth, TX                   22,612,000        23.6        23.1         101,000     (198,000)         25.20                0.0      -0.2
Denver, CO                              18,085,000        13.2        12.1         195,000        567,000        27.00                2.9      -0.9
Detroit, MI                             11,563,000        17.5        17.4            1,000    (283,000)         23.00                1.3       0.7
Fresno, CA                               1,039,000         8.7         9.6          (9,000)          1,000       24.60                0.0       0.0
Ft. Lauderdale/Broward Co., FL           4,464,000        19.7        22.1         105,000     (119,000)         31.80               -1.7      -2.2
Greenville, SC                           1,844,000         8.2         8.8        (11,000)               0       19.50                0.0      -3.8
Hartford, CT                             6,369,000        22.1        22.7        (35,000)     (313,000)         23.00               -0.6      -0.9
Honolulu, HI                             4,709,000        11.8        12.2        (19,000)       (48,000)        35.30               -0.9      -1.6
Houston, TX                             26,670,000        10.1        10.4      (124,000)      (559,000)         34.60               -1.6      -7.4
Indianapolis, IN                         9,547,000        12.8        13.0        (21,000)     (138,000)         19.20                 –          –
Jacksonville, FL                         6,654,000        16.3        15.2           21,000         46,000       18.90               -6.2      -7.8
Kansas City, MO-KS                       5,167,000        26.8        24.5         122,000        173,000        17.10              -18.3         –
Las Vegas, NV                              700,000        12.4        10.1           16,000      (27,000)        34.60               -0.9      -4.0
Little Rock, AR                          2,636,000        12.5        11.5           25,000        (3,000)       16.50                0.0       1.5
Los Angeles, CA                         15,084,000        14.8        14.4           55,000    (354,000)         39.00                0.0      -0.6
Louisville, KY                           4,217,000         8.5         9.5        (43,000)       (62,000)        22.30               -2.0      11.8
Memphis, TN                              1,938,000        23.8        26.4        (50,000)       (74,000)        17.70                4.9       4.7
Miami-Dade County, FL                    9,211,000        25.0        23.1         174,000        217,000        41.50               -0.6      -4.0
Nashville, TN                            3,830,000        24.1        24.9            2,000         35,000       23.70                4.2         –
New York, NY – Downtown Manhattan       58,670,000        20.1        21.1      (154,000)      1,624,000         39.70               -0.2       2.1
New York, NY – Midtown Manhattan       161,250,000        14.6        15.4         438,000     3,576,000         65.00                2.9       4.3
New York, NY – Midtown S. Manhattan     29,654,000        12.9         8.9         221,000     1,847,000         43.20                1.7       6.5
Oakland, CA                             10,198,000        10.8        10.0           83,000        (7,000)       30.80               -0.8      -5.2
Orlando, FL                              5,697,000        18.7        16.8         109,000          42,000       23.90               -0.9      -3.3
Philadelphia, PA                        31,537,000        12.1        12.3        (47,000)     (383,000)         26.10                0.3       1.3
Phoenix, AZ                              9,663,000        22.9        22.8            4,000      (53,000)        28.20               -0.2       7.5
Pleasanton/Walnut Creek, CA              7,787,000        19.1        18.8           24,000      (33,000)        26.30                0.5      -2.2
Portland, OR                            11,451,000         8.4         6.9         191,000        341,000        24.70                1.3       1.2
Raleigh/Durham/Chapel Hill, NC           4,020,000         4.7         5.3           76,000       108,000        23.20                1.7     -10.6
Reno, NV                                   548,000        19.3        19.7          (2,000)      (12,000)        23.40               -0.5       5.4
Sacramento, CA                           8,911,000         9.4         9.1           33,000         27,000       32.80                0.7      11.9
San Diego County, CA                     6,976,000        15.9        16.9        (67,000)       (34,000)        28.70               -2.0      -8.8
San Francisco, CA                       52,333,000        15.1        15.2         119,000       (42,000)        36.00               -0.7       3.6
San Jose/Silicon Valley, CA              3,365,000        35.0        27.9         214,000          96,000       34.30               -1.0      -7.6
Seattle/Puget Sound, WA                 30,761,000        19.5        18.8         325,000     1,137,000         30.50                6.8      17.3
St. Louis, MO                           10,327,000        23.7        22.4         143,000          90,000       17.60               -7.5      -9.8
Stamford, CT                            12,590,000        19.0        20.0           24,000    (613,000)         37.90               -6.8         –
Stockton/San Joaquin County, CA          2,773,000        26.2        27.6        (38,000)        135,000        21.10               15.0      -2.2
Tampa, FL                                4,809,000        18.4        18.5          (3,000)         92,000       22.90                0.4       0.1
Washington, DC                          85,628,000        14.8        14.0         868,000     4,061,000         53.60                2.4       5.1
West Palm Beach/Palm Beach Co., FL       3,323,000        24.9        24.2           25,000      (34,000)        36.60               -0.8      -6.0
White Plains, NY                         5,402,000        13.3        14.5        (64,000)        204,000            –               -2.5         –
U.S. TOTAL/AVERAGE                     913,966,000        16.13       16.02     3,389,000     12,003,000         39.30 weighted      0.89     -1.78
                                                                                                                 28.20 equal       -0.55      -1.04


                                                                                                                     COLLIERS INTERNATIONAL |         P. 3
HIGHLIGHTS | Q4 2010 | OFFICE | NORTH AMERICA


 UNITED STATES | SUBURBAN OFFICE | ALL INVENTORY

                                         EXISTING       NEW SUPPLY   NEW SUPPLY    UNDER          VACANCY        VACANCY        ABSORPTION      ABSORPTION
                                      INVENTORY (SF)      Q4 2010     YTD 2010  CONSTRUCTION      RATE (%)       RATE (%)         Q4 2010        YTD 2010
 MARKET                                 DEC. 31, 2010      (SF)         (SF)        (SF)        SEP. 30, 2010   DEC. 31, 2010      (SF)            (SF)
 Atlanta, GA                             191,564,000       123,000    1,156,000       207,000        17.7            17.6            318,000         418,000
 Bakersfield, CA                           5,968,000             0             0            0        10.6             9.8              48,000        108,000
 Baltimore, MD                           103,638,000       644,000    1,939,000     1,361,000        13.2            12.8            880,000       1,754,000
 Boise, ID                                10,655,000             0       164,000            0        21.0            22.6         (162,000)        (302,000)
 Boston, MA                              104,587,000             0       356,000       59,000        19.0            19.4         (492,000)        1,187,000
 Charleston, SC                            8,548,000        48,000       614,000      105,000        20.6            19.1            117,000         681,000
 Charlotte, NC                            70,649,000       158,000       258,000      350,000        14.5            14.2            348,000         654,000
 Chicago, IL                             104,146,000             0       314,000            0        23.9            23.1            780,000         559,000
 Cincinnati, OH                           25,530,000       132,000       419,000      213,000        24.9            24.3            239,000        (20,000)
 Cleveland, OH                            91,767,000        77,000       160,000      332,000        10.2            10.2            197,000         283,000
 Columbia, SC                              4,872,000             0             0            0        20.5            19.3              57,000       (46,000)
 Columbus, OH                             35,163,000             0             0       90,000        19.3            17.5              75,000        104,000
 Dallas/Fort Worth, TX                   266,520,000       578,000    2,163,000             0        17.3            16.8         1,618,000        2,486,000
 Denver, CO                              116,456,000        62,000       596,000       30,000        15.5            15.1            614,000         978,000
 Detroit, MI                              99,804,000        45,000        88,000        7,000        21.5            21.0            378,000         173,000
 Fairfield County, CT                     41,011,000             0             0            0        10.4            10.9         (147,000)        (275,000)
 Fairfield, CA                             3,708,000             0             0            0        26.5            26.6             (4,000)      (124,000)
 Fresno, CA                               17,821,000             0       147,000            0        15.1            13.5            278,000         369,000
 Ft. Lauderdale/Broward Co., FL           43,670,000             0       171,000            0        14.8            14.7              58,000        369,000
 Greenville, SC                            4,291,000             0             0       14,000        23.5            23.3               7,000       (82,000)
 Hartford, CT                             12,358,000             0             0       14,000        15.0            14.9             (6,000)       (21,000)
 Honolulu, HI                              7,663,000             0             0            0        11.5            11.2             (1,000)       (87,000)
 Houston, TX                             157,392,000        64,000        87,000      256,000        17.2            16.2            725,000       1,069,000
 Indianapolis, IN                         48,126,000             0             0            0        11.5            11.4              59,000        646,000
 Jacksonville, FL                         43,113,000        10,000        15,000       49,000        15.9            15.5            219,000         439,000
 Kansas City, MO-KS                       69,904,000             0             0            0        13.1            13.2           (66,000)       (255,000)
 Las Vegas, NV                            38,598,000             0       109,000       85,000        25.0            25.5         (201,000)        (422,000)
 Little Rock, AR                           7,437,000             0      (10,000)       23,000        10.6            10.9           (24,000)       (223,000)
 Los Angeles – Inland Empire, CA          21,938,000             0        41,000            0        25.2            24.4            156,000          30,000
 Los Angeles, CA                         165,877,000             0       518,000    1,151,000        18.0            18.0              48,000    (2,181,000)
 Louisville, KY                           35,164,000         4,000       247,000            0        12.9            17.8            118,000        (95,000)
 Memphis, TN                              28,054,000             0             0       12,000        13.0            13.2           (44,000)          51,000
 Miami-Dade County, FL                    64,728,000        48,000       697,000      608,000        15.1            14.9            181,000         614,000
 Nashville, TN                            23,423,000             0       528,000      102,000        11.1            10.5            104,000         635,000
 New Jersey – Central                     65,849,000       259,000       305,000      265,000        22.2            21.2            649,000         112,000
 New Jersey – Northern                    95,670,000             0             0      383,000        18.5            18.4           (16,000)       (579,000)
 Oakland, CA                              15,877,000             0             0       62,000        17.2            17.4            127,000         155,000
 Orange County, CA                        77,351,000             0             0            0        22.4            22.0            243,000       (720,000)
 Orlando, FL                              54,714,000        23,000        88,000      647,000        17.4            16.8            354,000         266,000
 Philadelphia, PA                        109,350,000        30,000       693,000      533,000        16.5            16.2            263,000         715,000
 Phoenix, AZ                             110,066,000        59,000    1,162,000       735,000        23.0            22.9            182,000         597,000
 Pleasanton/Walnut Creek, CA              30,209,000             0             0            0        18.5            15.7            873,000       1,415,000
 Portland, OR                             44,180,000             0       252,000            0        12.9            12.0            193,000          85,000
 Raleigh/Durham/Chapel Hill, NC           72,383,000       100,000       465,000       85,000        14.1            13.9            212,000         544,000
 Reno, NV                                  5,526,000             0             0        7,000        21.4            19.5            107,000          97,000
 Sacramento, CA                           72,659,000       105,000       346,000      133,000        18.6            18.6              40,000      (140,000)
 San Diego County, CA                     67,587,000             0       355,000            0        17.1            16.1            669,000       1,488,000
 San Francisco Peninsula, CA              33,518,000             0             0            0        17.7            17.6              39,000        343,000
 San Jose/Silicon Valley, CA              54,054,000       555,000       898,000      538,000        20.4            19.9         (360,000)        (732,000)
 Seattle/Puget Sound, WA                  68,753,000             0       772,000      431,000        15.4            15.7         (186,000)            6,000
 St. Louis, MO                            52,003,000             0             0            0        15.8            15.8              35,000        752,000
 Tampa, FL                                71,463,000             0             0            0        16.1            15.6            417,000         198,000
 Washington, DC                          309,348,000             0    1,725,000     2,198,000        14.3            13.6            489,000       1,942,000
 West Palm Beach/Palm Beach Co., FL       29,168,000             0        51,000      272,000        21.3            20.7            172,000         175,000
 Westchester County, NY                   37,942,000             0             0            0        11.0            10.7               3,000       (30,000)
 U.S. TOTAL/AVERAGE                    3,551,815,000     3,124,000   17,889,000    11,358,000        17.01           16.69       10,978,000      16,162,000


P. 4   | COLLIERS INTERNATIONAL
HIGHLIGHTS | Q4 2010 | OFFICE | NORTH AMERICA


UNITED STATES | SUBURBAN OFFICE | CLASS A

                                                       VACANCY     VACANCY                                 AVERAGE ANNUAL        QUARTERLY   ANNUAL
                                        EXISTING       RATE (%)    RATE (%)    ABSORPTION    ABSORPTION      QUOTED RENT          CHANGE     CHANGE
                                     INVENTORY (SF)     SEP. 30,    DEC. 31,     Q4 2010      YTD 2010        (USD PSF)           IN RENT    IN RENT
MARKET                                 DEC. 31, 2010     2010        2010         (SF)          (SF)         DEC. 31, 2010          (%)        (%)
Atlanta, GA                              81,300,000       18.5        18.3         214,000       549,000        21.50               -0.8       -2.5
Bakersfield, CA                           2,691,000        6.9         6.5          13,000        44,000        24.00                0.0        0.0
Baltimore, MD                            33,088,000       17.0        16.5         507,000     1,047,000        26.00                0.0        5.6
Boise, ID                                 4,608,000       22.2        24.5      (104,000)      (127,000)        18.00                0.0       -1.4
Boston, MA                               44,256,000       17.7        18.0      (144,000)      1,278,000        25.80               -1.6        3.2
Charleston, SC                            4,395,000       14.3        15.3        (52,000)       444,000        23.50                0.0        4.4
Charlotte, NC                            18,182,000       18.0        17.4         237,000       512,000        20.30               -0.4        1.5
Chicago, IL                              57,508,000       25.3        24.0         728,000       630,000        27.30               -0.6       -0.9
Cincinnati, OH                           13,530,000       24.8        24.4         158,000      (94,000)        20.40                0.0          –
Cleveland, OH                            12,761,000       12.3        12.3          72,000      (47,000)        22.00                1.4        2.0
Columbia, SC                                888,000       20.5        16.3          38,000        56,000        17.00                0.2       -2.8
Columbus, OH                             11,565,000       12.9        16.5          70,000       368,000        17.90               -1.7       -2.3
Dallas/Fort Worth, TX                    96,288,000       18.6        16.9         855,000     1,130,000        24.80                0.0       -1.0
Denver, CO                               34,856,000       16.0        15.0         388,000       809,000        20.80                0.0       -1.2
Detroit, MI                              25,679,000       18.1        18.1        (36,000)     (189,000)        22.20                0.2       -3.7
Fairfield County, CT                     17,262,000       10.4        11.0        (80,000)      (26,000)        34.70                0.6          –
Fairfield, CA                             2,102,000       30.7        30.6           1,000      (35,000)        25.90               -0.5       -0.9
Fresno, CA                                3,820,000       21.8        18.0         145,000       304,000        25.20                0.0        0.0
Ft. Lauderdale/Broward Co., FL           10,774,000       20.0        19.9          11,000        47,000        27.90               -0.8        1.0
Greenville, SC                            1,772,000       20.7        19.8           8,000      (49,000)        17.60                0.1       -1.0
Hartford, CT                              7,466,000       15.8        14.7          57,000        35,000        20.30               -0.5       -2.5
Houston, TX                              69,047,000       19.2        17.6         664,000       748,000        27.10               -0.7       -0.6
Indianapolis, IN                         12,685,000       15.3        14.2         142,000       306,000        18.30                  –          –
Jacksonville, FL                          9,715,000       13.7        13.0        (68,000)       271,000        19.30                8.7       -3.4
Kansas City, MO-KS                       17,435,000       15.6        16.6      (184,000)      (162,000)        21.10               -1.6          –
Las Vegas, NV                             4,918,000       36.3        38.2        (66,000)     (123,000)        32.30               -1.5       -6.6
Little Rock, AR                           2,689,000       12.2        15.1        (76,000)     (174,000)        18.50                0.0        1.5
Los Angeles – Inland Empire, CA           4,953,000       34.1        31.8         111,000       224,000        24.80               -1.4       -8.4
Los Angeles, CA                         100,895,000       18.4        18.1         285,000   (1,571,000)        32.30               -5.9       -9.1
Louisville, KY                            7,087,000       19.2        23.8        (96,000)        13,000        20.00               -0.8       11.9
Memphis, TN                               7,132,000        9.4        10.3        (65,000)      (92,000)        21.70                0.2       -0.4
Miami-Dade County, FL                    15,267,000       21.9        21.2         106,000       463,000        32.10               -1.4       -1.2
Nashville, TN                            12,805,000        8.9         7.8          55,000       371,000        22.30               11.7          –
New Jersey – Central                     46,472,000       24.6        22.7         842,000       127,000        23.30               -1.4      -10.8
New Jersey – Northern                    63,264,000       18.2        18.3      (153,000)      (552,000)        24.40                0.6      -14.0
Oakland, CA                               3,582,000       32.3        26.8        (27,000)     (230,000)        25.70                4.9       -0.9
Orange County, CA                        33,319,000       24.0        23.5         164,000     (161,000)        26.20               -1.8      -11.4
Orlando, FL                              16,856,000       21.1        20.0         199,000     (300,000)        22.90                0.4       -2.1
Philadelphia, PA                         67,868,000       16.5        16.1         249,000       226,000        24.00               -0.9       -1.4
Phoenix, AZ                              31,497,000       26.8        26.1         198,000       481,000        23.90               -1.9       -5.6
Pleasanton/Walnut Creek, CA              16,340,000       14.3        14.8        (87,000)         7,000        23.60                4.8       -6.2
Portland, OR                             12,537,000       12.2        11.3          80,000     (135,000)        23.20                0.0        1.5
Raleigh/Durham/Chapel Hill, NC           25,327,000       17.6        33.8         134,000       523,000        21.60                0.3        4.6
Reno, NV                                  2,939,000       19.5        17.6          55,000       109,000        19.90                1.2       -7.8
Sacramento, CA                           16,297,000       25.6        26.0          16,000      (93,000)        23.80               -1.9       -5.6
San Diego County, CA                     24,297,000       19.1        17.1         509,000     1,405,000        31.80               -0.4       -8.0
San Francisco Peninsula, CA              21,785,000       12.2        12.2           9,000       359,000        32.20                3.1       -3.9
San Jose/Silicon Valley, CA              26,212,000       24.0        23.4      (392,000)      (135,000)        34.70               -2.7       -3.5
Seattle/Puget Sound, WA                  22,148,000       17.9        19.8         478,000     (198,000)        28.40               -1.4        3.5
St. Louis, MO                            25,041,000       18.1        18.7           8,000       260,000        21.70               -7.0       -6.6
Tampa, FL                                23,501,000       17.3        16.7         121,000       131,000        23.30               -1.1       -4.8
Washington, DC                          161,629,000       16.2        15.6         696,000     2,068,000        31.30                1.5          –
West Palm Beach/Palm Beach Co., FL        9,174,000       20.4        20.3        (25,000)        29,000        30.10               -0.9       -1.2
Westchester County, NY                   18,316,000       14.5        13.5          43,000       196,000        27.20               -2.0          –
U.S. TOTAL/AVERAGE                    1,417,823,000       18.55       18.34     7,012,000    11,075,000         26.00 weighted     -0.93      -2.85
                                                                                                                24.40 equal        -0.69      -2.32


                                                                                                                   COLLIERS INTERNATIONAL |           P. 5
HIGHLIGHTS | Q4 2010 | OFFICE | NORTH AMERICA


 CANADA | DOWNTOWN OFFICE | ALL INVENTORY

                               EXISTING          NEW SUPPLY      NEW SUPPLY       UNDER         VACANCY        VACANCY        ABSORPTION        ABSORPTION
                            INVENTORY (SF)         Q4 2010        YTD 2010     CONSTRUCTION     RATE (%)       RATE (%)         Q4 2010          YTD 2010
 MARKET                       DEC. 31, 2010         (SF)            (SF)           (SF)       SEP. 30, 2010   DEC. 31, 2010      (SF)              (SF)
 Calgary, AB                   37,777,000                 0      2,261,000      1,940,000        13.8             12.0             676,000      1,872,000
 Edmonton, AB                  10,632,000                 0              0        630,000         7.5              8.0            (59,000)      (129,000)
 Halifax, NS                    4,913,000                 0         22,000         10,000         6.4              9.2                   0        (26,000)
 Kitchener-Waterloo, ON         2,376,000                 0        165,000              0        20.6             21.3            (15,000)          89,000
 Montreal, QC                  49,429,000                 0              0              0         7.4              6.9             251,000          96,000
 Ottawa, ON                    14,992,000                 0              0        550,000         4.0              5.6          (239,000)       (233,000)
 Regina, SK                     3,515,000                 0              0        190,000         1.4              1.4                   0         (3,000)
 Saskatoon, SK                  2,072,000            20,000         30,000        100,000         5.8              6.0              15,000          29,000
 Toronto, ON                   88,790,000           226,000        888,000      2,346,000         5.5              5.3             848,000      1,762,000
 Vancouver, BC                 24,466,000                 0              0        127,000         4.4              4.6            (46,000)          21,000
 Victoria, BC                   4,910,000           224,000        233,000              0         4.0              8.4              97,000           7,000
 Winnipeg, MB                  14,888,000                 0         26,000              0         8.0              8.0                   0           3,000
 CANADA TOTAL/AVERAGE         258,760,000           470,000      3,625,000      5,893,000         7.16             7.02         1,530,000       3,488,000


 CANADA | DOWNTOWN OFFICE | CLASS A

                                                     VACANCY       VACANCY                                    AVERAGE ANNUAL        QUARTERLY     ANNUAL
                                     EXISTING        RATE (%)      RATE (%)    ABSORPTION     ABSORPTION        QUOTED RENT          CHANGE       CHANGE
                                  INVENTORY (SF)      SEP. 30,      DEC. 31,     Q4 2010       YTD 2010          (CAD PSF)           IN RENT      IN RENT
 MARKET                             DEC. 31, 2010      2010          2010         (SF)           (SF)           DEC. 31, 2010          (%)          (%)
 Calgary, AB                        24,783,000         12.4           9.8           638,000    2,134,000           39.50                  0.0         -6.0
 Edmonton, AB                        8,254,000          7.0           7.2          (19,000)    (120,000)           38.50                 -3.6        -11.3
 Halifax, NS                         1,916,000          6.6           4.7          (27,000)      (63,000)          31.60                  0.0          0.3
 Kitchener-Waterloo, ON                795,000         16.3          18.0          (13,000)       125,000          24.80                 -9.9         -6.5
 Montreal, QC                       23,076,000          7.6           7.0           131,000         31,000         35.00                  9.4         13.9
 Ottawa, ON                          9,001,000          3.9           6.6        (250,000)     (246,000)           48.30                  0.0         -2.4
 Regina, SK                          1,031,000          1.0           1.1             4,000        (6,000)         34.90                  0.5          0.5
 Saskatoon, SK                         492,000          0.2           0.2                 0         34,000         34.00                  7.9          7.9
 Toronto, ON                        41,588,000          6.8           6.7           744,000    1,395,000           55.62                  3.2          0.7
 Vancouver, BC                      10,034,000          2.6           2.8          (17,000)         43,000         53.00                 -2.8         12.8
 Victoria, BC                          821,000          8.6          16.6           139,000       122,000          37.00                  0.0          0.0
 Winnipeg, MB                        2,619,000          6.6           6.6                 0         27,000         30.00                    –            –
 CANADA TOTAL/AVERAGE              124,409,000          7.51          7.11       1,329,000     3,475,000           43.80 weighted        1.26        -0.31
                                                                                                                   38.20 equal           0.36         0.68


 CANADA | SUBURBAN OFFICE | ALL INVENTORY

                               EXISTING          NEW SUPPLY      NEW SUPPLY       UNDER         VACANCY        VACANCY        ABSORPTION        ABSORPTION
                            INVENTORY (SF)         Q4 2010        YTD 2010     CONSTRUCTION     RATE (%)       RATE (%)         Q4 2010          YTD 2010
 MARKET                       DEC. 31, 2010         (SF)            (SF)           (SF)       SEP. 30, 2010   DEC. 31, 2010      (SF)              (SF)
 Calgary, AB                   23,302,000                 0        186,000        606,000        11.5             10.9               134,000        531,000
 Edmonton, AB                   8,808,000            27,000          27,000             0         7.6             15.5                 19,000    (184,000)
 Halifax, NS                    6,197,000           108,000        161,000         30,000        11.0             11.0               127,000        446,000
 Kitchener-Waterloo, ON         3,286,000                 0          16,000       486,000        12.5             10.4               100,000        204,000
 Montreal, QC                  23,621,000                 0        191,000        112,000         9.7              9.7                (2,000)         35,000
 Ottawa, ON                    20,559,000                 0               0       182,000         7.1              7.5              (75,000)     1,172,000
 Regina, SK                       659,000                 0          12,000             0         0.6              0.6                      0        (3,000)
 Toronto, ON                   97,513,000                 0        983,000              0         7.5              6.6               471,000     1,646,000
 Vancouver, BC                 28,649,000                 0        395,000        781,000        10.2             10.2                 84,000       123,000
 Victoria, BC                   3,573,000            48,000        108,000        130,000         6.7             10.2              (81,000)       (78,000)
 Winnipeg, MB                   3,150,000                 0         (9,000)             0        11.9             11.9                      0        (3,000)
 CANADA TOTAL/AVERAGE         219,318,000           183,000      2,071,000      2,326,000         8.69             8.61             777,000      3,889,000


 CANADA | SUBURBAN OFFICE | CLASS A

                                                     VACANCY       VACANCY                                    AVERAGE ANNUAL        QUARTERLY     ANNUAL
                                     EXISTING        RATE (%)      RATE (%)    ABSORPTION     ABSORPTION        QUOTED RENT          CHANGE       CHANGE
                                  INVENTORY (SF)      SEP. 30,      DEC. 31,     Q4 2010       YTD 2010          (CAD PSF)           IN RENT      IN RENT
 MARKET                             DEC. 31, 2010      2010          2010         (SF)           (SF)           DEC. 31, 2010          (%)          (%)
 Calgary, AB                        10,609,000         12.4          11.6           80,000      327,000            35.00                  7.7         29.6
 Halifax, NS                         8,026,000          4.0           8.5           32,000      351,000            26.70                  0.0         -1.8
 Kitchener-Waterloo, ON              1,448,000         15.3          12.4           41,000      113,000            23.70                 -8.7         -9.8
 Montreal, QC                       13,226,000          8.4           8.4          (3,000)        43,000           26.00                  8.3          5.1
 Ottawa, ON                          1,156,000         78.7          74.3           52,000      676,000            32.00                  6.4          9.2
 Regina, SK                            659,000          0.6           0.6                0       (3,000)           28.50                 16.3         15.9
 Toronto, ON                        42,732,000          7.5           6.9         263,000     1,250,000            30.50                 -3.4          7.6
 Vancouver, BC                      13,590,000         12.5          12.4           90,000      233,000            38.00                  3.6         -9.0
 Victoria, BC                          817,000          3.3           8.7            3,000        47,000           41.50                 25.8         25.8
 CANADA TOTAL/AVERAGE               92,263,000         9.55          9.49         558,000     3,035,000            31.20 weighted        0.63        12.06
                                                                                                                   30.80 equal           3.71         5.43


P. 6   | COLLIERS INTERNATIONAL
HIGHLIGHTS | Q4 2010 | OFFICE | NORTH AMERICA


UNITED STATES | OFFICE INVESTMENT                                                          Office Markets Look and Feel a Lot Better—
                                                                                           But Higher Rents Still Some Way Off
                                          CBD         CBD       SUBURBAN SUBURBAN
                                      SALES PRICE   CAP RATE   SALES PRICE CAP RATE
MARKET                                 (USD PSF)      (%)       (USD PSF)    (%)
                                                                                           Continued from page 1
Atlanta, GA                              81.00        8.66       157.00      9.15
                                                                                           quarter at 16.11 percent, almost certainly marking the be-
Bakersfield, CA                              –           –       116.00         –
                                                                                           ginning of a long decline in vacancy. During the fourth
Boston, MA                              540.00        6.50            –         –
Charleston, SC                          250.00        8.00       135.00     11.00          quarter, downtown vacancies decreased 23 basis points to
Charlotte, NC                                –           –            –         –          register 14.81 percent, while suburban vacancy rates
Chicago, IL                             220.00        7.25       120.00      8.00          staged a slightly larger decrease, falling 32 basis points to
Cincinnati, OH                               –           –       168.00         –          register 16.69 percent. For the year, the U.S. national office
Columbus, OH                             98.00        8.50       135.00         –          vacancy rate fell 12 basis points after peaking in the third
Dallas/Fort Worth, TX                        –           –       180.00      7.00          quarter. Canadian office vacancy rates were also down
Denver, CO                              210.00        7.80       155.00      8.40          during the quarter, with central business district (CBD)
Fairfield County, CT                         –           –       250.00      8.00
                                                                                           vacancies falling 14 basis points to 7.02 percent while sub-
Fresno, CA                              160.00        9.00       160.00      8.50
Ft. Lauderdale/Broward Co., FL          283.63        6.40       142.23      9.80
                                                                                           urban vacancies decreased 8 basis points to 8.61 percent.
Honolulu, HI                                 –           –       226.00      6.50
Houston, TX                             191.50        7.50       139.50      8.00          Office occupancies up for a third consecutive quarter.
Jacksonville, FL                         85.00        9.25       120.00      8.75          The most positive sign U.S. office markets are getting back
Las Vegas, NV                                –           –       122.71         –          on their feet is the third quarterly increase in occupied
Little Rock, AR                          88.00        9.50       110.00      9.25          space. Fourth quarter absorption came in at 14.8 MSF
Los Angeles – Inland Empire, CA              –           –       230.00         –          (million square feet) which was a substantial increase
Los Angeles, CA                         332.00        6.00       280.00      8.00          from the third quarter when occupied space increased by
Miami-Dade County, FL                   175.55        5.75       166.02         –
                                                                                           7.0 MSF. This brought full year absorption to 21.6 MSF, a
Nashville, TN                                –           –        60.70         –
New York, NY – Downtown Manhattan        89.00        6.90            –         –          considerable improvement from 2009 when occupied
New York, NY – Midtown Manhattan        675.00        5.00            –         –          space shrank by 54.4 MSF. Examining fourth quarter ab-
New York, NY – Midtown S. Manhattan     542.00        5.00            –         –          sorption in detail shows 70 percent of newly occupied
Oakland, CA                                  –        8.00            –      9.00          space was in Class A buildings, highlighting the continued
Orange County, CA                            –           –       155.00      8.50          move to quality by many tenants. Canadian markets also
Orlando, FL                                  –           –       160.31      9.10          recorded an increase in occupied space during the fourth
Philadelphia, PA                        112.00        9.00       117.00      9.00          quarter with absorption totaling 2.3 MSF. For the year,
Phoenix, AZ                             212.00           –        92.00      8.25
                                                                                           Canadian office absorption totaled 7.4 MSF, compared
Pleasanton/Walnut Creek, CA             112.50        8.00        87.50      8.50
                                                                                           with -1.1 MSF in 2009.
Portland, OR                            179.75        7.20       149.65      8.40
Sacramento, CA                          180.00        8.10       134.44      8.30
San Diego County, CA                    111.49           –       174.80      8.45          Rent picture again mixed. Fourth quarter data shows CBD
San Francisco Peninsula, CA                  –           –       250.00      6.50          rents increased a further 0.9 percent to average $39.30
San Francisco, CA                       314.00        6.20            –         –          per square foot, while suburban rents fell by a similar per-
Seattle/Puget Sound, WA                 161.30        6.00       395.92      6.70          centage to register $26.00 per square foot. Taking out the
St. Louis, MO                           100.00        9.00       127.00      8.50          effects of some of the larger, higher-priced markets, both
Stamford, CT                            350.00        8.00            –         –          downtown and suburban rents fell during the quarter, fall-
Stockton/San Joaquin County, CA         130.00        8.50            –         –
                                                                                           ing 0.6 and 0.7 percent respectively. On a weighted basis,
Tampa, FL                                    –           –       103.26     10.00
Washington, DC                          688.77           –            –         –
                                                                                           downtown rents fell 1.8 percent over the year while subur-
West Palm Beach/Palm Beach Co., FL           –           –       213.00         –          ban rents dropped 2.9 percent during 2010. Canadian
Westchester County, NY                       –           –       250.00      8.00          downtown office rents moved higher during the quarter
White Plains, NY                        350.00        8.00            –         –          with CBD quoted rents increasing 1.3 percent, while sub-
                                                                                           urban rents increased 0.6 percent.
CANADA | OFFICE INVESTMENT
                                                                                           Office construction slows to a trickle. Fourth quarter of-
                                          CBD         CBD       SUBURBAN SUBURBAN          fice completions totaled just 3.8 MSF, the lowest total on
                                      SALES PRICE   CAP RATE   SALES PRICE CAP RATE        record, and a further decrease from the third quarter when
MARKET                                 (CAD PSF)      (%)       (CAD PSF)    (%)
                                                                                           construction totaled 5.5 MSF. Going forward, office devel-
Calgary, AB                             340.00        6.50       335.00      7.25
Edmonton, AB                            275.09        6.42            –         –          opment will remain extremely subdued, reflected by con-
Kitchener-Waterloo, ON                  160.00        8.00       110.00      7.75          struction activity which registered just 22.3 MSF at the
Montreal, QC                            275.00        7.00       190.00      7.75          end of the quarter. A year ago, construction underway
Ottawa, ON                              270.00        7.25       145.00      7.60          registered 46.0 MSF. Completions may be in the process
Regina, SK                              213.00        7.45            –         –          of bottoming out, but no sharp reversal is expected any-
Saskatoon, SK                           240.00        7.20            –         –          time soon. The Canadian office market also had very little
Toronto, ON                             244.00           –       174.00         –          new construction during the fourth quarter; however,
Vancouver, BC                           400.00        5.75       300.00      6.50
                                                                                           downtown Toronto and Calgary had over 5.0 MSF under
Victoria, BC                            325.00        6.33       290.00      6.75
Winnipeg, MB                            155.00        7.75       135.00      7.75
                                                                                           construction at year-end.


                                                                                                                   COLLIERS INTERNATIONAL |          P. 7
HIGHLIGHTS | Q4 2010 | OFFICE | NORTH AMERICA


                                                                                                               480 offices in
                                                                                                               61 countries on
                                                                                                               6 continents
                                                                                                               United States: 135
                                                                                                               Canada: 39
                                                                                                               Latin America: 17
                                                                                                               Asia Pacific: 194
                                                                                                               EMEA: 95
                                                                                                           •   $1.9 billion in annual revenue
                                                                                                           •   2.4 billion square feet under
                                                                                                               management
                                                                                                           •   Over 15,000 professionals


                                                                                                               COLLIERS INTERNATIONAL
                                                                                                               601 Union Street, Suite 4800
                                                                                                               Seattle, WA 98101
                                                                                                               TEL +1 206 695 4200


                                                                                                               FOR MORE INFORMATION
                                                                                                               Ross J. Moore
                                                                                                               Chief Economist | USA
                                                                                                               TEL +1 617 722 0221
                                                                                                               EMAIL ross.moore@colliers.com
                                                                                      Phoenix, Arizona


                                                                                                               Copyright © 2011 Colliers International.


Glossary                                                                                                       The information contained herein has been obtained
                                                                                                               from sources deemed reliable. While every reasonable
                                                                                                               effort has been made to ensure its accuracy, we cannot
                                                                                                               guarantee it. No responsibility is assumed for any
Inventory – Includes all existing multi- or         Annual Quoted Rent – Includes all costs associ-            inaccuracies. Readers are encouraged to consult their
single-tenant leased and owner-occupied office      ated with occupying a full floor in the mid-rise           professional advisors prior to acting on any of the
                                                                                                               material contained in this report.
properties greater than or equal to 10,000 square   portion of a Class A building inclusive of taxes,
feet (net rentable area). In some larger markets    insurance, maintenance, janitorial and utilities
this minimum size threshold may vary up to          (electricity surcharges added where applicable).
50,000 square feet. Does not include medical or     All office rents in this report are quoted on an
government buildings.                               annual, gross per square foot basis. Rent calcula-
                                                    tions do not include sublease space.
Vacancy Rate – Percentage of total inventory
physically vacant as at the survey date including   Cap Rate – (Or going-in cap rate) Capitalization
direct vacant and sublease space.                   rates in this survey are based on multi-tenant
                                                    institutional grade buildings fully leased at market
Absorption – Net change in physically occupied      rents. Cap rates are calculated by dividing net
space over a given period of time.                  operating income (NOI) by purchase price.

New Supply – Includes completed speculative         Note: SF = square feet
and build-to-suit construction. New supply                PSF = per square foot
quoted on a net basis after any demolitions or            CBD = central business district
conversions.


                                                                                                                         Accelerating success.


WWW.COLLIERS.COM

Contenu connexe

Tendances

Jll commercial real estate market report toronto 2014
Jll   commercial real estate market report toronto 2014Jll   commercial real estate market report toronto 2014
Jll commercial real estate market report toronto 2014Chris Fyvie
 
Q2 2011 Houston Office Market Report
Q2 2011 Houston Office Market ReportQ2 2011 Houston Office Market Report
Q2 2011 Houston Office Market ReportCoy Davidson
 
Toronto office market report q3 2014
Toronto office market report q3 2014Toronto office market report q3 2014
Toronto office market report q3 2014Chris Fyvie
 
Atlanta Office Sector Report (Q2 2016)
Atlanta Office Sector Report (Q2 2016)Atlanta Office Sector Report (Q2 2016)
Atlanta Office Sector Report (Q2 2016)Savills Studley
 
Savills - Office Market Report - Barcelona - Q3 2011
Savills - Office Market Report - Barcelona - Q3 2011Savills - Office Market Report - Barcelona - Q3 2011
Savills - Office Market Report - Barcelona - Q3 2011Eusebi Carles Pastor
 
Q4 2011 - Cincinnati Office
Q4 2011 - Cincinnati OfficeQ4 2011 - Cincinnati Office
Q4 2011 - Cincinnati Officecolliersohio
 
FHO Partners YE 2009 MarketWatch Report
FHO Partners YE 2009 MarketWatch ReportFHO Partners YE 2009 MarketWatch Report
FHO Partners YE 2009 MarketWatch Reportfhopartners
 
JLL Columbus Industrial Outlook - Q4 2020
JLL Columbus Industrial Outlook - Q4 2020JLL Columbus Industrial Outlook - Q4 2020
JLL Columbus Industrial Outlook - Q4 2020Emma Gresky
 
Office real estate a4 2010
Office real estate a4 2010Office real estate a4 2010
Office real estate a4 2010Translinked
 
City of Corona - Demographic Report by Husing
City of Corona - Demographic Report by HusingCity of Corona - Demographic Report by Husing
City of Corona - Demographic Report by HusingDarrell Talbert
 
Q4 2011 Houston Industrial Market Report
Q4 2011 Houston Industrial Market ReportQ4 2011 Houston Industrial Market Report
Q4 2011 Houston Industrial Market ReportCoy Davidson
 
2019 Q4 Industrial St. Louis Report Colliers
2019 Q4 Industrial St. Louis Report Colliers2019 Q4 Industrial St. Louis Report Colliers
2019 Q4 Industrial St. Louis Report ColliersColliersSTL
 
Avison Toronto office market report q2 2015 cre
Avison Toronto office market report q2 2015 creAvison Toronto office market report q2 2015 cre
Avison Toronto office market report q2 2015 creChris Fyvie
 
Colliers Toronto office market report 2015 q3
Colliers Toronto office market report 2015 q3Colliers Toronto office market report 2015 q3
Colliers Toronto office market report 2015 q3Chris Fyvie
 

Tendances (20)

Office q4 2011
Office q4 2011Office q4 2011
Office q4 2011
 
Jll commercial real estate market report toronto 2014
Jll   commercial real estate market report toronto 2014Jll   commercial real estate market report toronto 2014
Jll commercial real estate market report toronto 2014
 
Q2 2011 Houston Office Market Report
Q2 2011 Houston Office Market ReportQ2 2011 Houston Office Market Report
Q2 2011 Houston Office Market Report
 
Toronto office market report q3 2014
Toronto office market report q3 2014Toronto office market report q3 2014
Toronto office market report q3 2014
 
Atlanta Office Sector Report (Q2 2016)
Atlanta Office Sector Report (Q2 2016)Atlanta Office Sector Report (Q2 2016)
Atlanta Office Sector Report (Q2 2016)
 
Savills - Office Market Report - Barcelona - Q3 2011
Savills - Office Market Report - Barcelona - Q3 2011Savills - Office Market Report - Barcelona - Q3 2011
Savills - Office Market Report - Barcelona - Q3 2011
 
Q4 2011 - Cincinnati Office
Q4 2011 - Cincinnati OfficeQ4 2011 - Cincinnati Office
Q4 2011 - Cincinnati Office
 
FHO Partners YE 2009 MarketWatch Report
FHO Partners YE 2009 MarketWatch ReportFHO Partners YE 2009 MarketWatch Report
FHO Partners YE 2009 MarketWatch Report
 
Q4 2019 | Austin Office | Research & Forecast Report
Q4 2019 | Austin Office | Research & Forecast ReportQ4 2019 | Austin Office | Research & Forecast Report
Q4 2019 | Austin Office | Research & Forecast Report
 
JLL Columbus Industrial Outlook - Q4 2020
JLL Columbus Industrial Outlook - Q4 2020JLL Columbus Industrial Outlook - Q4 2020
JLL Columbus Industrial Outlook - Q4 2020
 
Office real estate a4 2010
Office real estate a4 2010Office real estate a4 2010
Office real estate a4 2010
 
City of Corona - Demographic Report by Husing
City of Corona - Demographic Report by HusingCity of Corona - Demographic Report by Husing
City of Corona - Demographic Report by Husing
 
Q4 2011 Houston Industrial Market Report
Q4 2011 Houston Industrial Market ReportQ4 2011 Houston Industrial Market Report
Q4 2011 Houston Industrial Market Report
 
Q3 2017 | Austin Office | Research & Forecast Report
Q3 2017 | Austin Office | Research & Forecast ReportQ3 2017 | Austin Office | Research & Forecast Report
Q3 2017 | Austin Office | Research & Forecast Report
 
Q2 2018 Austin Office Research & Forecast Report
Q2 2018 Austin Office Research & Forecast ReportQ2 2018 Austin Office Research & Forecast Report
Q2 2018 Austin Office Research & Forecast Report
 
Q2 2017 | Austin Office | Research & Forecast Report
Q2 2017 | Austin Office | Research & Forecast ReportQ2 2017 | Austin Office | Research & Forecast Report
Q2 2017 | Austin Office | Research & Forecast Report
 
2019 Q4 Industrial St. Louis Report Colliers
2019 Q4 Industrial St. Louis Report Colliers2019 Q4 Industrial St. Louis Report Colliers
2019 Q4 Industrial St. Louis Report Colliers
 
Q4 2016 Austin Office Research & Forecast Report
Q4 2016 Austin Office Research & Forecast ReportQ4 2016 Austin Office Research & Forecast Report
Q4 2016 Austin Office Research & Forecast Report
 
Avison Toronto office market report q2 2015 cre
Avison Toronto office market report q2 2015 creAvison Toronto office market report q2 2015 cre
Avison Toronto office market report q2 2015 cre
 
Colliers Toronto office market report 2015 q3
Colliers Toronto office market report 2015 q3Colliers Toronto office market report 2015 q3
Colliers Toronto office market report 2015 q3
 

Similaire à North American Office Highlights 4Q 2010

North American Industrial Highlights 4Q 2010
North American Industrial Highlights 4Q 2010North American Industrial Highlights 4Q 2010
North American Industrial Highlights 4Q 2010Coy Davidson
 
North American Office Highlights 2Q 2011
North American Office Highlights 2Q 2011North American Office Highlights 2Q 2011
North American Office Highlights 2Q 2011Coy Davidson
 
Colliers International: Retail Highlights Fall 2010
Colliers International: Retail Highlights Fall 2010Colliers International: Retail Highlights Fall 2010
Colliers International: Retail Highlights Fall 2010Coy Davidson
 
Retail US Highlights Spring 2011
Retail US Highlights Spring 2011Retail US Highlights Spring 2011
Retail US Highlights Spring 2011Coy Davidson
 
Officenahighlights3q2011v1
Officenahighlights3q2011v1Officenahighlights3q2011v1
Officenahighlights3q2011v1Chris Fyvie
 
North American Office Highlights 3Q-2011
North American Office Highlights 3Q-2011North American Office Highlights 3Q-2011
North American Office Highlights 3Q-2011Coy Davidson
 
US Industrial Highlights Q3 2011
US Industrial Highlights Q3 2011US Industrial Highlights Q3 2011
US Industrial Highlights Q3 2011colliersohio
 
FHO Partners 3Q 2010 Market Report
FHO Partners 3Q 2010 Market ReportFHO Partners 3Q 2010 Market Report
FHO Partners 3Q 2010 Market Reportfhopartners
 
North American Office Highlights 4Q 2011
North American Office Highlights 4Q 2011North American Office Highlights 4Q 2011
North American Office Highlights 4Q 2011Coy Davidson
 
Colliers North American Industrial Highlights 4Q-11
Colliers North American Industrial Highlights 4Q-11Colliers North American Industrial Highlights 4Q-11
Colliers North American Industrial Highlights 4Q-11Coy Davidson
 
Office fall2010 final
Office fall2010 finalOffice fall2010 final
Office fall2010 finalChris Fyvie
 
Get Research Resource5
Get Research Resource5Get Research Resource5
Get Research Resource5Igor Bevzenko
 
Q4 2010 Houston Office Market Research
Q4 2010 Houston Office Market ResearchQ4 2010 Houston Office Market Research
Q4 2010 Houston Office Market ResearchCoy Davidson
 
Savills - HCMC Market Brief Q3 2009 ENG
Savills - HCMC Market Brief Q3 2009 ENGSavills - HCMC Market Brief Q3 2009 ENG
Savills - HCMC Market Brief Q3 2009 ENGsavillsvietnam
 
North American Office Highlights Q4 2014
North American Office Highlights Q4 2014North American Office Highlights Q4 2014
North American Office Highlights Q4 2014Coy Davidson
 
National Market Report
National Market ReportNational Market Report
National Market Reportjonathanrutman
 
North American Office Highlights Q1 2012
North American Office Highlights Q1 2012North American Office Highlights Q1 2012
North American Office Highlights Q1 2012Coy Davidson
 
National Office Highlight - Q1 2012
National Office Highlight - Q1 2012National Office Highlight - Q1 2012
National Office Highlight - Q1 2012Jeff Tolrud
 
Cushman & Wakefield Toronto Americas Marketbeat Office Q1 2019
Cushman & Wakefield Toronto Americas Marketbeat Office Q1 2019 Cushman & Wakefield Toronto Americas Marketbeat Office Q1 2019
Cushman & Wakefield Toronto Americas Marketbeat Office Q1 2019 Guy Masse
 

Similaire à North American Office Highlights 4Q 2010 (20)

North American Industrial Highlights 4Q 2010
North American Industrial Highlights 4Q 2010North American Industrial Highlights 4Q 2010
North American Industrial Highlights 4Q 2010
 
North American Office Highlights 2Q 2011
North American Office Highlights 2Q 2011North American Office Highlights 2Q 2011
North American Office Highlights 2Q 2011
 
Colliers International: Retail Highlights Fall 2010
Colliers International: Retail Highlights Fall 2010Colliers International: Retail Highlights Fall 2010
Colliers International: Retail Highlights Fall 2010
 
Retail US Highlights Spring 2011
Retail US Highlights Spring 2011Retail US Highlights Spring 2011
Retail US Highlights Spring 2011
 
Officenahighlights3q2011v1
Officenahighlights3q2011v1Officenahighlights3q2011v1
Officenahighlights3q2011v1
 
North American Office Highlights 3Q-2011
North American Office Highlights 3Q-2011North American Office Highlights 3Q-2011
North American Office Highlights 3Q-2011
 
US Industrial Highlights Q3 2011
US Industrial Highlights Q3 2011US Industrial Highlights Q3 2011
US Industrial Highlights Q3 2011
 
FHO Partners 3Q 2010 Market Report
FHO Partners 3Q 2010 Market ReportFHO Partners 3Q 2010 Market Report
FHO Partners 3Q 2010 Market Report
 
North American Office Highlights 4Q 2011
North American Office Highlights 4Q 2011North American Office Highlights 4Q 2011
North American Office Highlights 4Q 2011
 
Colliers North American Industrial Highlights 4Q-11
Colliers North American Industrial Highlights 4Q-11Colliers North American Industrial Highlights 4Q-11
Colliers North American Industrial Highlights 4Q-11
 
Office fall2010 final
Office fall2010 finalOffice fall2010 final
Office fall2010 final
 
Get Research Resource5
Get Research Resource5Get Research Resource5
Get Research Resource5
 
Q4 2010 Houston Office Market Research
Q4 2010 Houston Office Market ResearchQ4 2010 Houston Office Market Research
Q4 2010 Houston Office Market Research
 
Savills - HCMC Market Brief Q3 2009 ENG
Savills - HCMC Market Brief Q3 2009 ENGSavills - HCMC Market Brief Q3 2009 ENG
Savills - HCMC Market Brief Q3 2009 ENG
 
North American Office Highlights Q4 2014
North American Office Highlights Q4 2014North American Office Highlights Q4 2014
North American Office Highlights Q4 2014
 
National Market Report
National Market ReportNational Market Report
National Market Report
 
Chicago Suburbs 1 Q10
Chicago Suburbs 1 Q10Chicago Suburbs 1 Q10
Chicago Suburbs 1 Q10
 
North American Office Highlights Q1 2012
North American Office Highlights Q1 2012North American Office Highlights Q1 2012
North American Office Highlights Q1 2012
 
National Office Highlight - Q1 2012
National Office Highlight - Q1 2012National Office Highlight - Q1 2012
National Office Highlight - Q1 2012
 
Cushman & Wakefield Toronto Americas Marketbeat Office Q1 2019
Cushman & Wakefield Toronto Americas Marketbeat Office Q1 2019 Cushman & Wakefield Toronto Americas Marketbeat Office Q1 2019
Cushman & Wakefield Toronto Americas Marketbeat Office Q1 2019
 

Plus de Coy Davidson

The Future of Work from Home
The Future of Work from HomeThe Future of Work from Home
The Future of Work from HomeCoy Davidson
 
Occupier Services CoreNetWebinarTakeaways
Occupier Services CoreNetWebinarTakeaways Occupier Services CoreNetWebinarTakeaways
Occupier Services CoreNetWebinarTakeaways Coy Davidson
 
Leading Occupiers to the New Normal
Leading Occupiers to the New NormalLeading Occupiers to the New Normal
Leading Occupiers to the New NormalCoy Davidson
 
Houston Methodist and Colliers International Houston
Houston Methodist and Colliers International HoustonHouston Methodist and Colliers International Houston
Houston Methodist and Colliers International HoustonCoy Davidson
 
2017 Healthcare Marketplace
2017 Healthcare Marketplace2017 Healthcare Marketplace
2017 Healthcare MarketplaceCoy Davidson
 
Colliers International Houston Trends 2017
Colliers International Houston Trends 2017Colliers International Houston Trends 2017
Colliers International Houston Trends 2017Coy Davidson
 
2016 Houston Economic Outlook
2016 Houston Economic Outlook2016 Houston Economic Outlook
2016 Houston Economic OutlookCoy Davidson
 
2016 Healthcare Real Estate Marketplace
2016 Healthcare Real Estate Marketplace2016 Healthcare Real Estate Marketplace
2016 Healthcare Real Estate MarketplaceCoy Davidson
 
Houston Healthcare Real Estate Market Report - Year End 2015
Houston Healthcare Real Estate Market Report - Year End 2015Houston Healthcare Real Estate Market Report - Year End 2015
Houston Healthcare Real Estate Market Report - Year End 2015Coy Davidson
 
Top Office Metros 2015 4Q
Top Office Metros 2015 4Q Top Office Metros 2015 4Q
Top Office Metros 2015 4Q Coy Davidson
 
Colliers Houston Trends 2016 slides
Colliers Houston Trends 2016 slidesColliers Houston Trends 2016 slides
Colliers Houston Trends 2016 slidesCoy Davidson
 
Cre tech year end report 2015
Cre tech year end report 2015Cre tech year end report 2015
Cre tech year end report 2015Coy Davidson
 
Q4 2014 San Francisco Office Report
Q4 2014 San Francisco Office ReportQ4 2014 San Francisco Office Report
Q4 2014 San Francisco Office ReportCoy Davidson
 
Houston Medical Office Report and Healthcare Commentary
Houston Medical Office Report and Healthcare CommentaryHouston Medical Office Report and Healthcare Commentary
Houston Medical Office Report and Healthcare CommentaryCoy Davidson
 
Boma standards-update
Boma standards-update Boma standards-update
Boma standards-update Coy Davidson
 
SIOR: Understanding the Common Factor
SIOR: Understanding the Common FactorSIOR: Understanding the Common Factor
SIOR: Understanding the Common FactorCoy Davidson
 
North American Industrial Outlook Q4 13
North American Industrial Outlook Q4 13North American Industrial Outlook Q4 13
North American Industrial Outlook Q4 13Coy Davidson
 
Colliers Medical Office-Update
Colliers Medical Office-Update Colliers Medical Office-Update
Colliers Medical Office-Update Coy Davidson
 

Plus de Coy Davidson (20)

The Future of Work from Home
The Future of Work from HomeThe Future of Work from Home
The Future of Work from Home
 
Occupier Services CoreNetWebinarTakeaways
Occupier Services CoreNetWebinarTakeaways Occupier Services CoreNetWebinarTakeaways
Occupier Services CoreNetWebinarTakeaways
 
Horizon Tower
Horizon TowerHorizon Tower
Horizon Tower
 
Leading Occupiers to the New Normal
Leading Occupiers to the New NormalLeading Occupiers to the New Normal
Leading Occupiers to the New Normal
 
Houston Methodist and Colliers International Houston
Houston Methodist and Colliers International HoustonHouston Methodist and Colliers International Houston
Houston Methodist and Colliers International Houston
 
2017 Healthcare Marketplace
2017 Healthcare Marketplace2017 Healthcare Marketplace
2017 Healthcare Marketplace
 
Colliers International Houston Trends 2017
Colliers International Houston Trends 2017Colliers International Houston Trends 2017
Colliers International Houston Trends 2017
 
2016 Houston Economic Outlook
2016 Houston Economic Outlook2016 Houston Economic Outlook
2016 Houston Economic Outlook
 
2016 Healthcare Real Estate Marketplace
2016 Healthcare Real Estate Marketplace2016 Healthcare Real Estate Marketplace
2016 Healthcare Real Estate Marketplace
 
Houston Healthcare Real Estate Market Report - Year End 2015
Houston Healthcare Real Estate Market Report - Year End 2015Houston Healthcare Real Estate Market Report - Year End 2015
Houston Healthcare Real Estate Market Report - Year End 2015
 
Top Office Metros 2015 4Q
Top Office Metros 2015 4Q Top Office Metros 2015 4Q
Top Office Metros 2015 4Q
 
Colliers Houston Trends 2016 slides
Colliers Houston Trends 2016 slidesColliers Houston Trends 2016 slides
Colliers Houston Trends 2016 slides
 
Cre tech year end report 2015
Cre tech year end report 2015Cre tech year end report 2015
Cre tech year end report 2015
 
Q4 2014 San Francisco Office Report
Q4 2014 San Francisco Office ReportQ4 2014 San Francisco Office Report
Q4 2014 San Francisco Office Report
 
Houston Medical Office Report and Healthcare Commentary
Houston Medical Office Report and Healthcare CommentaryHouston Medical Office Report and Healthcare Commentary
Houston Medical Office Report and Healthcare Commentary
 
Colliers
Colliers Colliers
Colliers
 
Boma standards-update
Boma standards-update Boma standards-update
Boma standards-update
 
SIOR: Understanding the Common Factor
SIOR: Understanding the Common FactorSIOR: Understanding the Common Factor
SIOR: Understanding the Common Factor
 
North American Industrial Outlook Q4 13
North American Industrial Outlook Q4 13North American Industrial Outlook Q4 13
North American Industrial Outlook Q4 13
 
Colliers Medical Office-Update
Colliers Medical Office-Update Colliers Medical Office-Update
Colliers Medical Office-Update
 

North American Office Highlights 4Q 2010

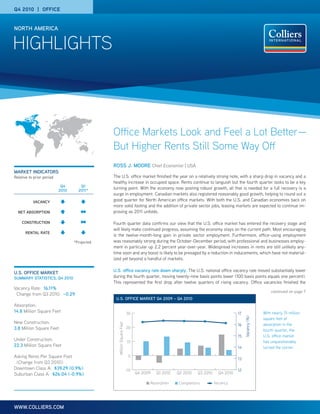
  • 1. Q4 2010 | OFFICE NORTH AMERICA HIGHLIGHTS Office Markets Look and Feel a Lot Better— But Higher Rents Still Some Way Off ROSS J. MOORE Chief Economist | USA MARKET INDICATORS Relative to prior period The U.S. office market finished the year on a relatively strong note, with a sharp drop in vacancy and a healthy increase in occupied space. Rents continue to languish but the fourth quarter looks to be a key Q4 Q1 2010 2011* turning point. With the economy now posting robust growth, all that is needed for a full recovery is a surge in employment. Canadian markets also registered reasonably good growth, helping to round out a VACANCY good quarter for North American office markets. With both the U.S. and Canadian economies back on more solid footing and the addition of private sector jobs, leasing markets are expected to continue im- NET ABSORPTION proving as 2011 unfolds. CONSTRUCTION Fourth quarter data confirms our view that the U.S. office market has entered the recovery stage and will likely make continued progress, assuming the economy stays on the current path. Most encouraging RENTAL RATE is the twelve-month-long gain in private sector employment. Furthermore, office-using employment *Projected was reasonably strong during the October-December period, with professional and businesses employ- ment in particular up 2.2 percent year-over-year. Widespread increases in rents are still unlikely any- time soon and any boost is likely to be presaged by a reduction in inducements, which have not material- ized yet beyond a handful of markets. U.S. office vacancy rate down sharply. The U.S. national office vacancy rate moved substantially lower U.S. OFFICE MARKET SUMMARY STATISTICS, Q4 2010 during the fourth quarter, moving twenty-nine basis points lower (100 basis points equals one percent). This represented the first drop after twelve quarters of rising vacancy. Office vacancies finished the Vacancy Rate: 16.11% continued on page 7 Change from Q3 2010: –0.29 U.S. OFFICE MARKET Q4 2009 – Q4 2010 Absorption: 14.8 Million Square Feet 30 17 With nearly 15 million Vacancy (%) square feet of New Construction: absorption in the Million Square Feet 16 3.8 Million Square Feet 20 fourth quarter, the 15 U.S. office market Under Construction: 10 has unquestionably 22.3 Million Square Feet 14 turned the corner. Asking Rents Per Square Foot 0 13 (Change from Q3 2010): Downtown Class A: $39.29 (0.9%) -10 12 Suburban Class A: $26.04 (-0.9%) Q4 2009 Q1 2010 Q2 2010 Q3 2010 Q4 2010 Absorption Completions Vacancy WWW.COLLIERS.COM
  • 2. HIGHLIGHTS | Q4 2010 | OFFICE | NORTH AMERICA UNITED STATES | DOWNTOWN OFFICE | ALL INVENTORY EXISTING NEW SUPPLY NEW SUPPLY UNDER VACANCY VACANCY ABSORPTION ABSORPTION INVENTORY (SF) Q4 2010 YTD 2010 CONSTRUCTION RATE (%) RATE (%) Q4 2010 YTD 2010 MARKET DEC. 31, 2010 (SF) (SF) (SF) SEP. 30, 2010 DEC. 31, 2010 (SF) (SF) Atlanta, GA 56,869,000 0 753,000 0 15.2 14.7 292,000 428,000 Bakersfield, CA 2,966,000 0 0 0 8.8 9.9 (34,000) (45,000) Baltimore, MD 21,965,000 0 28,000 0 16.9 16.7 32,000 (58,000) Boise, ID 3,470,000 0 0 30,000 10.7 12.0 (44,000) 2,000 Boston, MA 60,235,000 504,000 1,268,000 760,000 16.2 16.6 209,000 (749,000) Charleston, SC 1,991,000 (162,000) (101,000) 63,000 11.0 10.0 39,000 37,000 Charlotte, NC 21,665,000 0 2,050,000 0 13.5 13.5 (4,000) 457,000 Chicago, IL 131,673,000 0 679,000 0 17.2 17.0 194,000 (95,000) Cincinnati, OH 11,920,000 0 0 805,000 17.8 18.4 (75,000) (131,000) Cleveland, OH 34,612,000 0 0 0 18.5 18.5 84,000 115,000 Columbia, SC 4,986,000 0 190,000 0 24.6 23.5 57,000 (30,000) Columbus, OH 12,465,000 0 0 0 17.5 17.7 3,000 42,000 Dallas/Fort Worth, TX 36,649,000 0 0 0 25.5 25.4 51,000 (323,000) Denver, CO 25,704,000 0 0 0 14.4 13.5 218,000 394,000 Detroit, MI 30,446,000 0 0 0 17.0 17.0 50,000 (449,000) Fresno, CA 3,263,000 0 58,000 0 10.9 11.4 (18,000) (25,000) Ft. Lauderdale/Broward Co., FL 8,222,000 0 13,000 0 14.5 15.7 (99,000) 227,000 Greenville, SC 3,125,000 0 53,000 0 18.9 18.9 (5,000) (58,000) Hartford, CT 9,637,000 0 0 180,000 22.6 22.9 (27,000) (270,000) Honolulu, HI 8,074,000 0 0 0 11.7 12.3 (55,000) (141,000) Houston, TX 37,514,000 0 0 1,817,000 14.7 14.9 (107,000) (593,000) Indianapolis, IN 22,910,000 0 0 0 10.8 11.0 (31,000) (290,000) Jacksonville, FL 16,172,000 0 0 0 14.1 13.9 56,000 101,000 Kansas City, MO-KS 18,769,000 0 0 0 17.8 17.1 128,000 (9,000) Las Vegas, NV 3,601,000 0 0 0 15.6 14.6 26,000 (138,000) Little Rock, AR 6,577,000 0 (49,000) 0 10.8 14.5 (247,000) (122,000) Los Angeles, CA 32,039,000 0 0 0 16.4 16.4 (15,000) (542,000) Louisville, KY 16,978,000 0 15,000 0 9.4 10.1 (112,000) (136,000) Memphis, TN 8,470,000 0 0 0 17.4 18.0 (52,000) (108,000) Miami-Dade County, FL 17,427,000 0 1,335,000 606,000 21.9 21.0 154,000 233,000 Nashville, TN 30,984,000 0 528,000 102,000 14.1 13.9 101,000 609,000 New York, NY – Downtown Manhattan 87,333,000 0 2,000,000 2,600,000 16.4 16.9 (369,000) (4,179,000) New York, NY – Midtown Manhattan 200,280,000 0 1,100,000 0 12.7 12.4 637,000 4,994,000 New York, NY – Midtown S. Manhattan 71,893,000 0 317,000 0 11.1 10.1 702,000 1,002,000 Oakland, CA 16,892,000 0 0 0 12.8 12.2 108,000 107,000 Orlando, FL 12,386,000 0 284,000 105,000 15.7 14.2 192,000 353,000 Philadelphia, PA 41,599,000 0 0 0 12.9 12.7 58,000 (238,000) Phoenix, AZ 19,368,000 0 769,000 0 21.3 22.0 (141,000) (635,000) Pleasanton/Walnut Creek, CA 12,110,000 0 0 0 16.9 16.9 (8,000) (16,000) Portland, OR 24,419,000 0 369,000 195,000 9.5 8.8 230,000 410,000 Raleigh/Durham/Chapel Hill, NC 10,918,000 0 0 165,000 5.1 4.6 56,000 257,000 Reno, NV 1,327,000 0 0 0 27.5 28.2 (9,000) (68,000) Sacramento, CA 18,247,000 0 18,000 155,000 9.0 9.1 (19,000) (110,000) San Diego County, CA 10,204,000 0 0 0 17.2 19.4 (220,000) (245,000) San Francisco, CA 83,434,000 210,000 320,000 288,000 14.9 14.8 326,000 292,000 San Jose/Silicon Valley, CA 7,593,000 0 0 0 25.0 22.0 198,000 42,000 Seattle/Puget Sound, WA 59,555,000 0 1,101,000 1,437,000 15.4 14.7 419,000 945,000 St. Louis, MO 24,931,000 0 0 0 23.9 19.2 103,000 863,000 Stamford, CT 18,557,000 140,000 140,000 0 17.8 18.4 23,000 (692,000) Stockton/San Joaquin County, CA 8,500,000 0 0 0 17.3 18.0 (55,000) 117,000 Tampa, FL 8,565,000 0 0 0 16.3 16.4 (14,000) 112,000 Washington, DC 138,367,000 0 3,489,000 1,625,000 11.7 11.1 930,000 3,785,000 West Palm Beach/Palm Beach Co., FL 9,773,000 0 0 0 19.8 19.9 (17,000) (66,000) White Plains, NY 8,262,000 0 0 0 11.2 12.6 (120,000) 122,000 U.S. TOTAL/AVERAGE 1,595,885,000 693,000 16,727,000 10,933,000 15.05 14.81 3,778,000 5,486,000 P. 2 | COLLIERS INTERNATIONAL
  • 3. HIGHLIGHTS | Q4 2010 | OFFICE | NORTH AMERICA UNITED STATES | DOWNTOWN OFFICE | CLASS A VACANCY VACANCY AVERAGE ANNUAL QUARTERLY ANNUAL EXISTING RATE (%) RATE (%) ABSORPTION ABSORPTION QUOTED RENT CHANGE CHANGE INVENTORY (SF) SEP. 30, DEC. 31, Q4 2010 YTD 2010 (USD PSF) IN RENT IN RENT MARKET DEC. 31, 2010 2010 2010 (SF) (SF) DEC. 31, 2010 (%) (%) Atlanta, GA 31,399,000 19.5 19.3 64,000 432,000 21.40 0.0 0.1 Bakersfield, CA 670,000 6.5 6.3 1,000 14,000 17.40 0.0 0.0 Baltimore, MD 9,811,000 18.5 18.2 27,000 (38,000) 23.00 -3.0 -6.0 Boise, ID 2,038,000 4.6 5.1 (10,000) 17,000 18.00 0.0 0.0 Boston, MA 41,168,000 15.3 15.7 259,000 (246,000) 46.00 1.0 -3.9 Charleston, SC 1,102,000 8.9 9.3 (10,000) (25,000) 28.70 2.6 0.0 Charlotte, NC 15,553,000 15.5 15.7 (25,000) 503,000 25.00 -2.5 -10.1 Chicago, IL 74,689,000 17.8 17.3 334,000 572,000 32.00 -1.5 0.0 Cincinnati, OH 5,996,000 18.7 19.0 (20,000) (50,000) 21.90 0.1 – Cleveland, OH 9,728,000 11.7 13.1 (137,000) (129,000) 20.40 -1.4 -1.1 Columbia, SC 2,194,000 15.4 14.1 (30,000) (64,000) 19.80 0.6 3.0 Columbus, OH 5,600,000 16.6 18.3 (94,000) (12,000) 19.30 -0.6 13.5 Dallas/Fort Worth, TX 22,612,000 23.6 23.1 101,000 (198,000) 25.20 0.0 -0.2 Denver, CO 18,085,000 13.2 12.1 195,000 567,000 27.00 2.9 -0.9 Detroit, MI 11,563,000 17.5 17.4 1,000 (283,000) 23.00 1.3 0.7 Fresno, CA 1,039,000 8.7 9.6 (9,000) 1,000 24.60 0.0 0.0 Ft. Lauderdale/Broward Co., FL 4,464,000 19.7 22.1 105,000 (119,000) 31.80 -1.7 -2.2 Greenville, SC 1,844,000 8.2 8.8 (11,000) 0 19.50 0.0 -3.8 Hartford, CT 6,369,000 22.1 22.7 (35,000) (313,000) 23.00 -0.6 -0.9 Honolulu, HI 4,709,000 11.8 12.2 (19,000) (48,000) 35.30 -0.9 -1.6 Houston, TX 26,670,000 10.1 10.4 (124,000) (559,000) 34.60 -1.6 -7.4 Indianapolis, IN 9,547,000 12.8 13.0 (21,000) (138,000) 19.20 – – Jacksonville, FL 6,654,000 16.3 15.2 21,000 46,000 18.90 -6.2 -7.8 Kansas City, MO-KS 5,167,000 26.8 24.5 122,000 173,000 17.10 -18.3 – Las Vegas, NV 700,000 12.4 10.1 16,000 (27,000) 34.60 -0.9 -4.0 Little Rock, AR 2,636,000 12.5 11.5 25,000 (3,000) 16.50 0.0 1.5 Los Angeles, CA 15,084,000 14.8 14.4 55,000 (354,000) 39.00 0.0 -0.6 Louisville, KY 4,217,000 8.5 9.5 (43,000) (62,000) 22.30 -2.0 11.8 Memphis, TN 1,938,000 23.8 26.4 (50,000) (74,000) 17.70 4.9 4.7 Miami-Dade County, FL 9,211,000 25.0 23.1 174,000 217,000 41.50 -0.6 -4.0 Nashville, TN 3,830,000 24.1 24.9 2,000 35,000 23.70 4.2 – New York, NY – Downtown Manhattan 58,670,000 20.1 21.1 (154,000) 1,624,000 39.70 -0.2 2.1 New York, NY – Midtown Manhattan 161,250,000 14.6 15.4 438,000 3,576,000 65.00 2.9 4.3 New York, NY – Midtown S. Manhattan 29,654,000 12.9 8.9 221,000 1,847,000 43.20 1.7 6.5 Oakland, CA 10,198,000 10.8 10.0 83,000 (7,000) 30.80 -0.8 -5.2 Orlando, FL 5,697,000 18.7 16.8 109,000 42,000 23.90 -0.9 -3.3 Philadelphia, PA 31,537,000 12.1 12.3 (47,000) (383,000) 26.10 0.3 1.3 Phoenix, AZ 9,663,000 22.9 22.8 4,000 (53,000) 28.20 -0.2 7.5 Pleasanton/Walnut Creek, CA 7,787,000 19.1 18.8 24,000 (33,000) 26.30 0.5 -2.2 Portland, OR 11,451,000 8.4 6.9 191,000 341,000 24.70 1.3 1.2 Raleigh/Durham/Chapel Hill, NC 4,020,000 4.7 5.3 76,000 108,000 23.20 1.7 -10.6 Reno, NV 548,000 19.3 19.7 (2,000) (12,000) 23.40 -0.5 5.4 Sacramento, CA 8,911,000 9.4 9.1 33,000 27,000 32.80 0.7 11.9 San Diego County, CA 6,976,000 15.9 16.9 (67,000) (34,000) 28.70 -2.0 -8.8 San Francisco, CA 52,333,000 15.1 15.2 119,000 (42,000) 36.00 -0.7 3.6 San Jose/Silicon Valley, CA 3,365,000 35.0 27.9 214,000 96,000 34.30 -1.0 -7.6 Seattle/Puget Sound, WA 30,761,000 19.5 18.8 325,000 1,137,000 30.50 6.8 17.3 St. Louis, MO 10,327,000 23.7 22.4 143,000 90,000 17.60 -7.5 -9.8 Stamford, CT 12,590,000 19.0 20.0 24,000 (613,000) 37.90 -6.8 – Stockton/San Joaquin County, CA 2,773,000 26.2 27.6 (38,000) 135,000 21.10 15.0 -2.2 Tampa, FL 4,809,000 18.4 18.5 (3,000) 92,000 22.90 0.4 0.1 Washington, DC 85,628,000 14.8 14.0 868,000 4,061,000 53.60 2.4 5.1 West Palm Beach/Palm Beach Co., FL 3,323,000 24.9 24.2 25,000 (34,000) 36.60 -0.8 -6.0 White Plains, NY 5,402,000 13.3 14.5 (64,000) 204,000 – -2.5 – U.S. TOTAL/AVERAGE 913,966,000 16.13 16.02 3,389,000 12,003,000 39.30 weighted 0.89 -1.78 28.20 equal -0.55 -1.04 COLLIERS INTERNATIONAL | P. 3
  • 4. HIGHLIGHTS | Q4 2010 | OFFICE | NORTH AMERICA UNITED STATES | SUBURBAN OFFICE | ALL INVENTORY EXISTING NEW SUPPLY NEW SUPPLY UNDER VACANCY VACANCY ABSORPTION ABSORPTION INVENTORY (SF) Q4 2010 YTD 2010 CONSTRUCTION RATE (%) RATE (%) Q4 2010 YTD 2010 MARKET DEC. 31, 2010 (SF) (SF) (SF) SEP. 30, 2010 DEC. 31, 2010 (SF) (SF) Atlanta, GA 191,564,000 123,000 1,156,000 207,000 17.7 17.6 318,000 418,000 Bakersfield, CA 5,968,000 0 0 0 10.6 9.8 48,000 108,000 Baltimore, MD 103,638,000 644,000 1,939,000 1,361,000 13.2 12.8 880,000 1,754,000 Boise, ID 10,655,000 0 164,000 0 21.0 22.6 (162,000) (302,000) Boston, MA 104,587,000 0 356,000 59,000 19.0 19.4 (492,000) 1,187,000 Charleston, SC 8,548,000 48,000 614,000 105,000 20.6 19.1 117,000 681,000 Charlotte, NC 70,649,000 158,000 258,000 350,000 14.5 14.2 348,000 654,000 Chicago, IL 104,146,000 0 314,000 0 23.9 23.1 780,000 559,000 Cincinnati, OH 25,530,000 132,000 419,000 213,000 24.9 24.3 239,000 (20,000) Cleveland, OH 91,767,000 77,000 160,000 332,000 10.2 10.2 197,000 283,000 Columbia, SC 4,872,000 0 0 0 20.5 19.3 57,000 (46,000) Columbus, OH 35,163,000 0 0 90,000 19.3 17.5 75,000 104,000 Dallas/Fort Worth, TX 266,520,000 578,000 2,163,000 0 17.3 16.8 1,618,000 2,486,000 Denver, CO 116,456,000 62,000 596,000 30,000 15.5 15.1 614,000 978,000 Detroit, MI 99,804,000 45,000 88,000 7,000 21.5 21.0 378,000 173,000 Fairfield County, CT 41,011,000 0 0 0 10.4 10.9 (147,000) (275,000) Fairfield, CA 3,708,000 0 0 0 26.5 26.6 (4,000) (124,000) Fresno, CA 17,821,000 0 147,000 0 15.1 13.5 278,000 369,000 Ft. Lauderdale/Broward Co., FL 43,670,000 0 171,000 0 14.8 14.7 58,000 369,000 Greenville, SC 4,291,000 0 0 14,000 23.5 23.3 7,000 (82,000) Hartford, CT 12,358,000 0 0 14,000 15.0 14.9 (6,000) (21,000) Honolulu, HI 7,663,000 0 0 0 11.5 11.2 (1,000) (87,000) Houston, TX 157,392,000 64,000 87,000 256,000 17.2 16.2 725,000 1,069,000 Indianapolis, IN 48,126,000 0 0 0 11.5 11.4 59,000 646,000 Jacksonville, FL 43,113,000 10,000 15,000 49,000 15.9 15.5 219,000 439,000 Kansas City, MO-KS 69,904,000 0 0 0 13.1 13.2 (66,000) (255,000) Las Vegas, NV 38,598,000 0 109,000 85,000 25.0 25.5 (201,000) (422,000) Little Rock, AR 7,437,000 0 (10,000) 23,000 10.6 10.9 (24,000) (223,000) Los Angeles – Inland Empire, CA 21,938,000 0 41,000 0 25.2 24.4 156,000 30,000 Los Angeles, CA 165,877,000 0 518,000 1,151,000 18.0 18.0 48,000 (2,181,000) Louisville, KY 35,164,000 4,000 247,000 0 12.9 17.8 118,000 (95,000) Memphis, TN 28,054,000 0 0 12,000 13.0 13.2 (44,000) 51,000 Miami-Dade County, FL 64,728,000 48,000 697,000 608,000 15.1 14.9 181,000 614,000 Nashville, TN 23,423,000 0 528,000 102,000 11.1 10.5 104,000 635,000 New Jersey – Central 65,849,000 259,000 305,000 265,000 22.2 21.2 649,000 112,000 New Jersey – Northern 95,670,000 0 0 383,000 18.5 18.4 (16,000) (579,000) Oakland, CA 15,877,000 0 0 62,000 17.2 17.4 127,000 155,000 Orange County, CA 77,351,000 0 0 0 22.4 22.0 243,000 (720,000) Orlando, FL 54,714,000 23,000 88,000 647,000 17.4 16.8 354,000 266,000 Philadelphia, PA 109,350,000 30,000 693,000 533,000 16.5 16.2 263,000 715,000 Phoenix, AZ 110,066,000 59,000 1,162,000 735,000 23.0 22.9 182,000 597,000 Pleasanton/Walnut Creek, CA 30,209,000 0 0 0 18.5 15.7 873,000 1,415,000 Portland, OR 44,180,000 0 252,000 0 12.9 12.0 193,000 85,000 Raleigh/Durham/Chapel Hill, NC 72,383,000 100,000 465,000 85,000 14.1 13.9 212,000 544,000 Reno, NV 5,526,000 0 0 7,000 21.4 19.5 107,000 97,000 Sacramento, CA 72,659,000 105,000 346,000 133,000 18.6 18.6 40,000 (140,000) San Diego County, CA 67,587,000 0 355,000 0 17.1 16.1 669,000 1,488,000 San Francisco Peninsula, CA 33,518,000 0 0 0 17.7 17.6 39,000 343,000 San Jose/Silicon Valley, CA 54,054,000 555,000 898,000 538,000 20.4 19.9 (360,000) (732,000) Seattle/Puget Sound, WA 68,753,000 0 772,000 431,000 15.4 15.7 (186,000) 6,000 St. Louis, MO 52,003,000 0 0 0 15.8 15.8 35,000 752,000 Tampa, FL 71,463,000 0 0 0 16.1 15.6 417,000 198,000 Washington, DC 309,348,000 0 1,725,000 2,198,000 14.3 13.6 489,000 1,942,000 West Palm Beach/Palm Beach Co., FL 29,168,000 0 51,000 272,000 21.3 20.7 172,000 175,000 Westchester County, NY 37,942,000 0 0 0 11.0 10.7 3,000 (30,000) U.S. TOTAL/AVERAGE 3,551,815,000 3,124,000 17,889,000 11,358,000 17.01 16.69 10,978,000 16,162,000 P. 4 | COLLIERS INTERNATIONAL
  • 5. HIGHLIGHTS | Q4 2010 | OFFICE | NORTH AMERICA UNITED STATES | SUBURBAN OFFICE | CLASS A VACANCY VACANCY AVERAGE ANNUAL QUARTERLY ANNUAL EXISTING RATE (%) RATE (%) ABSORPTION ABSORPTION QUOTED RENT CHANGE CHANGE INVENTORY (SF) SEP. 30, DEC. 31, Q4 2010 YTD 2010 (USD PSF) IN RENT IN RENT MARKET DEC. 31, 2010 2010 2010 (SF) (SF) DEC. 31, 2010 (%) (%) Atlanta, GA 81,300,000 18.5 18.3 214,000 549,000 21.50 -0.8 -2.5 Bakersfield, CA 2,691,000 6.9 6.5 13,000 44,000 24.00 0.0 0.0 Baltimore, MD 33,088,000 17.0 16.5 507,000 1,047,000 26.00 0.0 5.6 Boise, ID 4,608,000 22.2 24.5 (104,000) (127,000) 18.00 0.0 -1.4 Boston, MA 44,256,000 17.7 18.0 (144,000) 1,278,000 25.80 -1.6 3.2 Charleston, SC 4,395,000 14.3 15.3 (52,000) 444,000 23.50 0.0 4.4 Charlotte, NC 18,182,000 18.0 17.4 237,000 512,000 20.30 -0.4 1.5 Chicago, IL 57,508,000 25.3 24.0 728,000 630,000 27.30 -0.6 -0.9 Cincinnati, OH 13,530,000 24.8 24.4 158,000 (94,000) 20.40 0.0 – Cleveland, OH 12,761,000 12.3 12.3 72,000 (47,000) 22.00 1.4 2.0 Columbia, SC 888,000 20.5 16.3 38,000 56,000 17.00 0.2 -2.8 Columbus, OH 11,565,000 12.9 16.5 70,000 368,000 17.90 -1.7 -2.3 Dallas/Fort Worth, TX 96,288,000 18.6 16.9 855,000 1,130,000 24.80 0.0 -1.0 Denver, CO 34,856,000 16.0 15.0 388,000 809,000 20.80 0.0 -1.2 Detroit, MI 25,679,000 18.1 18.1 (36,000) (189,000) 22.20 0.2 -3.7 Fairfield County, CT 17,262,000 10.4 11.0 (80,000) (26,000) 34.70 0.6 – Fairfield, CA 2,102,000 30.7 30.6 1,000 (35,000) 25.90 -0.5 -0.9 Fresno, CA 3,820,000 21.8 18.0 145,000 304,000 25.20 0.0 0.0 Ft. Lauderdale/Broward Co., FL 10,774,000 20.0 19.9 11,000 47,000 27.90 -0.8 1.0 Greenville, SC 1,772,000 20.7 19.8 8,000 (49,000) 17.60 0.1 -1.0 Hartford, CT 7,466,000 15.8 14.7 57,000 35,000 20.30 -0.5 -2.5 Houston, TX 69,047,000 19.2 17.6 664,000 748,000 27.10 -0.7 -0.6 Indianapolis, IN 12,685,000 15.3 14.2 142,000 306,000 18.30 – – Jacksonville, FL 9,715,000 13.7 13.0 (68,000) 271,000 19.30 8.7 -3.4 Kansas City, MO-KS 17,435,000 15.6 16.6 (184,000) (162,000) 21.10 -1.6 – Las Vegas, NV 4,918,000 36.3 38.2 (66,000) (123,000) 32.30 -1.5 -6.6 Little Rock, AR 2,689,000 12.2 15.1 (76,000) (174,000) 18.50 0.0 1.5 Los Angeles – Inland Empire, CA 4,953,000 34.1 31.8 111,000 224,000 24.80 -1.4 -8.4 Los Angeles, CA 100,895,000 18.4 18.1 285,000 (1,571,000) 32.30 -5.9 -9.1 Louisville, KY 7,087,000 19.2 23.8 (96,000) 13,000 20.00 -0.8 11.9 Memphis, TN 7,132,000 9.4 10.3 (65,000) (92,000) 21.70 0.2 -0.4 Miami-Dade County, FL 15,267,000 21.9 21.2 106,000 463,000 32.10 -1.4 -1.2 Nashville, TN 12,805,000 8.9 7.8 55,000 371,000 22.30 11.7 – New Jersey – Central 46,472,000 24.6 22.7 842,000 127,000 23.30 -1.4 -10.8 New Jersey – Northern 63,264,000 18.2 18.3 (153,000) (552,000) 24.40 0.6 -14.0 Oakland, CA 3,582,000 32.3 26.8 (27,000) (230,000) 25.70 4.9 -0.9 Orange County, CA 33,319,000 24.0 23.5 164,000 (161,000) 26.20 -1.8 -11.4 Orlando, FL 16,856,000 21.1 20.0 199,000 (300,000) 22.90 0.4 -2.1 Philadelphia, PA 67,868,000 16.5 16.1 249,000 226,000 24.00 -0.9 -1.4 Phoenix, AZ 31,497,000 26.8 26.1 198,000 481,000 23.90 -1.9 -5.6 Pleasanton/Walnut Creek, CA 16,340,000 14.3 14.8 (87,000) 7,000 23.60 4.8 -6.2 Portland, OR 12,537,000 12.2 11.3 80,000 (135,000) 23.20 0.0 1.5 Raleigh/Durham/Chapel Hill, NC 25,327,000 17.6 33.8 134,000 523,000 21.60 0.3 4.6 Reno, NV 2,939,000 19.5 17.6 55,000 109,000 19.90 1.2 -7.8 Sacramento, CA 16,297,000 25.6 26.0 16,000 (93,000) 23.80 -1.9 -5.6 San Diego County, CA 24,297,000 19.1 17.1 509,000 1,405,000 31.80 -0.4 -8.0 San Francisco Peninsula, CA 21,785,000 12.2 12.2 9,000 359,000 32.20 3.1 -3.9 San Jose/Silicon Valley, CA 26,212,000 24.0 23.4 (392,000) (135,000) 34.70 -2.7 -3.5 Seattle/Puget Sound, WA 22,148,000 17.9 19.8 478,000 (198,000) 28.40 -1.4 3.5 St. Louis, MO 25,041,000 18.1 18.7 8,000 260,000 21.70 -7.0 -6.6 Tampa, FL 23,501,000 17.3 16.7 121,000 131,000 23.30 -1.1 -4.8 Washington, DC 161,629,000 16.2 15.6 696,000 2,068,000 31.30 1.5 – West Palm Beach/Palm Beach Co., FL 9,174,000 20.4 20.3 (25,000) 29,000 30.10 -0.9 -1.2 Westchester County, NY 18,316,000 14.5 13.5 43,000 196,000 27.20 -2.0 – U.S. TOTAL/AVERAGE 1,417,823,000 18.55 18.34 7,012,000 11,075,000 26.00 weighted -0.93 -2.85 24.40 equal -0.69 -2.32 COLLIERS INTERNATIONAL | P. 5
  • 6. HIGHLIGHTS | Q4 2010 | OFFICE | NORTH AMERICA CANADA | DOWNTOWN OFFICE | ALL INVENTORY EXISTING NEW SUPPLY NEW SUPPLY UNDER VACANCY VACANCY ABSORPTION ABSORPTION INVENTORY (SF) Q4 2010 YTD 2010 CONSTRUCTION RATE (%) RATE (%) Q4 2010 YTD 2010 MARKET DEC. 31, 2010 (SF) (SF) (SF) SEP. 30, 2010 DEC. 31, 2010 (SF) (SF) Calgary, AB 37,777,000 0 2,261,000 1,940,000 13.8 12.0 676,000 1,872,000 Edmonton, AB 10,632,000 0 0 630,000 7.5 8.0 (59,000) (129,000) Halifax, NS 4,913,000 0 22,000 10,000 6.4 9.2 0 (26,000) Kitchener-Waterloo, ON 2,376,000 0 165,000 0 20.6 21.3 (15,000) 89,000 Montreal, QC 49,429,000 0 0 0 7.4 6.9 251,000 96,000 Ottawa, ON 14,992,000 0 0 550,000 4.0 5.6 (239,000) (233,000) Regina, SK 3,515,000 0 0 190,000 1.4 1.4 0 (3,000) Saskatoon, SK 2,072,000 20,000 30,000 100,000 5.8 6.0 15,000 29,000 Toronto, ON 88,790,000 226,000 888,000 2,346,000 5.5 5.3 848,000 1,762,000 Vancouver, BC 24,466,000 0 0 127,000 4.4 4.6 (46,000) 21,000 Victoria, BC 4,910,000 224,000 233,000 0 4.0 8.4 97,000 7,000 Winnipeg, MB 14,888,000 0 26,000 0 8.0 8.0 0 3,000 CANADA TOTAL/AVERAGE 258,760,000 470,000 3,625,000 5,893,000 7.16 7.02 1,530,000 3,488,000 CANADA | DOWNTOWN OFFICE | CLASS A VACANCY VACANCY AVERAGE ANNUAL QUARTERLY ANNUAL EXISTING RATE (%) RATE (%) ABSORPTION ABSORPTION QUOTED RENT CHANGE CHANGE INVENTORY (SF) SEP. 30, DEC. 31, Q4 2010 YTD 2010 (CAD PSF) IN RENT IN RENT MARKET DEC. 31, 2010 2010 2010 (SF) (SF) DEC. 31, 2010 (%) (%) Calgary, AB 24,783,000 12.4 9.8 638,000 2,134,000 39.50 0.0 -6.0 Edmonton, AB 8,254,000 7.0 7.2 (19,000) (120,000) 38.50 -3.6 -11.3 Halifax, NS 1,916,000 6.6 4.7 (27,000) (63,000) 31.60 0.0 0.3 Kitchener-Waterloo, ON 795,000 16.3 18.0 (13,000) 125,000 24.80 -9.9 -6.5 Montreal, QC 23,076,000 7.6 7.0 131,000 31,000 35.00 9.4 13.9 Ottawa, ON 9,001,000 3.9 6.6 (250,000) (246,000) 48.30 0.0 -2.4 Regina, SK 1,031,000 1.0 1.1 4,000 (6,000) 34.90 0.5 0.5 Saskatoon, SK 492,000 0.2 0.2 0 34,000 34.00 7.9 7.9 Toronto, ON 41,588,000 6.8 6.7 744,000 1,395,000 55.62 3.2 0.7 Vancouver, BC 10,034,000 2.6 2.8 (17,000) 43,000 53.00 -2.8 12.8 Victoria, BC 821,000 8.6 16.6 139,000 122,000 37.00 0.0 0.0 Winnipeg, MB 2,619,000 6.6 6.6 0 27,000 30.00 – – CANADA TOTAL/AVERAGE 124,409,000 7.51 7.11 1,329,000 3,475,000 43.80 weighted 1.26 -0.31 38.20 equal 0.36 0.68 CANADA | SUBURBAN OFFICE | ALL INVENTORY EXISTING NEW SUPPLY NEW SUPPLY UNDER VACANCY VACANCY ABSORPTION ABSORPTION INVENTORY (SF) Q4 2010 YTD 2010 CONSTRUCTION RATE (%) RATE (%) Q4 2010 YTD 2010 MARKET DEC. 31, 2010 (SF) (SF) (SF) SEP. 30, 2010 DEC. 31, 2010 (SF) (SF) Calgary, AB 23,302,000 0 186,000 606,000 11.5 10.9 134,000 531,000 Edmonton, AB 8,808,000 27,000 27,000 0 7.6 15.5 19,000 (184,000) Halifax, NS 6,197,000 108,000 161,000 30,000 11.0 11.0 127,000 446,000 Kitchener-Waterloo, ON 3,286,000 0 16,000 486,000 12.5 10.4 100,000 204,000 Montreal, QC 23,621,000 0 191,000 112,000 9.7 9.7 (2,000) 35,000 Ottawa, ON 20,559,000 0 0 182,000 7.1 7.5 (75,000) 1,172,000 Regina, SK 659,000 0 12,000 0 0.6 0.6 0 (3,000) Toronto, ON 97,513,000 0 983,000 0 7.5 6.6 471,000 1,646,000 Vancouver, BC 28,649,000 0 395,000 781,000 10.2 10.2 84,000 123,000 Victoria, BC 3,573,000 48,000 108,000 130,000 6.7 10.2 (81,000) (78,000) Winnipeg, MB 3,150,000 0 (9,000) 0 11.9 11.9 0 (3,000) CANADA TOTAL/AVERAGE 219,318,000 183,000 2,071,000 2,326,000 8.69 8.61 777,000 3,889,000 CANADA | SUBURBAN OFFICE | CLASS A VACANCY VACANCY AVERAGE ANNUAL QUARTERLY ANNUAL EXISTING RATE (%) RATE (%) ABSORPTION ABSORPTION QUOTED RENT CHANGE CHANGE INVENTORY (SF) SEP. 30, DEC. 31, Q4 2010 YTD 2010 (CAD PSF) IN RENT IN RENT MARKET DEC. 31, 2010 2010 2010 (SF) (SF) DEC. 31, 2010 (%) (%) Calgary, AB 10,609,000 12.4 11.6 80,000 327,000 35.00 7.7 29.6 Halifax, NS 8,026,000 4.0 8.5 32,000 351,000 26.70 0.0 -1.8 Kitchener-Waterloo, ON 1,448,000 15.3 12.4 41,000 113,000 23.70 -8.7 -9.8 Montreal, QC 13,226,000 8.4 8.4 (3,000) 43,000 26.00 8.3 5.1 Ottawa, ON 1,156,000 78.7 74.3 52,000 676,000 32.00 6.4 9.2 Regina, SK 659,000 0.6 0.6 0 (3,000) 28.50 16.3 15.9 Toronto, ON 42,732,000 7.5 6.9 263,000 1,250,000 30.50 -3.4 7.6 Vancouver, BC 13,590,000 12.5 12.4 90,000 233,000 38.00 3.6 -9.0 Victoria, BC 817,000 3.3 8.7 3,000 47,000 41.50 25.8 25.8 CANADA TOTAL/AVERAGE 92,263,000 9.55 9.49 558,000 3,035,000 31.20 weighted 0.63 12.06 30.80 equal 3.71 5.43 P. 6 | COLLIERS INTERNATIONAL
  • 7. HIGHLIGHTS | Q4 2010 | OFFICE | NORTH AMERICA UNITED STATES | OFFICE INVESTMENT Office Markets Look and Feel a Lot Better— But Higher Rents Still Some Way Off CBD CBD SUBURBAN SUBURBAN SALES PRICE CAP RATE SALES PRICE CAP RATE MARKET (USD PSF) (%) (USD PSF) (%) Continued from page 1 Atlanta, GA 81.00 8.66 157.00 9.15 quarter at 16.11 percent, almost certainly marking the be- Bakersfield, CA – – 116.00 – ginning of a long decline in vacancy. During the fourth Boston, MA 540.00 6.50 – – Charleston, SC 250.00 8.00 135.00 11.00 quarter, downtown vacancies decreased 23 basis points to Charlotte, NC – – – – register 14.81 percent, while suburban vacancy rates Chicago, IL 220.00 7.25 120.00 8.00 staged a slightly larger decrease, falling 32 basis points to Cincinnati, OH – – 168.00 – register 16.69 percent. For the year, the U.S. national office Columbus, OH 98.00 8.50 135.00 – vacancy rate fell 12 basis points after peaking in the third Dallas/Fort Worth, TX – – 180.00 7.00 quarter. Canadian office vacancy rates were also down Denver, CO 210.00 7.80 155.00 8.40 during the quarter, with central business district (CBD) Fairfield County, CT – – 250.00 8.00 vacancies falling 14 basis points to 7.02 percent while sub- Fresno, CA 160.00 9.00 160.00 8.50 Ft. Lauderdale/Broward Co., FL 283.63 6.40 142.23 9.80 urban vacancies decreased 8 basis points to 8.61 percent. Honolulu, HI – – 226.00 6.50 Houston, TX 191.50 7.50 139.50 8.00 Office occupancies up for a third consecutive quarter. Jacksonville, FL 85.00 9.25 120.00 8.75 The most positive sign U.S. office markets are getting back Las Vegas, NV – – 122.71 – on their feet is the third quarterly increase in occupied Little Rock, AR 88.00 9.50 110.00 9.25 space. Fourth quarter absorption came in at 14.8 MSF Los Angeles – Inland Empire, CA – – 230.00 – (million square feet) which was a substantial increase Los Angeles, CA 332.00 6.00 280.00 8.00 from the third quarter when occupied space increased by Miami-Dade County, FL 175.55 5.75 166.02 – 7.0 MSF. This brought full year absorption to 21.6 MSF, a Nashville, TN – – 60.70 – New York, NY – Downtown Manhattan 89.00 6.90 – – considerable improvement from 2009 when occupied New York, NY – Midtown Manhattan 675.00 5.00 – – space shrank by 54.4 MSF. Examining fourth quarter ab- New York, NY – Midtown S. Manhattan 542.00 5.00 – – sorption in detail shows 70 percent of newly occupied Oakland, CA – 8.00 – 9.00 space was in Class A buildings, highlighting the continued Orange County, CA – – 155.00 8.50 move to quality by many tenants. Canadian markets also Orlando, FL – – 160.31 9.10 recorded an increase in occupied space during the fourth Philadelphia, PA 112.00 9.00 117.00 9.00 quarter with absorption totaling 2.3 MSF. For the year, Phoenix, AZ 212.00 – 92.00 8.25 Canadian office absorption totaled 7.4 MSF, compared Pleasanton/Walnut Creek, CA 112.50 8.00 87.50 8.50 with -1.1 MSF in 2009. Portland, OR 179.75 7.20 149.65 8.40 Sacramento, CA 180.00 8.10 134.44 8.30 San Diego County, CA 111.49 – 174.80 8.45 Rent picture again mixed. Fourth quarter data shows CBD San Francisco Peninsula, CA – – 250.00 6.50 rents increased a further 0.9 percent to average $39.30 San Francisco, CA 314.00 6.20 – – per square foot, while suburban rents fell by a similar per- Seattle/Puget Sound, WA 161.30 6.00 395.92 6.70 centage to register $26.00 per square foot. Taking out the St. Louis, MO 100.00 9.00 127.00 8.50 effects of some of the larger, higher-priced markets, both Stamford, CT 350.00 8.00 – – downtown and suburban rents fell during the quarter, fall- Stockton/San Joaquin County, CA 130.00 8.50 – – ing 0.6 and 0.7 percent respectively. On a weighted basis, Tampa, FL – – 103.26 10.00 Washington, DC 688.77 – – – downtown rents fell 1.8 percent over the year while subur- West Palm Beach/Palm Beach Co., FL – – 213.00 – ban rents dropped 2.9 percent during 2010. Canadian Westchester County, NY – – 250.00 8.00 downtown office rents moved higher during the quarter White Plains, NY 350.00 8.00 – – with CBD quoted rents increasing 1.3 percent, while sub- urban rents increased 0.6 percent. CANADA | OFFICE INVESTMENT Office construction slows to a trickle. Fourth quarter of- CBD CBD SUBURBAN SUBURBAN fice completions totaled just 3.8 MSF, the lowest total on SALES PRICE CAP RATE SALES PRICE CAP RATE record, and a further decrease from the third quarter when MARKET (CAD PSF) (%) (CAD PSF) (%) construction totaled 5.5 MSF. Going forward, office devel- Calgary, AB 340.00 6.50 335.00 7.25 Edmonton, AB 275.09 6.42 – – opment will remain extremely subdued, reflected by con- Kitchener-Waterloo, ON 160.00 8.00 110.00 7.75 struction activity which registered just 22.3 MSF at the Montreal, QC 275.00 7.00 190.00 7.75 end of the quarter. A year ago, construction underway Ottawa, ON 270.00 7.25 145.00 7.60 registered 46.0 MSF. Completions may be in the process Regina, SK 213.00 7.45 – – of bottoming out, but no sharp reversal is expected any- Saskatoon, SK 240.00 7.20 – – time soon. The Canadian office market also had very little Toronto, ON 244.00 – 174.00 – new construction during the fourth quarter; however, Vancouver, BC 400.00 5.75 300.00 6.50 downtown Toronto and Calgary had over 5.0 MSF under Victoria, BC 325.00 6.33 290.00 6.75 Winnipeg, MB 155.00 7.75 135.00 7.75 construction at year-end. COLLIERS INTERNATIONAL | P. 7
  • 8. HIGHLIGHTS | Q4 2010 | OFFICE | NORTH AMERICA 480 offices in 61 countries on 6 continents United States: 135 Canada: 39 Latin America: 17 Asia Pacific: 194 EMEA: 95 • $1.9 billion in annual revenue • 2.4 billion square feet under management • Over 15,000 professionals COLLIERS INTERNATIONAL 601 Union Street, Suite 4800 Seattle, WA 98101 TEL +1 206 695 4200 FOR MORE INFORMATION Ross J. Moore Chief Economist | USA TEL +1 617 722 0221 EMAIL ross.moore@colliers.com Phoenix, Arizona Copyright © 2011 Colliers International. Glossary The information contained herein has been obtained from sources deemed reliable. While every reasonable effort has been made to ensure its accuracy, we cannot guarantee it. No responsibility is assumed for any Inventory – Includes all existing multi- or Annual Quoted Rent – Includes all costs associ- inaccuracies. Readers are encouraged to consult their single-tenant leased and owner-occupied office ated with occupying a full floor in the mid-rise professional advisors prior to acting on any of the material contained in this report. properties greater than or equal to 10,000 square portion of a Class A building inclusive of taxes, feet (net rentable area). In some larger markets insurance, maintenance, janitorial and utilities this minimum size threshold may vary up to (electricity surcharges added where applicable). 50,000 square feet. Does not include medical or All office rents in this report are quoted on an government buildings. annual, gross per square foot basis. Rent calcula- tions do not include sublease space. Vacancy Rate – Percentage of total inventory physically vacant as at the survey date including Cap Rate – (Or going-in cap rate) Capitalization direct vacant and sublease space. rates in this survey are based on multi-tenant institutional grade buildings fully leased at market Absorption – Net change in physically occupied rents. Cap rates are calculated by dividing net space over a given period of time. operating income (NOI) by purchase price. New Supply – Includes completed speculative Note: SF = square feet and build-to-suit construction. New supply PSF = per square foot quoted on a net basis after any demolitions or CBD = central business district conversions. Accelerating success. WWW.COLLIERS.COM