Q4 2014 San Francisco Office Report
•
1 j'aime•499 vues

The document summarizes the Q4 2014 office market report for San Francisco. Key points include: - The vacancy rate remained flat at 7.5% due to new construction, though it has decreased 51% since 2010. - Leasing activity was strong with 1.5 million sq ft leased in Q4 and a total of 8.1 million sq ft for the year, exceeding the annual average. - The market posted its 18th consecutive quarter of positive absorption, with over 257,000 sq ft absorbed in Q4 and over 2.8 million sq ft for the year. - Average rents increased to $64.79 per sq ft, a 16.2% increase over the previous

Recommandé
Recommandé
Contenu connexe
Tendances
Tendances (20)
En vedette
En vedette (20)
Similaire à Q4 2014 San Francisco Office Report
Similaire à Q4 2014 San Francisco Office Report (20)
Plus de Coy Davidson
Plus de Coy Davidson (20)
Dernier
Dernier (20)
Q4 2014 San Francisco Office Report
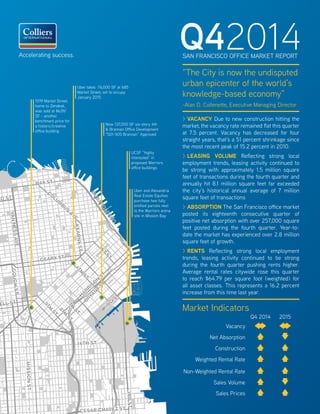
- 1. Q42014SAN FRANCISCO OFFICE MARKET REPORTAccelerating success. > VACANCY Due to new construction hitting the market, the vacancy rate remained flat this quarter at 7.5 percent. Vacancy has decreased for four straight years, that’s a 51 percent shrinkage since the most recent peak of 15.2 percent in 2010. > LEASING VOLUME Reflecting strong local employment trends, leasing activity continued to be strong with approximately 1.5 million square feet of transactions during the fourth quarter and annually hit 8.1 million square feet far exceeded the city’s historical annual average of 7 million square feet of transactions > ABSORPTION The San Francisco office market posted its eighteenth consecutive quarter of positive net absorption with over 257,000 square feet posted during the fourth quarter. Year-to- date the market has experienced over 2.8 million square feet of growth. > RENTS Reflecting strong local employment trends, leasing activity continued to be strong during the fourth quarter pushing rents higher. Average rental rates citywide rose this quarter to reach $64.79 per square foot (weighted) for all asset classes. This represents a 16.2 percent increase from this time last year. “The City is now the undisputed urban epicenter of the world’s knowledge-based economy” -Alan D. Collenette, Executive Managing Director Market Indicators Vacancy Q4 2014 2015 Net Absorption Construction Weighted Rental Rate Non-Weighted Rental Rate Sales Volume Sales Prices ELL ST BAY ST BRYAN T ST H ARRISO N ST 4TH ST GEARY ST GOUGHST VANNESSAVE EM BARCADERO 9TH ST CO LUM BUS AVE RD ST 1ST ST KEARNYST CESAR CHAVEZ ST 3RDST KIN G ST 8TH ST7TH ST MISSIONST 16TH ST Uber takes 76,000 SF at 685 Market Street, set to occupy January 2015 New 137,000 SF six-story 4th & Brannan Office Development “501-505 Brannan” Approved UCSF “highly interested” in proposed Warriors office buildings Uber and Alexandria Real Estate Equities purchase two fully entitled parcels next to the Warriors arena site in Mission Bay 1019 Market Street, home to Zendesk, was sold at $639/ SF - another benchmark price for a historic/creative office building
- 2. 4Q '14 Overall 4Q '14 Direct 4Q '14 Sublease 3Q '14 Overall QoQ % Change All Markets: Class A $67.91 $68.47 $58.90 $66.21 2.6% All Markets: Class B $57.53 $59.60 $41.00 $58.31 -1.3% Financial District: Class A $72.44 $72.44 - $66.52 8.9% Financial District: Class B $56.67 $59.33 $39.97 $48.97 15.7% SOMA Overall $65.61 $66.38 $61.89 $66.46 -1.3% RENTAL RATES Weighted average rents for the Financial District assets reflected a 6.8 percent increase for the quarter to $69.11 per square foot and annualized rents climbed up 18.5 percent. Overall weighted annualized rents in the SOMA market surged up 37.2 percent to $65.61 per square foot this year. Weighted Class B rents softened slightly this quarter, decreasing by 1.3 percent to $57.53 per square foot, annually they are up 20.4 percent. ABSORPTION & VACANCY The South Financial District and Potrero East submarkets experienced the largest occupancy growth realizing 148,453 and 99,930 square feet of positive absorption, respectively. DocuSign, SocialChorus, and Sift Science collectively moved into nearly 42,000 square feet of sublease space at 123 Mission Street. A couple of key contributors to the positive net absorption in Potrero East were Invuity moving into over 38,000 square feet at 444 De Haro Street as well as Dot & Bo occupying over 21,000 square feet at 200 Kansas Street. INVESTMENT VOLUME Demand for assets in the San Francisco market from both domestic and foreign capital sources continued to be voracious during the fourth quarter. There were a total of 14 office transactions closed this quarter for a combined value of nearly $1.9 billion. This year there were 50 office sales closed for a total of over $5 billion. In comparison, 2013 experienced 45 office sales closed for a total value of $2.38 billion. 0.0% 5.0% 10.0% 15.0% 20.0% -800,000 -300,000 200,000 700,000 1,200,000 1,700,000 2Q'05 3Q'05 4Q'05 1Q'06 2Q'06 3Q'06 4Q'06 1Q'07 2Q'07 3Q'07 4Q'07 1Q'08 2Q'08 3Q'08 4Q'08 1Q'09 2Q'09 3Q'09 4Q'09 1Q'10 2Q'10 3Q'10 4Q'10 1Q'11 2Q'11 3Q'11 4Q'11 1Q'12 2Q'12 3Q'12 4Q'12 1Q'13 2Q'13 3Q'13 4Q'13 1Q'14 2Q'14 3Q'14 4Q'14 Vacancy Net Absorption P.2 | RESEARCH & FORECAST REPORT Note: Weighted Average Rents Source: Colliers International Source: Colliers International 18 Straight Quarters of Positive Absorption and Declining Vacancy $1.9 $0.4 $0.1 $0.3 $0.5 $1.8 $3.5 $3.2 $9.8 $0.7 $0.3 $1.5 $2.8 $6.0 $2.4 $5.0 32 14 10 17 25 57 38 68 18 8 17 53 68 45 50 $- $1.0 $2.0 $3.0 $4.0 $5.0 $6.0 $7.0 $8.0 $9.0 $10.0 0 10 20 30 40 50 60 70 80 2000 2001 2002 2003 2004 2005 2006 2007 2008 2009 2010 2011 2012 2013 2014 San Francisco Sales Activity (Billions) # Transactions 2014 Sales Volume 64% Higher than Peak of Dot Com Boom, 2000
- 3. TENANT DEMAND Tenant demand remains strong for space in San Francisco with over 5.4 million square feet of office space requirements involving 137 tenants in the market and fourteen of those tenant requirements are looking for over 100,000 square feet. The core of this demand is driven from technology tenant requirements, which account for 36 percent or 1.9 million square feet of the requirement in the market. Q4 2014 | OFFICE | SAN FRANCISCO | P.3 UPDATE - LEASE AND INVESTMENT TRANSACTIONS SIGNIFICANT LEASES Q4 2014 ADDRESS TENANT SIZE TYPE SIGNED DATE CLASS 555 California Street Kirkland & Ellis 125,000 Renewal/Expansion Oct-14 A 651 Brannan Street Pinterest 120,113 New Oct-14 B 55 Hawthorne Street Yelp 102,324 New Oct-14 A 535 Mission Street WeWork 91,000 New Dec-14 A 201 Third Street Capital One 88,353 New Nov-14 A 685 Market Street Uber 77,644 New Oct-14 B 101 California Street Deutsche Bank 51,322 Renewal/Downsize Oct-14 A SIGNIFICANT SALES Q4 2014 ADDRESS SELLER BUYER SQ. FT. SALE DATE CLASS SALE PRICE PRICE/SF or FAR 50 Beale Street The Rockefeller Group/Mitsubishi The Paramount Group 663,441 Sep-14 A $395,000,000 $595 Foundry Square II - 405 Howard Street GE Capital/Langley Investments TIAA-CREF/Norges Bank 521,555 Sep-14 A $390,000,000 $748 650 California Street PREI/Tishman Speyer Columbia Property Trust 492,132 Sep-14 A $309,000,000 $628 600 California Street Clarion Partners/OregonSTRS Bentall Kennedy 358,590 Nov-14 A $216,500,000 $604 100 California Street ECP/PCCP/Broadway Partners Pembroke Real Estate 288,619 Sep-14 A $182,250,000 $631 201 California Street ARES/USAA Cornerstone Advisors 239,342 Oct-14 A $130,000,000 $543 235 Pine Street TA Associates Realty CBRE Investors 150,159 Sep-14 A $88,800,000 $591 300 California Street Kennedy Wilson The LeFrak Organization 120,566 Sep-14 B $58,250,000 $483 1019-1021 Market Street Cannae Partners/Westport Capital Deutsche Asset & Wealth Management 75,523 Oct-14 B $48,250,000 $639 Source: Colliers International Other 32% FIRE 13% Tech Related 36% Business Services 19% If all of these stated tenant requirements were fulfilled, this would equate to net absorption of approximately 2.0 million square feet.
- 4. Accelerating success. www.colliers.com DEVELOPMENT PIPELINE Only 535 Mission Street completed construction this quarter adding an additional 307,235 square feet to the market. Year-to-date 1,557,396 square feet of new and renovated completed space was added to the market. Currently there’s 5.2 million square feet under construction and approximately 64 percent or 3.3 million square feet is pre-leased. Currently there’s another 12.6 million square feet either proposed or in various stages of planning. LEASING ACTIVITY The San Francisco market has experienced fourteen leases over 100,000 square feet in 2014 with three of those signed during the fourth quarter. Kirkland & Ellis renewed and expanded for 125,000 square feet at 555 California Street, Pinterest leased over 120,000 square feet at 651 Brannan Street and Yelp is taking 102,113 square feet at 55 Hawthorne Street. This eclipsed the thirteen leases over 100,000 square feet closed in 2012. DOWNTOWN MARKET: A 177 57,806,721 4,542,921 7.9% 276,001 0.5% 4,818,922 52,987,799 8.3% 7.9% 14,821 1,972,195 307,235 1,483,261 4,510,750 12,502,808 B 296 24,901,722 1,471,556 5.9% 127,401 0.5% 1,598,957 23,302,765 6.4% 7.4% 234,359 740,053 - 74,135 651,149 140,235 C 133 6,871,862 284,428 4.1% 7,906 0.1% 292,334 6,579,528 4.3% 4.4% 8,263 88,021 - - - - Total 606 89,580,305 6,298,905 7.0% 411,308 0.5% 6,710,213 82,870,092 7.5% 7.5% 257,443 2,800,269 307,235 1,557,396 5,161,899 12,643,043 FINANCIAL DISTRICT: A 106 43,448,284 3,366,137 7.7% 190,785 0.4% 3,556,922 39,891,362 8.2% 7.7% 66,483 556,935 307,235 599,647 3,054,958 1,935,000 B 73 8,145,794 504,928 6.2% 47,169 0.6% 552,097 7,593,697 6.8% 7.2% 34,936 153,180 - - - 60,000 C 36 1,640,936 120,878 7.4% 1,400 0.1% 122,278 1,518,658 7.5% 6.6% 1,400 (1,400) - - - Total 215 53,235,014 3,991,943 7.5% 239,354 0.4% 4,231,297 49,003,717 7.9% 7.6% 86,774 696,509 307,235 599,647 3,054,958 1,995,000 SUBMARKETS: North Financial 116 28,405,524 2,137,679 7.5% 160,053 0.6% 2,297,732 26,107,792 8.1% 7.9% (61,679) 5,892 - - 2,682,958 60,000 South Financial 99 24,829,490 1,854,264 7.5% 79,301 0.3% 1,933,565 22,895,925 7.8% 7.2% 148,453 690,617 307,235 599,647 372,000 1,935,000 Total 215 53,235,014 3,991,943 7.5% 239,354 0.4% 4,231,297 49,003,717 7.9% 7.6% 86,774 696,509 307,235 599,647 3,054,958 1,995,000 Union Square 60 4,150,158 157,375 3.8% 16,284 0.4% 173,659 3,976,499 4.2% 3.5% (26,585) 71,356 - - - - Yerba Buena 33 4,769,373 267,853 5.6% 28,236 0.6% 296,089 4,473,284 6.2% 6.1% (4,577) 872,613 - 883,614 253,000 1,045,000 SOMA West 41 3,468,914 155,310 4.5% 29,343 0.8% 184,653 3,284,261 5.3% 5.6% 9,770 50,174 - - 55,000 1,865,456 SOMA East 57 5,273,935 294,749 5.6% 55,633 1.1% 350,382 4,923,553 6.6% 5.1% (81,097) 93,096 - 74,135 1,131,433 80,235 Civic Center/Mid-Market 47 6,866,279 962,310 14.0% 3,225 0.0% 965,535 5,900,744 14.1% 15.1% 71,797 390,704 - - 270,000 - Jackson Square 41 2,366,930 117,916 5.0% 2,467 0.1% 120,383 2,246,547 5.1% 7.4% 54,308 30,586 - - - - North Waterfront 48 3,664,375 184,495 5.0% 24,787 0.7% 209,282 3,455,093 5.7% 6.4% 24,235 33,191 - - - - Van Ness Corridor 21 1,233,094 84,438 6.8% - 0.0% 84,438 1,148,656 6.8% 5.5% (16,314) (1,526) - - - - Potrero West 18 1,339,348 29,234 2.2% - 0.0% 29,234 1,310,114 2.2% 4.2% 27,370 7,846 - - - - Potrero East 11 864,650 41,173 4.8% 11,979 1.4% 53,152 811,498 6.1% 17.6% 99,390 158,132 - - - 400,000 Mission Bay 14 2,348,235 12,109 0.5% - 0.0% 12,109 2,336,126 0.5% 1.0% 12,372 397,588 - - 397,508 7,257,352 Total 606 89,580,305 6,298,905 7.0% 411,308 0.5% 6,710,213 82,870,092 7.5% 7.5% 257,443 2,800,269 307,235 1,557,396 5,161,899 12,643,043 QUARTERLY COMPARISON AND TOTALS Q3-14 606 89,303,236 5,997,997 6.7% 662,424 0.7% 6,660,421 82,642,815 7.5% 8.3% 781,565 2,554,546 55,756 1,250,161 4,965,035 13,070,043 Q2-14 605 89,213,545 6,771,446 7.6% 614,784 0.7% 7,386,230 81,827,315 8.3% 9.4% 1,442,981 1,772,981 425,993 1,194,405 4,990,366 11,119,347 Q1-14 603 88,787,552 7,959,561 9.0% 428,019 0.5% 8,387,580 80,399,972 9.4% 9.0% 345,638 345,638 768,412 768,412 5,381,410 10,527,063 Q4-13 603 88,119,140 7,589,242 8.6% 355,948 0.4% 7,945,190 80,173,950 9.0% 9.0% 666,833 2,143,390 - 681,982 4,166,889 11,594,808 Q3-13 603 88,119,140 8,290,559 9.4% 323,897 0.4% 8,614,456 79,504,684 9.8% 9.8% 395,484 1,474,124 281,982 681,982 4,155,920 11,559,180 Class #ofBuildings TotalInventory (squarefeet) DirectVacant (squarefeet) Direct VacancyRate SubleaseVacant (squarefeet) Sublease VacancyRate TotalVacant (squarefeet) OccupiedSpace (squarefeet) VacancyRate CurrentPeriod VacancyRate PriorPeriod CurrentNet Absorption YTDNet Absorption NetNewSupply Current (squarefeet) NetNewSupply YTD Under Construction (squarefeet) Proposed (squarefeet) Existing Properties Absorption New Supply U/C & Proposed Alan D. Collenette, MRICS Executive Regional Managing Director 50 California Street, 19th Floor San Francisco, CA 94111 tel +1 415 288 7850 This document/email has been prepared by Colliers International for advertising and general information only. Colliers International makes no guarantees, representations or warranties of any kind, expressed or implied, regarding the information including, but not limited to, warranties of content, accuracy and reliability. Any interested party should undertake their own inquiries as to the accuracy of the information. Colliers International excludes unequivocally all inferred or implied terms, conditions and warranties arising out of this document and excludes all liability for loss and damages arising there from. Colliers International is a worldwide affiliation of independently owned and operated companies. Erin Proto Senior Research Manager erin.proto@colliers.com tel +1 415 288 7827 Erika Kim Senior Marketing Manager erika.kim@colliers.com tel +1 415 288 7895