SlideShare une entreprise Scribd logo
1  sur  35
Télécharger pour lire hors ligne
First 4 BFPs nearing completion


            Niger
6 remaining BFPs started in 2008


             Niger
Broad review of basins

• Development context
  – Overall situation
• Water availability / use
• Water productivity
• Intervention and impact analysis
  – Intervention: what ‘they can do’
  – Impact: what ‘you’ can do
• Knowledge management
  – Not much to show at this stage
Background development
        context
•   The poorest tend to rely on agriculture


                                                                     Agriculture vs GNI

                                                    50,000
           Gross National Income ($/capita)


                                                    40,000

                                                    30,000

                                                    20,000                                                Size of bubble
                                                                                                    proportional to rural
                                                    10,000                                                   population


                                                         0
                                              -10             0        10          20          30          40           50
                                                    -10,000
                                                                  Agricultural contribution to GDP (% )

                                                                                                           World Bank, 2007
Agriculture agriculture to GDP
% Contribution of contribution to growth (%)   Essential to understand relative function of agriculture


                                                                                          volta


                                                                                      Mekong
                                                              Sao Karkheh
                                                              Francisco


                                                                                               World Bank, 2007
                                                                 % Rural poor
Water availability
Multiple water use reflects hydrology

                                                    Suppy limit
                                                                          Capacity limit
                1.0


                                                              Ganges
    ET / ETot
          p


                                 Sao Francisco

                0.5                                       Mekong
                                  Volta
                              Nile
                        Limpopo
                                     Yellow River
                      Karkeh    Indus


                0.0                                 Andean
                   0.00                 0.50           1.00            1.50            2.00
                                                     Rain / ETpot
Ganges
                                                                                                                                                   1,167 bcm


                  Water use supports varied livelihoods
                                                                                                                            M eko ng
                                                                                                                            1,19 5 b cm


                                                                                     Sa o Fr a nc i s c o
                                                                                         622 bcm


                                                            Nile
                                                         2,042 bcm
                                                                                                            Suppy limit
                                                                                                                                             Capacity limit
                                                        1.0
                 Net runoff


                                               Indus
                                              865 bcm


                                                                                                                       Ganges
                                          ET / ETot
                                                p


                                                                          Sao Francisco
              Grassland ET
                                                                                                                                           Fish
                                                        0.5                                                       Mekong
              Rainfed crops    Lim popo
                               229 bcm                                     Volta
                                                                                                               Crops
                                                                       Nile
              Irrigation ET                                     Limpopo
                                                                              Yellow River
                                                                             Livestock
                                                              Karkeh    Indus
                      Yellow
                     384 bcm


                                                                     Irrigation
                                                        0.0                                                 Andean
                                                           0.00               0.50                             1.00                       1.50                 2.00
  K ar kheh

2 1, 4 0 2 mcm


                                                                                                             Rain / ETpot
Hydrology matters to livelihoods

 Songkhram Wet        Songkhram Dry


                               David Blake
Rainfed ag. by far the
                  biggest user                                                                                                                        0.35
                                                                                                                                                                                                       Rainfall


                                                                                                                        Evaporation or Rainfall (m)
                                                                                                                                                      0.30                                             ETo
                                                                                                                                                      0.25

                                                                                                                                                      0.20

                                                                                                                                                      0.15

                                                                                                                                                      0.10

                                                                                                                                                      0.05

                                                                                                                                                      0.00
                                                                                                                                                             Jan Feb M Apr M Jun Jul Aug Sep O N Dec
                                                                                                                                                                      ar    ay                ct ov


        45000
                                                                           Calculated
        40000
                                                                           Observed
        35000

        30000
Flow,


        25000

        20000

        15000

        10000
                                                                                                                                                                                                     0.35
                                                                                                                                                                                                                          Rainfall
        5000


                                                                                                                                                                       Evaporation or Rainfall (m)
                                                                                                                                                                                                     0.30                 ETo
                                                                                                                                                                                                     0.25
           0                                                                                                                                                                                         0.20

           1951    1956   1961   1966   1971   1976   1981   1986   1991   1996                                                                                                                      0.15

                                                                                                                                                                                                     0.10

                                                                                                                                                                                                     0.05

                                                                                                                                                                                                     0.00
                                                                                                                                                                                                            Jan Feb M Apr M Jun Jul Aug Sep O N Dec
                                                                                                                                                                                                                     ar    ay                ct ov


                  Nile                                                                                                0.35
                                                                                                                                                                       Rainfall


                                                                                        Evaporation or Rainfall (m)
                                                                                                                      0.30                                             ETo
                                                                                                                      0.25

                                                                                                                      0.20

                                                                                                                      0.15

                                                                                                                      0.10

                                                                                                                      0.05

                                                                                                                      0.00

                From Kirby et al., W-Use                                                                                                              Jan Feb M Apr M Jun Jul Aug Sep O N Dec
                                                                                                                                                               ar    ay                ct ov
Volta


Devaraj de Condappa
But irrigation a major
  user in Asia


   Ganges


From Kirby et al., W-Use
accounts
Grassland and rainfed dominate area   Global Land cover classes – 2000 (UNEP)
But in Asia, irrigation drives up population density   Irrigation (IWMI)
Population density (persons per km2) – (CIESIN -2000)
Basin water use and population
                                                                                                                (Preliminary analysis)
          Indus                                                                                       Ganges


                                         Water use (mcm)                                                                             Water use (m cm)

              0     50,000   100,000     150,000      200,000   250,000   300,000   350,000                0            100,000             200,000           300,000            400,000

                                                                                              Irrigated
Irrigated
                                                                                              Woodland +
Woodland +
                                                                                              Grass
Grass
                                                                                              Rainfed
Rainfed
                                                                                                          400    350      300        250     200      150      100        50       0
             200             150                 100                50                0
                                                                                                                                population (millions)
                                       population (millions)

                                                                                                      Mekong
                                           Yellow

                                         Water use (mcm)                                                                             Water use (m cm)

              0    20,000 40,000   60,000 80,000 100,000 120,000 140,000 160,000                           0          100,000        200,000        300,000        400,000       500,000

Irrigated                                                                                     Irrigated
Woodland +                                                                                    Woodland +
Grass                                                                                         Grass
Rainfed                                                                                       Rainfed
             200             150                100                 50                0
                                       population (millions)                                               50    45     40      35     30      25     20      15     10      5      0
                                                                                                                                population (millions)


                                                                                                                Relative values better than absolutes
Volta                                                                 Lim popo


                                          Water use (m cm )                                                  Water use (m cm)
                   0    50,000 100,000 150,000 200,000 250,000 300,000 350,000             0               50,000                 100,000             150,000


Irrigated

Woodland +

Grass

Rainfed

               20              15                 10            5        0                 20         15                10                  5             0
                                       population (m illions)                                              population (millions)


        Sao Francisco                                                              Nile


                                          Water use (m cm )                                                    Water use (mcm)

                   0     50,000     100,000 150,000 200,000 250,000 300,000               0     200,000       400,000         600,000       800,000   1,000,000


 Irrigated

 Woodland +

 Grass

 Rainfed
                20                15               10           5         0               200        150                100             50               0
                                       population (m illions)                                                population (millions)
Water productivity
Basic concept: Need Water productivity to
       respond faster than demand

                             Demand
           response            line

   WP


                       crisis

                                time
In some places, water productivity is responding to demand


                                            0.800


           3
                                                                VN, Mekong Delta


            Rice Water productivity, kg/m
                                            0.600
                                                                 Vietnam


                                                              VN Central
                                                              Highlands
                                            0.400

                                                       Laos

                                            0.200      Cambodia
                                                                   NE Thailand


                                            0.000
                                                1990                1995            2000   2005
                                                                             Year

                                                                                                  Mac Kirby, 2007
Other basins, response low or patchy


      Volta
                   IRD, 2007

              Potential= 1-2 kg/m3
Actual   Water-Productivity [the gain per m3 water
   consumed] much lower than      potential


         Volta
                      IRD, 2007

                 Potential= 1-2 kg/m3
Other crops
• Sugar and maize
• Thailand high
• Generally increasing
                          6.00
                                                                Laos
                          5.00
Maize yield, ton/ha


                                                                Thailand
                          4.00

                          3.00                                  Cambodia

                          2.00                                  Vietnam

                          1.00
                                                                Vietnam Central
                          0.00                                  highlands
                             1990   1995          2000   2005   Vietnam Mekong
                                                                River Delta
                                           Year


                          80
                                                                 Laos
Sugarcane yield, ton/ha


                          60                                     Thailand

                          40                                     Cambodia

                                                                 Vietnam
                          20
                                                                 Vietnam Central
                           0                                     highlands
                           1990     1995          2000   2005    Vietnam Mekong
                                                                 River Delta
                                           Year
Full range of WPr may include
•   Irrigated crops
•   Rainfed
•   Livestock
•   Fisheries
    – Capture
    – Aquaculture


…most systems highly mixed
Water agriculture and
       poverty
Measurable livelihood impacts
Water availability seems less influential than
  gain per volume used (water productivity)

                                           Per capita income vs.
                                                GNI vs Water
                                             water availability
                            50,000


                            40,000
   GNI ($/cap PPP)


                            30,000


                            20,000


                            10,000


                                 0
                     -500             0          500        1000          1500      2000        2500
                            -10,000
                                      Size of bubble proportional to agriculture contribution to GDP
                                                                      3
                                                 Water availability (m /cap)

                                                                                      World Bank, 2007
São Francisco: Drought is one poverty factor…of many
                                 Drought


                                                       Poor
                                                       education


           Access to
           credit


Marcello Torres
et al., 2008
Karkheh, Iran: Farmers not the poorest
                               politics controls

 0.40
 0.35
 0.30
 0.25
 0.20
 0.15
 0.10
 0.05
 0.00


                                                                            KB
        ed


                                                                        r
                 er


                        k


                                            er


                                                          r


                                                                                      ry
                                     n


                                                                     ke
                                                        ke
                        er


                                  so


                                                                                    nt
               ag


                                           rm
      oy


                                                                   or
                      Cl


                                                         r


                                                                                   ou
                                                      wo
                               er
             an


                                         Fa
    pl


                                                                  w
                             ep


                                                                                  C
   m


             M


                                                              d
                                                 n
   e


                                                            lle
                          ad


                                                 io
Un


                                              ct


                                                          ki
                        Tr


                                            du


                                                        ns
                                            o


                                                       U
                                         Pr


Poverty lines from household                                                     Karkheh BFP team
income and expenditure data
.. Mekong
                What people do can affect (shared) assets


                                          Dam development
                                                                    Changing land use,
                                                                    shifting cultivation,
                                                                    sustainability,
                                                                    sedimentation
                                            Seasonal water
                                            shortage, poor soils,
                                            low rice productivity


                                              Fish &
                                              environmental
                                              impacts of upstream   Salinisation, water
                                                                    quality, highly
                                                                    developed
             Complex but understandable

Eric Kemp-Benedict, 2008
     Syngenta Science Day 2009
Interventions
Global -to local

                 GLOBAL
water and food systems considered separately
         both impact on livelihoods


                                               Basin scale
                                        Systems interact through
                                         (Unspecified) transfers


                 Local Scale
    Local systems considered individually
Local impact not referenced to broader systems
Opportunities or pressures vary from basin to basin
                                             Remember development
                                                         trajectory


                      Niger


     Markets

                      Climate change
                                       Population growth
                                                Need for ecosystem
                                                services
Impact pathway and
    Knowledge management
• All impact pathways done
  – All honest efforts
• Pathway depends on basin scale,
  organization, existing network makers,
  etc..
• Getting better engagement with CPWF
  – Some more work needed with Topics
Agenda

Contenu connexe

En vedette (6)

Enhancing benefits from aquatic ecosystems: Nakambe sub-basin Case study
Enhancing benefits from aquatic ecosystems: Nakambe sub-basin Case studyEnhancing benefits from aquatic ecosystems: Nakambe sub-basin Case study
Enhancing benefits from aquatic ecosystems: Nakambe sub-basin Case study
 
Water Productivity
Water ProductivityWater Productivity
Water Productivity
 
Development and Application of Knowledge base in the Indo-Ganges Basin
Development and Application of Knowledge base in the Indo-Ganges BasinDevelopment and Application of Knowledge base in the Indo-Ganges Basin
Development and Application of Knowledge base in the Indo-Ganges Basin
 
Livestock Water Productivity: Lessons relevant to the BFPs
Livestock Water Productivity: Lessons relevant to the BFPsLivestock Water Productivity: Lessons relevant to the BFPs
Livestock Water Productivity: Lessons relevant to the BFPs
 
Rc101 day1
Rc101 day1Rc101 day1
Rc101 day1
 
Rivers and streams restoration - brochure 2010!
Rivers and streams restoration - brochure 2010!Rivers and streams restoration - brochure 2010!
Rivers and streams restoration - brochure 2010!
 

Similaire à Brief Cross Basin Review (8)

The global water and food crisis
The global water and food crisisThe global water and food crisis
The global water and food crisis
 
Simon Cook - The global water and food crisis
Simon Cook - The global water and food crisisSimon Cook - The global water and food crisis
Simon Cook - The global water and food crisis
 
Water agriculture and poverty-trying to unravel the complexity
Water agriculture and poverty-trying to unravel the complexityWater agriculture and poverty-trying to unravel the complexity
Water agriculture and poverty-trying to unravel the complexity
 
Cy Jones
Cy JonesCy Jones
Cy Jones
 
Green and Blue Water - a model & data based analysis of water scarcity, produ...
Green and Blue Water - a model & data based analysis of water scarcity, produ...Green and Blue Water - a model & data based analysis of water scarcity, produ...
Green and Blue Water - a model & data based analysis of water scarcity, produ...
 
Identifying Water-Poverty Links at plot level
Identifying Water-Poverty Links at plot levelIdentifying Water-Poverty Links at plot level
Identifying Water-Poverty Links at plot level
 
Analysis of agricultural water productivity in the Indo-Ganges Basin
Analysis of agricultural water productivity in the Indo-Ganges BasinAnalysis of agricultural water productivity in the Indo-Ganges Basin
Analysis of agricultural water productivity in the Indo-Ganges Basin
 
Water, poverty and agriculture -A cross basin comparison
Water, poverty and agriculture -A cross basin comparisonWater, poverty and agriculture -A cross basin comparison
Water, poverty and agriculture -A cross basin comparison
 

Plus de Water, food and livelihoods in River Basins: Basin Focal Projects

Plus de Water, food and livelihoods in River Basins: Basin Focal Projects (20)

El ambiente Institucional como un indicador para orientar intervenciones estr...
El ambiente Institucional como un indicador para orientar intervenciones estr...El ambiente Institucional como un indicador para orientar intervenciones estr...
El ambiente Institucional como un indicador para orientar intervenciones estr...
 
Pobreza y Agua en los Andes
Pobreza y Agua en los AndesPobreza y Agua en los Andes
Pobreza y Agua en los Andes
 
Presentación de productos del Proyecto Focal de Cuencas de Los Andes
Presentación de productos del Proyecto Focal de Cuencas de Los AndesPresentación de productos del Proyecto Focal de Cuencas de Los Andes
Presentación de productos del Proyecto Focal de Cuencas de Los Andes
 
Water availability and Productivity in the Andes Region- long version
Water availability and Productivity in the Andes Region- long versionWater availability and Productivity in the Andes Region- long version
Water availability and Productivity in the Andes Region- long version
 
The human footprint on water : agricultural, industrial, and urban impacts on...
The human footprint on water : agricultural, industrial, and urban impacts on...The human footprint on water : agricultural, industrial, and urban impacts on...
The human footprint on water : agricultural, industrial, and urban impacts on...
 
HACIA UNA APROXIMACIÓN DE LA ESTIMACIÓN DE LA ESCASEZ Y COSTO DEL ACCESO AL A...
HACIA UNA APROXIMACIÓN DE LA ESTIMACIÓN DE LA ESCASEZ Y COSTO DEL ACCESO AL A...HACIA UNA APROXIMACIÓN DE LA ESTIMACIÓN DE LA ESCASEZ Y COSTO DEL ACCESO AL A...
HACIA UNA APROXIMACIÓN DE LA ESTIMACIÓN DE LA ESCASEZ Y COSTO DEL ACCESO AL A...
 
Water and Climate Change. Bridging Gaps
Water and Climate Change. Bridging GapsWater and Climate Change. Bridging Gaps
Water and Climate Change. Bridging Gaps
 
Water availability and Productivity in the Andes Region
Water availability and Productivity in the Andes RegionWater availability and Productivity in the Andes Region
Water availability and Productivity in the Andes Region
 
SCIENTIFIC CAPACITY STRENGTHENING FOR WATER RESOURCES MANAGEMENT FACING CLIMA...
SCIENTIFIC CAPACITY STRENGTHENING FOR WATER RESOURCES MANAGEMENT FACING CLIMA...SCIENTIFIC CAPACITY STRENGTHENING FOR WATER RESOURCES MANAGEMENT FACING CLIMA...
SCIENTIFIC CAPACITY STRENGTHENING FOR WATER RESOURCES MANAGEMENT FACING CLIMA...
 
Efectos del Cambio Climático en la Salud Pública
Efectos del Cambio Climático en la Salud PúblicaEfectos del Cambio Climático en la Salud Pública
Efectos del Cambio Climático en la Salud Pública
 
Cambio climático y su impacto sobre la biodiversidad
Cambio climático y su impacto sobre la biodiversidadCambio climático y su impacto sobre la biodiversidad
Cambio climático y su impacto sobre la biodiversidad
 
Hydroinformatics and some of its roles in the view of climate variability
Hydroinformatics and some of its roles in the view of climate variabilityHydroinformatics and some of its roles in the view of climate variability
Hydroinformatics and some of its roles in the view of climate variability
 
Water Integrity, Gender Equity and Climate Change
Water Integrity, Gender Equity and Climate ChangeWater Integrity, Gender Equity and Climate Change
Water Integrity, Gender Equity and Climate Change
 
Linkages between Fisheries, Poverty and Growth: Key concepts and methodology
Linkages between Fisheries, Poverty and Growth: Key concepts and methodologyLinkages between Fisheries, Poverty and Growth: Key concepts and methodology
Linkages between Fisheries, Poverty and Growth: Key concepts and methodology
 
Linkages between Fisheries, Poverty and Growth: A Summary and Synthesis...
Linkages between Fisheries, Poverty and Growth: A Summary and Synthesis...Linkages between Fisheries, Poverty and Growth: A Summary and Synthesis...
Linkages between Fisheries, Poverty and Growth: A Summary and Synthesis...
 
Linkages between Fisheries, Poverty and Growth: Bangladesh Case Study
Linkages between Fisheries, Poverty and Growth: Bangladesh Case StudyLinkages between Fisheries, Poverty and Growth: Bangladesh Case Study
Linkages between Fisheries, Poverty and Growth: Bangladesh Case Study
 
Linkages between Fisheries, Poverty and Growth: India Case Study
Linkages between Fisheries, Poverty and Growth: India Case StudyLinkages between Fisheries, Poverty and Growth: India Case Study
Linkages between Fisheries, Poverty and Growth: India Case Study
 
Linkages between Fisheries, Poverty and Growth: Malawi Case Study
Linkages between Fisheries, Poverty and Growth: Malawi Case StudyLinkages between Fisheries, Poverty and Growth: Malawi Case Study
Linkages between Fisheries, Poverty and Growth: Malawi Case Study
 
INVESTIGATING THE LINKAGES BETWEEN FISHERIES, POVERTY AND GROWTH: Thailand Ca...
INVESTIGATING THE LINKAGES BETWEEN FISHERIES, POVERTY AND GROWTH: Thailand Ca...INVESTIGATING THE LINKAGES BETWEEN FISHERIES, POVERTY AND GROWTH: Thailand Ca...
INVESTIGATING THE LINKAGES BETWEEN FISHERIES, POVERTY AND GROWTH: Thailand Ca...
 
Design of a Research Programme for the Social and Economic Valuation of the A...
Design of a Research Programme for the Social and Economic Valuation of the A...Design of a Research Programme for the Social and Economic Valuation of the A...
Design of a Research Programme for the Social and Economic Valuation of the A...
 

Dernier

BASLIQ CURRENT LOOKBOOK LOOKBOOK(1) (1).pdf
BASLIQ CURRENT LOOKBOOK  LOOKBOOK(1) (1).pdfBASLIQ CURRENT LOOKBOOK  LOOKBOOK(1) (1).pdf
BASLIQ CURRENT LOOKBOOK LOOKBOOK(1) (1).pdfSoniaTolstoy
 
Organic Name Reactions for the students and aspirants of Chemistry12th.pptx
Organic Name Reactions  for the students and aspirants of Chemistry12th.pptxOrganic Name Reactions  for the students and aspirants of Chemistry12th.pptx
Organic Name Reactions for the students and aspirants of Chemistry12th.pptxVS Mahajan Coaching Centre
 
SOCIAL AND HISTORICAL CONTEXT - LFTVD.pptx
SOCIAL AND HISTORICAL CONTEXT - LFTVD.pptxSOCIAL AND HISTORICAL CONTEXT - LFTVD.pptx
SOCIAL AND HISTORICAL CONTEXT - LFTVD.pptxiammrhaywood
 
Web & Social Media Analytics Previous Year Question Paper.pdf
Web & Social Media Analytics Previous Year Question Paper.pdfWeb & Social Media Analytics Previous Year Question Paper.pdf
Web & Social Media Analytics Previous Year Question Paper.pdfJayanti Pande
 
Q4-W6-Restating Informational Text Grade 3
Q4-W6-Restating Informational Text Grade 3Q4-W6-Restating Informational Text Grade 3
Q4-W6-Restating Informational Text Grade 3JemimahLaneBuaron
 
18-04-UA_REPORT_MEDIALITERAСY_INDEX-DM_23-1-final-eng.pdf
18-04-UA_REPORT_MEDIALITERAСY_INDEX-DM_23-1-final-eng.pdf18-04-UA_REPORT_MEDIALITERAСY_INDEX-DM_23-1-final-eng.pdf
18-04-UA_REPORT_MEDIALITERAСY_INDEX-DM_23-1-final-eng.pdfssuser54595a
 
URLs and Routing in the Odoo 17 Website App
URLs and Routing in the Odoo 17 Website AppURLs and Routing in the Odoo 17 Website App
URLs and Routing in the Odoo 17 Website AppCeline George
 
Industrial Policy - 1948, 1956, 1973, 1977, 1980, 1991
Industrial Policy - 1948, 1956, 1973, 1977, 1980, 1991Industrial Policy - 1948, 1956, 1973, 1977, 1980, 1991
Industrial Policy - 1948, 1956, 1973, 1977, 1980, 1991RKavithamani
 
A Critique of the Proposed National Education Policy Reform
A Critique of the Proposed National Education Policy ReformA Critique of the Proposed National Education Policy Reform
A Critique of the Proposed National Education Policy ReformChameera Dedduwage
 
How to Make a Pirate ship Primary Education.pptx
How to Make a Pirate ship Primary Education.pptxHow to Make a Pirate ship Primary Education.pptx
How to Make a Pirate ship Primary Education.pptxmanuelaromero2013
 
Presentation by Andreas Schleicher Tackling the School Absenteeism Crisis 30 ...
Presentation by Andreas Schleicher Tackling the School Absenteeism Crisis 30 ...Presentation by Andreas Schleicher Tackling the School Absenteeism Crisis 30 ...
Presentation by Andreas Schleicher Tackling the School Absenteeism Crisis 30 ...EduSkills OECD
 
Introduction to ArtificiaI Intelligence in Higher Education
Introduction to ArtificiaI Intelligence in Higher EducationIntroduction to ArtificiaI Intelligence in Higher Education
Introduction to ArtificiaI Intelligence in Higher Educationpboyjonauth
 
The basics of sentences session 2pptx copy.pptx
The basics of sentences session 2pptx copy.pptxThe basics of sentences session 2pptx copy.pptx
The basics of sentences session 2pptx copy.pptxheathfieldcps1
 
Grant Readiness 101 TechSoup and Remy Consulting
Grant Readiness 101 TechSoup and Remy ConsultingGrant Readiness 101 TechSoup and Remy Consulting
Grant Readiness 101 TechSoup and Remy ConsultingTechSoup
 
POINT- BIOCHEMISTRY SEM 2 ENZYMES UNIT 5.pptx
POINT- BIOCHEMISTRY SEM 2 ENZYMES UNIT 5.pptxPOINT- BIOCHEMISTRY SEM 2 ENZYMES UNIT 5.pptx
POINT- BIOCHEMISTRY SEM 2 ENZYMES UNIT 5.pptxSayali Powar
 
Arihant handbook biology for class 11 .pdf
Arihant handbook biology for class 11 .pdfArihant handbook biology for class 11 .pdf
Arihant handbook biology for class 11 .pdfchloefrazer622
 

Dernier (20)

BASLIQ CURRENT LOOKBOOK LOOKBOOK(1) (1).pdf
BASLIQ CURRENT LOOKBOOK  LOOKBOOK(1) (1).pdfBASLIQ CURRENT LOOKBOOK  LOOKBOOK(1) (1).pdf
BASLIQ CURRENT LOOKBOOK LOOKBOOK(1) (1).pdf
 
Organic Name Reactions for the students and aspirants of Chemistry12th.pptx
Organic Name Reactions  for the students and aspirants of Chemistry12th.pptxOrganic Name Reactions  for the students and aspirants of Chemistry12th.pptx
Organic Name Reactions for the students and aspirants of Chemistry12th.pptx
 
INDIA QUIZ 2024 RLAC DELHI UNIVERSITY.pptx
INDIA QUIZ 2024 RLAC DELHI UNIVERSITY.pptxINDIA QUIZ 2024 RLAC DELHI UNIVERSITY.pptx
INDIA QUIZ 2024 RLAC DELHI UNIVERSITY.pptx
 
SOCIAL AND HISTORICAL CONTEXT - LFTVD.pptx
SOCIAL AND HISTORICAL CONTEXT - LFTVD.pptxSOCIAL AND HISTORICAL CONTEXT - LFTVD.pptx
SOCIAL AND HISTORICAL CONTEXT - LFTVD.pptx
 
Web & Social Media Analytics Previous Year Question Paper.pdf
Web & Social Media Analytics Previous Year Question Paper.pdfWeb & Social Media Analytics Previous Year Question Paper.pdf
Web & Social Media Analytics Previous Year Question Paper.pdf
 
Staff of Color (SOC) Retention Efforts DDSD
Staff of Color (SOC) Retention Efforts DDSDStaff of Color (SOC) Retention Efforts DDSD
Staff of Color (SOC) Retention Efforts DDSD
 
TataKelola dan KamSiber Kecerdasan Buatan v022.pdf
TataKelola dan KamSiber Kecerdasan Buatan v022.pdfTataKelola dan KamSiber Kecerdasan Buatan v022.pdf
TataKelola dan KamSiber Kecerdasan Buatan v022.pdf
 
Q4-W6-Restating Informational Text Grade 3
Q4-W6-Restating Informational Text Grade 3Q4-W6-Restating Informational Text Grade 3
Q4-W6-Restating Informational Text Grade 3
 
18-04-UA_REPORT_MEDIALITERAСY_INDEX-DM_23-1-final-eng.pdf
18-04-UA_REPORT_MEDIALITERAСY_INDEX-DM_23-1-final-eng.pdf18-04-UA_REPORT_MEDIALITERAСY_INDEX-DM_23-1-final-eng.pdf
18-04-UA_REPORT_MEDIALITERAСY_INDEX-DM_23-1-final-eng.pdf
 
URLs and Routing in the Odoo 17 Website App
URLs and Routing in the Odoo 17 Website AppURLs and Routing in the Odoo 17 Website App
URLs and Routing in the Odoo 17 Website App
 
Industrial Policy - 1948, 1956, 1973, 1977, 1980, 1991
Industrial Policy - 1948, 1956, 1973, 1977, 1980, 1991Industrial Policy - 1948, 1956, 1973, 1977, 1980, 1991
Industrial Policy - 1948, 1956, 1973, 1977, 1980, 1991
 
A Critique of the Proposed National Education Policy Reform
A Critique of the Proposed National Education Policy ReformA Critique of the Proposed National Education Policy Reform
A Critique of the Proposed National Education Policy Reform
 
How to Make a Pirate ship Primary Education.pptx
How to Make a Pirate ship Primary Education.pptxHow to Make a Pirate ship Primary Education.pptx
How to Make a Pirate ship Primary Education.pptx
 
Presentation by Andreas Schleicher Tackling the School Absenteeism Crisis 30 ...
Presentation by Andreas Schleicher Tackling the School Absenteeism Crisis 30 ...Presentation by Andreas Schleicher Tackling the School Absenteeism Crisis 30 ...
Presentation by Andreas Schleicher Tackling the School Absenteeism Crisis 30 ...
 
Mattingly "AI & Prompt Design: The Basics of Prompt Design"
Mattingly "AI & Prompt Design: The Basics of Prompt Design"Mattingly "AI & Prompt Design: The Basics of Prompt Design"
Mattingly "AI & Prompt Design: The Basics of Prompt Design"
 
Introduction to ArtificiaI Intelligence in Higher Education
Introduction to ArtificiaI Intelligence in Higher EducationIntroduction to ArtificiaI Intelligence in Higher Education
Introduction to ArtificiaI Intelligence in Higher Education
 
The basics of sentences session 2pptx copy.pptx
The basics of sentences session 2pptx copy.pptxThe basics of sentences session 2pptx copy.pptx
The basics of sentences session 2pptx copy.pptx
 
Grant Readiness 101 TechSoup and Remy Consulting
Grant Readiness 101 TechSoup and Remy ConsultingGrant Readiness 101 TechSoup and Remy Consulting
Grant Readiness 101 TechSoup and Remy Consulting
 
POINT- BIOCHEMISTRY SEM 2 ENZYMES UNIT 5.pptx
POINT- BIOCHEMISTRY SEM 2 ENZYMES UNIT 5.pptxPOINT- BIOCHEMISTRY SEM 2 ENZYMES UNIT 5.pptx
POINT- BIOCHEMISTRY SEM 2 ENZYMES UNIT 5.pptx
 
Arihant handbook biology for class 11 .pdf
Arihant handbook biology for class 11 .pdfArihant handbook biology for class 11 .pdf
Arihant handbook biology for class 11 .pdf
 

Brief Cross Basin Review

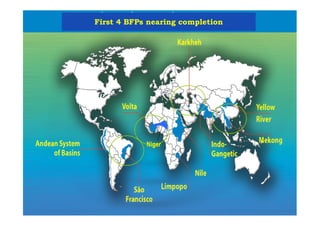
  • 1. First 4 BFPs nearing completion Niger
  • 2. 6 remaining BFPs started in 2008 Niger
  • 3. Broad review of basins • Development context – Overall situation • Water availability / use • Water productivity • Intervention and impact analysis – Intervention: what ‘they can do’ – Impact: what ‘you’ can do • Knowledge management – Not much to show at this stage
  • 5. The poorest tend to rely on agriculture Agriculture vs GNI 50,000 Gross National Income ($/capita) 40,000 30,000 20,000 Size of bubble proportional to rural 10,000 population 0 -10 0 10 20 30 40 50 -10,000 Agricultural contribution to GDP (% ) World Bank, 2007
  • 6. Agriculture agriculture to GDP % Contribution of contribution to growth (%) Essential to understand relative function of agriculture volta Mekong Sao Karkheh Francisco World Bank, 2007 % Rural poor
  • 8. Multiple water use reflects hydrology Suppy limit Capacity limit 1.0 Ganges ET / ETot p Sao Francisco 0.5 Mekong Volta Nile Limpopo Yellow River Karkeh Indus 0.0 Andean 0.00 0.50 1.00 1.50 2.00 Rain / ETpot
  • 9. Ganges 1,167 bcm Water use supports varied livelihoods M eko ng 1,19 5 b cm Sa o Fr a nc i s c o 622 bcm Nile 2,042 bcm Suppy limit Capacity limit 1.0 Net runoff Indus 865 bcm Ganges ET / ETot p Sao Francisco Grassland ET Fish 0.5 Mekong Rainfed crops Lim popo 229 bcm Volta Crops Nile Irrigation ET Limpopo Yellow River Livestock Karkeh Indus Yellow 384 bcm Irrigation 0.0 Andean 0.00 0.50 1.00 1.50 2.00 K ar kheh 2 1, 4 0 2 mcm Rain / ETpot
  • 10. Hydrology matters to livelihoods Songkhram Wet Songkhram Dry David Blake
  • 11. Rainfed ag. by far the biggest user 0.35 Rainfall Evaporation or Rainfall (m) 0.30 ETo 0.25 0.20 0.15 0.10 0.05 0.00 Jan Feb M Apr M Jun Jul Aug Sep O N Dec ar ay ct ov 45000 Calculated 40000 Observed 35000 30000 Flow, 25000 20000 15000 10000 0.35 Rainfall 5000 Evaporation or Rainfall (m) 0.30 ETo 0.25 0 0.20 1951 1956 1961 1966 1971 1976 1981 1986 1991 1996 0.15 0.10 0.05 0.00 Jan Feb M Apr M Jun Jul Aug Sep O N Dec ar ay ct ov Nile 0.35 Rainfall Evaporation or Rainfall (m) 0.30 ETo 0.25 0.20 0.15 0.10 0.05 0.00 From Kirby et al., W-Use Jan Feb M Apr M Jun Jul Aug Sep O N Dec ar ay ct ov
  • 13. But irrigation a major user in Asia Ganges From Kirby et al., W-Use accounts
  • 14. Grassland and rainfed dominate area Global Land cover classes – 2000 (UNEP)
  • 15. But in Asia, irrigation drives up population density Irrigation (IWMI)
  • 16. Population density (persons per km2) – (CIESIN -2000)
  • 17. Basin water use and population (Preliminary analysis) Indus Ganges Water use (mcm) Water use (m cm) 0 50,000 100,000 150,000 200,000 250,000 300,000 350,000 0 100,000 200,000 300,000 400,000 Irrigated Irrigated Woodland + Woodland + Grass Grass Rainfed Rainfed 400 350 300 250 200 150 100 50 0 200 150 100 50 0 population (millions) population (millions) Mekong Yellow Water use (mcm) Water use (m cm) 0 20,000 40,000 60,000 80,000 100,000 120,000 140,000 160,000 0 100,000 200,000 300,000 400,000 500,000 Irrigated Irrigated Woodland + Woodland + Grass Grass Rainfed Rainfed 200 150 100 50 0 population (millions) 50 45 40 35 30 25 20 15 10 5 0 population (millions) Relative values better than absolutes
  • 18. Volta Lim popo Water use (m cm ) Water use (m cm) 0 50,000 100,000 150,000 200,000 250,000 300,000 350,000 0 50,000 100,000 150,000 Irrigated Woodland + Grass Rainfed 20 15 10 5 0 20 15 10 5 0 population (m illions) population (millions) Sao Francisco Nile Water use (m cm ) Water use (mcm) 0 50,000 100,000 150,000 200,000 250,000 300,000 0 200,000 400,000 600,000 800,000 1,000,000 Irrigated Woodland + Grass Rainfed 20 15 10 5 0 200 150 100 50 0 population (m illions) population (millions)
  • 20. Basic concept: Need Water productivity to respond faster than demand Demand response line WP crisis time
  • 21. In some places, water productivity is responding to demand 0.800 3 VN, Mekong Delta Rice Water productivity, kg/m 0.600 Vietnam VN Central Highlands 0.400 Laos 0.200 Cambodia NE Thailand 0.000 1990 1995 2000 2005 Year Mac Kirby, 2007
  • 22. Other basins, response low or patchy Volta IRD, 2007 Potential= 1-2 kg/m3
  • 23. Actual Water-Productivity [the gain per m3 water consumed] much lower than potential Volta IRD, 2007 Potential= 1-2 kg/m3
  • 24. Other crops • Sugar and maize • Thailand high • Generally increasing 6.00 Laos 5.00 Maize yield, ton/ha Thailand 4.00 3.00 Cambodia 2.00 Vietnam 1.00 Vietnam Central 0.00 highlands 1990 1995 2000 2005 Vietnam Mekong River Delta Year 80 Laos Sugarcane yield, ton/ha 60 Thailand 40 Cambodia Vietnam 20 Vietnam Central 0 highlands 1990 1995 2000 2005 Vietnam Mekong River Delta Year
  • 25. Full range of WPr may include • Irrigated crops • Rainfed • Livestock • Fisheries – Capture – Aquaculture …most systems highly mixed
  • 26. Water agriculture and poverty Measurable livelihood impacts
  • 27. Water availability seems less influential than gain per volume used (water productivity) Per capita income vs. GNI vs Water water availability 50,000 40,000 GNI ($/cap PPP) 30,000 20,000 10,000 0 -500 0 500 1000 1500 2000 2500 -10,000 Size of bubble proportional to agriculture contribution to GDP 3 Water availability (m /cap) World Bank, 2007
  • 28. São Francisco: Drought is one poverty factor…of many Drought Poor education Access to credit Marcello Torres et al., 2008
  • 29. Karkheh, Iran: Farmers not the poorest politics controls 0.40 0.35 0.30 0.25 0.20 0.15 0.10 0.05 0.00 KB ed r er k er r ry n ke ke er so nt ag rm oy or Cl r ou wo er an Fa pl w ep C m M d n e lle ad io Un ct ki Tr du ns o U Pr Poverty lines from household Karkheh BFP team income and expenditure data
  • 30. .. Mekong What people do can affect (shared) assets Dam development Changing land use, shifting cultivation, sustainability, sedimentation Seasonal water shortage, poor soils, low rice productivity Fish & environmental impacts of upstream Salinisation, water quality, highly developed Complex but understandable Eric Kemp-Benedict, 2008 Syngenta Science Day 2009
  • 32. Global -to local GLOBAL water and food systems considered separately both impact on livelihoods Basin scale Systems interact through (Unspecified) transfers Local Scale Local systems considered individually Local impact not referenced to broader systems
  • 33. Opportunities or pressures vary from basin to basin Remember development trajectory Niger Markets Climate change Population growth Need for ecosystem services
  • 34. Impact pathway and Knowledge management • All impact pathways done – All honest efforts • Pathway depends on basin scale, organization, existing network makers, etc.. • Getting better engagement with CPWF – Some more work needed with Topics