SlideShare une entreprise Scribd logo
1  sur  10
Télécharger pour lire hors ligne
Total TorontoMLS
Condo Apartment Sales1,6
Condominium Apartment Market Summary
Third Quarter 2014
Sales Average Price Sales Average Price
Total TREB 5,954 $359,352 5,274 $339,878
Halton Region 192 $327,145 135 $338,223
Peel Region 807 $273,331 743 $253,010
City of Toronto 4,233 $382,210 3,799 $360,137
York Region 591 $348,098 463 $343,197
Durham Region 123 $249,593 123 $235,979
Other Areas 8 $234,061 11 $252,991
2014 2013
TREB Member Inquiries:
(416) 443-8152
Media/Public Inquiries:
(416) 443-8158
Average Condo Price Continues to Grow in Q3
Toronto, October 17, 2014 — Toronto Real Estate Board President Paul
Etherington announced a 12.9 per cent year-over-year increase in condominium
apartment sales through the TorontoMLS system in the third quarter of 2014.
Sales amounted to 5,954. New listings of condominium apartments on
TorontoMLS were also up compared to the same period last year, by 4.5 per cent.
“Condominium apartments represent an affordable home ownership option for
first-time buyers. New condominium apartment completions have been at record
levels over the past two years. However, even though many of these newly
completed units have been listed on TorontoMLS, we have not experienced a glut
in inventory. There have been enough buyers to keep market conditions
balanced, with the average selling price increasing at an above-inflation pace,”
said Mr. Etherington.
The average selling price for Q3 condominium apartment sales was $359,352 – up
by 5.7 per cent compared to the average of $339,878 in Q3 2013. The average
selling price was highest in the City of Toronto, at $382,210, representing a year-
over-year increase of 6.1 per cent.
“Growth in condominium apartment listings will likely continue over the next
year, reflecting the continuation of strong condominium apartment completions.
However, the fact that we are seeing growth in condo sales outstrip growth in
listings suggests that market conditions will remain tight enough to prompt
continued price growth,” said Jason Mercer, TREB’s Director of Market Analysis.
Third Quarter 2014
Real GDP Growthi
Q2 2014 t 3.1%
Toronto Employment Growthii
September 2014 u -1.6%
Toronto Unemployment Rate
September 2014 u 8.2%
Inflation (Yr./Yr. CPI Growth)ii
August 2014 q 2.1%
Bank of Canada Overnight Rateiii
September 2014 q 1.0%
Prime Rate
iv
September 2014 q 3.0%
Mortgage Rates (Sept. 2014)
iv
Chartered Bank Fixed Rates
1 Year q 3.14%
3 Year q 3.75%
5 Year q 4.79%
Sources and Notes:
Economic Indicators
i
Statistics Canada, Quarter-over-quarter
growth, annualized
ii
Statistics Canada, Year-over-year growth
for the most recently reported month
iii
Bank of Canada, Rate from most recent
Bank of Canada announcement
iv
Bank of Canada, rates for most recently
completed month
5,954 5,274
ThirdQuarter 2014 ThirdQuarter 2013
$359,352
$339,878
ThirdQuarter 2014 ThirdQuarter 2013
TorontoMLS Average
Condo Apartment Price1,6
2014 2013 % Chg.
Sales 5,954 5,274 12.9%
New Listings 11,847 11,332 4.5%
Active Listings i
6,620 6,711 -1.4%
Average Price $359,352 $339,878 5.7%
Average DOM 34 36 -5.6%
i
Active listings refer to last month of quarter.
Year-Over-Year Summary
1,6
Condo Market Report, Third Quarter 2014
Industrial Leasing
Page 3
2
Toronto Real Estate Board
ALL TREB AREAS
THIRD QUARTER 2014
Sales1
Dollar Volume1
Average Price1
Median Price1
New Listings2
Active Listings3
Avg. SP/LP4
Avg. DOM5
TREB Total 5,954 $2,139,582,963 $359,352 $320,000 11,847 6,620 98% 34- - - - - - - -
Halton Region 192 $62,811,840 $327,145 $298,743 305 184 98% 35
Burlington 67 $20,744,624 $309,621 $265,000 95 59 98% 38
Halton Hills 8 $2,317,800 $289,725 $310,250 11 3 98% 18
Milton 34 $9,734,630 $286,313 $300,000 53 22 99% 35
Oakville 83 $30,014,786 $361,624 $321,000 146 100 98% 33- - - - - - - -
Peel Region 807 $220,577,861 $273,331 $255,000 1,659 933 97% 36
Brampton 110 $25,426,798 $231,153 $225,000 191 91 98% 31
Caledon 3 $1,224,000 $408,000 $422,000 3 2 98% 60
Mississauga 694 $193,927,063 $279,434 $262,000 1,465 840 97% 37- - - - - - - -
City of Toronto 4,233 $1,617,894,918 $382,210 $340,000 8,323 4,579 98% 33
- - - - - - - -
York Region 591 $205,725,904 $348,098 $325,000 1,349 825 97% 40
Aurora 22 $7,507,600 $341,255 $316,350 38 18 97% 32
E. Gwillimbury 0 - - - - - - -
Georgina 1 $263,000 $263,000 $263,000 1 1 101% 16
King 3 $1,017,000 $339,000 $307,000 32 27 97% 19
Markham 207 $69,830,200 $337,344 $318,000 475 277 98% 40
Newmarket 15 $4,163,500 $277,567 $275,000 19 9 98% 21
Richmond Hill 162 $53,921,176 $332,847 $315,000 402 241 98% 38
Vaughan 177 $67,213,428 $379,737 $360,000 381 247 97% 44
Whitchurch-Stouffville 4 $1,810,000 $452,500 $451,500 1 5 97% 72- - - - - - - -
Durham Region 123 $30,699,950 $249,593 $237,000 198 79 98% 24
Ajax 24 $5,723,550 $238,481 $230,000 31 10 99% 16
Brock 0 - - - - - - -
Clarington 22 $4,629,900 $210,450 $197,000 33 15 98% 19
Oshawa 17 $3,571,050 $210,062 $179,000 43 23 97% 36
Pickering 30 $8,229,750 $274,325 $269,950 54 18 100% 17
Scugog 2 $694,000 $347,000 $347,000 1 - 98% 47
Uxbridge 4 $1,093,000 $273,250 $284,000 6 3 98% 28
Whitby 24 $6,758,700 $281,613 $274,250 30 10 98% 32- - - - - - - -
Dufferin County 3 $826,000 $275,333 $240,000 7 9 97% 32
Orangeville 3 $826,000 $275,333 $240,000 7 9 97% 32- - - - - - - -
Simcoe County 5 $1,046,490 $209,298 $210,000 6 11 98% 49
Adjala-Tosorontio 0 - - - - - - -
Bradford West Gwillimbury 3 $654,990 $218,330 $210,000 2 4 98% 52
Essa 0 - - - - - - -
Innisfil 0 - - - - - - -
New Tecumseth 2 $391,500 $195,750 $195,750 4 7 98% 44
! TURN PAGE FOR CITY OF TORONTO
TABLES OR CLICK HERE:
SUMMARY OF CONDOMINIUM APARTMENT TRANSACTIONS
Condo Market Report, Third Quarter 2014
Industrial Leasing
Page 3
3
Toronto Real Estate Board
CITY OF TORONTO
THIRD QUARTER 2014
Sales
1
Dollar Volume
1
Average Price
1
Median Price
1
New Listings
2
Active Listings
3
Avg. SP/LP
4
Avg. DOM
5
TREB Total 5,954 $2,139,582,963 $359,352 $320,000 11,847 6,620 98% 34
City of Toronto Total 4,233 $1,617,894,918 $382,210 $340,000 8,323 4,579 98% 33
Toronto West 842 $254,684,445 $302,476 $289,900 1,677 997 98% 38
Toronto W01 54 $20,503,289 $379,691 $344,000 171 112 99% 37
Toronto W02 42 $16,894,190 $402,243 $389,000 77 44 100% 22
Toronto W03 20 $5,714,000 $285,700 $289,500 24 10 96% 29
Toronto W04 58 $12,053,450 $207,818 $183,500 117 66 96% 36
Toronto W05 79 $16,007,925 $202,632 $174,000 166 111 97% 39
Toronto W06 181 $68,041,533 $375,920 $344,800 454 289 97% 42
Toronto W07 6 $2,943,000 $490,500 $415,000 14 8 99% 21
Toronto W08 255 $83,538,458 $327,602 $300,000 425 226 98% 38
Toronto W09 51 $10,916,400 $214,047 $180,000 76 45 96% 35
Toronto W10 96 $18,072,200 $188,252 $194,000 153 86 97% 40
Toronto Central 2,651 $1,165,682,998 $439,714 $378,400 5,488 3,064 98% 33
Toronto C01 1,080 $478,222,081 $442,798 $386,300 2,246 1,288 98% 35
Toronto C02 85 $80,931,790 $952,139 $635,000 218 156 97% 35
Toronto C03 19 $12,187,000 $641,421 $585,000 64 49 101% 20
Toronto C04 43 $22,569,000 $524,860 $380,000 49 22 99% 27
Toronto C06 44 $14,392,900 $327,111 $308,000 99 69 98% 39
Toronto C07 162 $57,257,350 $353,440 $336,500 314 183 98% 40
Toronto C08 374 $163,765,011 $437,874 $393,000 737 340 98% 30
Toronto C09 26 $17,543,200 $674,738 $565,000 53 29 102% 14
Toronto C10 83 $40,668,100 $489,977 $408,000 161 90 99% 28
Toronto C11 66 $16,694,930 $252,953 $238,250 97 35 98% 27
Toronto C12 33 $22,600,914 $684,876 $530,000 59 29 99% 23
Toronto C13 105 $35,987,500 $342,738 $306,000 159 66 99% 24
Toronto C14 336 $131,967,436 $392,760 $366,000 786 439 98% 32
Toronto C15 195 $70,895,787 $363,568 $330,000 446 269 98% 35
Toronto East 740 $197,527,475 $266,929 $255,000 1,158 518 98% 28
Toronto E01 37 $17,074,783 $461,481 $450,000 68 32 99% 25
Toronto E02 26 $12,244,090 $470,927 $398,700 40 22 101% 24
Toronto E03 34 $7,730,000 $227,353 $167,950 38 13 96% 29
Toronto E04 98 $19,978,224 $203,859 $201,500 135 51 98% 31
Toronto E05 105 $29,099,702 $277,140 $265,888 148 57 98% 21
Toronto E06 22 $9,559,800 $434,536 $361,700 51 15 104% 13
Toronto E07 113 $28,716,288 $254,126 $255,000 220 108 97% 31
Toronto E08 49 $10,564,300 $215,598 $180,500 78 38 98% 19
Toronto E09 187 $50,135,938 $268,107 $260,000 270 121 98% 34
Toronto E10 5 $802,000 $160,400 $155,000 27 20 97% 43
Toronto E11 64 $11,622,350 $181,599 $183,500 83 41 97% 29
SUMMARY OF CONDOMINIUM APARTMENT TRANSACTIONS
Condo Market Report, Third Quarter 2014
Page 3
4
Toronto Real Estate Board
Condominium Apartment Market Summary1
71%
14%
10%
Share of Total Condo Apartment Sales By TREB Area
City of Toronto
Peel Region
York Region
Durham Region
Halton Region
Source: TREB
18%
22%
34%
17%
7%
Share of Total Condo Apartment Sales By Bedroom Type
(All Areas)
Bachelor
OneBedroom
OneBedroom +
Den
Two Bedroom
Two Bedroom +
Den
ThreeBedroom +
Source: TREB
1,000,000+
900K-999,999
800K-899,999
700K-799,999
600K-699,999
500K-599,999
400K-499,999
300K-399,999
200K-299,999
0-199,999
Number of Sales
SellingPriceRange
Condo Apartment Sales by Price Range (All Areas)
Source: TREB
$0
$50,000
$100,000
$150,000
$200,000
$250,000
$300,000
$350,000
$400,000
$450,000
$500,000
Bachelor One
Bedroom
One
Bedroom
+Den
Two
Bedroom
Two
Bedroom
+Den
Three
Bedroom
+
Total
Source: Toronto Real Estate Board
Condo Apartment Price by Bedroom Type (All Areas)
Average SellingPrice
MedianSellingPrice
Condo Market Report, Third Quarter 2014
Sub-Market Breakdown: Downtown Core1
Page 3
5
Toronto Real Estate Board
1,000,000+
900K-999,999
800K-899,999
700K-799,999
600K-699,999
500K-599,999
400K-499,999
300K-399,999
200K-299,999
0-199,999
Number of Sales
SellingPriceRange
Condo Apartment Sales byPriceRange(Downtown Core)
Source: TREB
$0
$200,000
$400,000
$600,000
$800,000
$1,000,000
$1,200,000
$1,400,000
Bachelor One
Bedroom
One
Bedroom
+Den
Two
Bedroom
Two
Bedroom
+Den
Three
Bedroom
+
Total
Source: Toronto Real Estate Board
Condo Apartment Price by BedroomType (Downtown Core)
Average SellingPrice
MedianSellingPrice
21
190
325
461
404
53
0 100 200 300 400 500
Three Bedroom +
TwoBedroom +
Den
TwoBedroom
One Bedroom + Den
One Bedroom
Bachelor
Source: TREB
CondoApartment Sales By BedroomType (DowntownCore)
Condo Market Report, Third Quarter 2014
Sub-Market Breakdown: North York City Centre1
Page 3
6
Toronto Real Estate Board
1,000,000+
900K-999,999
800K-899,999
700K-799,999
600K-699,999
500K-599,999
400K-499,999
300K-399,999
200K-299,999
0-199,999
Number of Sales
SellingPriceRange
Condo Apartment Sales by Price Range (North York City
Centre)
Source: TREB
$0
$50,000
$100,000
$150,000
$200,000
$250,000
$300,000
$350,000
$400,000
$450,000
$500,000
Bachelor One
Bedroom
One
Bedroom
+Den
Two
Bedroom
Two
Bedroom
+Den
Three
Bedroom
+
Total
Source: Toronto Real Estate Board
Condo Apartment Price by Bedroom Type (North York
CityCentre)
Average SellingPrice
MedianSellingPrice
33
86
167
119
90
3
0 50 100 150 200
Three Bedroom +
TwoBedroom +
Den
TwoBedroom
One Bedroom + Den
One Bedroom
Bachelor
Source: TREB
Condo Apartment Sales By Bedroom Type (North York
CityCentre)
Condo Market Report, Third Quarter 2014
Sub-Market Breakdown: Mississauga City Centre1
Page 3
7
Toronto Real Estate Board
1,000,000+
900K-999,999
800K-899,999
700K-799,999
600K-699,999
500K-599,999
400K-499,999
300K-399,999
200K-299,999
0-199,999
Number of Sales
SellingPriceRange
Condo Apartment Sales by Price Range (Mississauga City
Centre)
Source: TREB
$0
$50,000
$100,000
$150,000
$200,000
$250,000
$300,000
$350,000
$400,000
$450,000
$500,000
Bachelor One
Bedroom
One
Bedroom
+Den
Two
Bedroom
Two
Bedroom
+Den
Three
Bedroom
+
Total
Source: Toronto Real Estate Board
Condo Apartment Price by Bedroom Type (Mississauga
CityCentre)
Average SellingPrice
MedianSellingPrice
6
85
87
74
38
1
0 20 40 60 80 100
Three Bedroom +
TwoBedroom +
Den
TwoBedroom
One Bedroom + Den
One Bedroom
Bachelor
Source: TREB
Condo Apartment Sales By Bedroom Type (Mississauga
CityCentre)
Condo Market Report, Third Quarter 2014
New Home Market
Page 3
8
Toronto Real Estate Board
Condo Apartment Prices Grew Above the Rate of Inflation in Q3
• The trend for active condominium apartment listings generally follows
the trend for condominium apartment completions (bottom left chart).
• Based on strong completions over the last two years, the number of
active condominium apartment listings has continued to trend near
historic highs. However, sales have also been strong. In the third
quarter, market conditions remained tight enough to exert upward
pressure on selling prices.
• While new condominium apartment completions have been strong
over the last two years, a glut in inventory has not been observed.
This suggests that many buyers have been waiting for new projects to
complete before purchasing these units in order to live in them.
0
2,000
4,000
6,000
8,000
10,000
12,000
14,000
16,000
18,000
20,000
Source: CMHC; TREB Adjustment
Toronto CMA CondominiumApartment Completions
(Annualized,12-Month Moving Average)
0
5,000
10,000
15,000
20,000
25,000
30,000
Source: Toronto Real Estate Board; CMHC
Condominium Apartment Completions and
MLS® Active Listings (Annualized Trends)
Completions Active Listings
-10%
-5%
0%
5%
10%
15%
20%
25%
0%
10%
20%
30%
40%
50%
60%
70%
AnnualMedianPriceGrowth
Sales-to-ActiveListingsRatio
Source: Toronto Real Estate Board
Condominium Apartment Sales-to-Active Listings Ratio and
Median Price Growth (All Areas)
Annual Median PriceChange (Right Scale)
Sales-to-ActiveListings Ratio (Left Scale)
Condo Market Report, Third Quarter 2014
Rental Market Summary
Page 3
9
Toronto Real Estate Board
Strong Growth in Condo Apartment Rentals in Q3 2014
• Condo apartment rental transactions were up on a year-over-year
basis in the third quarter of 2014. For the second quarter in a row, the
number of units listed for rent at some point during the quarter were
also up, but by a lesser amount compared to transactions.
• Average rents for popular one-bedroom and two-bedroom units were
little changed on a year-over-year basis.
• If rental transactions continue to increase relative to the number of
units listed, we will likely see renewed growth in average rents as
competition between renters increases.
0
500
1,000
1,500
2,000
2,500
3,000
3,500
4,000
4,500
5,000
Downtown Core North York City Centre Mississauga
Source: TREB
Number of Units Listed
Q32014 vs. Q3 2013
2014 2013
0
500
1,000
1,500
2,000
2,500
3,000
3,500
Downtown Core North York City Centre Mississauga
Source: TREB
Number of Units Rented
Q32014 vs. Q3 2013
2014 2013
$0
$400
$800
$1,200
$1,600
$2,000
$2,400
$2,800
All TREB Downtown Core North York City
Centre
Mississauga
Source: TREB
AverageTwo-Bedroom Rents
Q32014 vs. Q3 2013
2014 2013
Condo Market Report, Third Quarter 2014
Industrial Leasing
Page 3
Toronto Real Estate Board
10
NOTES
6
Past monthly and year-to-date figures are revised monthly.
1
Sales, dollar volume, average sale prices and median sale prices are based on firm transactions entered into the TorontoMLS system between the first
and last day of the quarter being reported.
2
New listings entered into the TorontoMLS system between the first and last day of the quarter being reported.
3
Active listings as of the end of the last day of the quarter being reported.
4
Ratio of the average selling price to the average listing price for firm transactions entered into the TorontoMLS system between the first and last day of
the quarter being reported.
5
Average number of days on the market for firm transactions entered into the TorontoMLS system between the first and last day of the quarter being
reported.
15.0%
23.3%
27.6%
21.6%
12.6%
Halton Peel Toronto York Durham
Source:CMHC, 2013 Fall Rental Market Survey
Share of GTA Condo
Apartments In Rental
2.7%
1.5%
1.7%
2.7%
0.5%
Halton Peel Toronto York Durham
Source:CMHC, 2013 Fall Rental Market Survey
GTA Condo Apartment
Vacancy Rate

Contenu connexe

En vedette

#WetSàAix 6 Visibilité, marketing web comment générer des contacts comme...
#WetSàAix  6 Visibilité, marketing web comment générer  des contacts comme...#WetSàAix  6 Visibilité, marketing web comment générer  des contacts comme...
#WetSàAix 6 Visibilité, marketing web comment générer des contacts comme...Hervé Bourdon
 
Baromètre Politique - Juin 2016
Baromètre Politique - Juin 2016Baromètre Politique - Juin 2016
Baromètre Politique - Juin 2016Ipsos France
 
Prioritisation simulation
Prioritisation simulationPrioritisation simulation
Prioritisation simulationAlex Gray
 
Election Administration: Complexity and Reform Since 2000
Election Administration:  Complexity and Reform Since 2000Election Administration:  Complexity and Reform Since 2000
Election Administration: Complexity and Reform Since 2000Todd Mercural-Chapman
 
LATAM Digital en ChileAgil via @elisenerman
LATAM Digital en ChileAgil via @elisenermanLATAM Digital en ChileAgil via @elisenerman
LATAM Digital en ChileAgil via @elisenermanChileAgil
 
Haloalkanes & haloarenes part 2
Haloalkanes & haloarenes part 2Haloalkanes & haloarenes part 2
Haloalkanes & haloarenes part 2Manpreet Sharma
 
Risk and Return: Portfolio Theory and Assets Pricing Models
Risk and Return: Portfolio Theory and Assets Pricing ModelsRisk and Return: Portfolio Theory and Assets Pricing Models
Risk and Return: Portfolio Theory and Assets Pricing ModelsPANKAJ PANDEY
 
Testistanbul 2016 - Keynote: "Enterprise Challenges of Test Data" by Rex Black
Testistanbul 2016 - Keynote: "Enterprise Challenges of Test Data" by Rex BlackTestistanbul 2016 - Keynote: "Enterprise Challenges of Test Data" by Rex Black
Testistanbul 2016 - Keynote: "Enterprise Challenges of Test Data" by Rex BlackTurkish Testing Board
 

En vedette (9)

#WetSàAix 6 Visibilité, marketing web comment générer des contacts comme...
#WetSàAix  6 Visibilité, marketing web comment générer  des contacts comme...#WetSàAix  6 Visibilité, marketing web comment générer  des contacts comme...
#WetSàAix 6 Visibilité, marketing web comment générer des contacts comme...
 
Baromètre Politique - Juin 2016
Baromètre Politique - Juin 2016Baromètre Politique - Juin 2016
Baromètre Politique - Juin 2016
 
Prioritisation simulation
Prioritisation simulationPrioritisation simulation
Prioritisation simulation
 
Election Administration: Complexity and Reform Since 2000
Election Administration:  Complexity and Reform Since 2000Election Administration:  Complexity and Reform Since 2000
Election Administration: Complexity and Reform Since 2000
 
LATAM Digital en ChileAgil via @elisenerman
LATAM Digital en ChileAgil via @elisenermanLATAM Digital en ChileAgil via @elisenerman
LATAM Digital en ChileAgil via @elisenerman
 
Haloalkanes & haloarenes part 2
Haloalkanes & haloarenes part 2Haloalkanes & haloarenes part 2
Haloalkanes & haloarenes part 2
 
Risk and Return: Portfolio Theory and Assets Pricing Models
Risk and Return: Portfolio Theory and Assets Pricing ModelsRisk and Return: Portfolio Theory and Assets Pricing Models
Risk and Return: Portfolio Theory and Assets Pricing Models
 
Testistanbul 2016 - Keynote: "Enterprise Challenges of Test Data" by Rex Black
Testistanbul 2016 - Keynote: "Enterprise Challenges of Test Data" by Rex BlackTestistanbul 2016 - Keynote: "Enterprise Challenges of Test Data" by Rex Black
Testistanbul 2016 - Keynote: "Enterprise Challenges of Test Data" by Rex Black
 
E-Marketing de fidélisation
E-Marketing de fidélisationE-Marketing de fidélisation
E-Marketing de fidélisation
 

Dernier

9990771857 Call Girls in Dwarka Sector 10 Delhi (Call Girls) Delhi
9990771857 Call Girls in Dwarka Sector 10 Delhi (Call Girls) Delhi9990771857 Call Girls in Dwarka Sector 10 Delhi (Call Girls) Delhi
9990771857 Call Girls in Dwarka Sector 10 Delhi (Call Girls) Delhidelhimodel235
 
Yashwin Enchante Uppar Kharadi Pune E-Brochue.pdf
Yashwin Enchante Uppar Kharadi Pune  E-Brochue.pdfYashwin Enchante Uppar Kharadi Pune  E-Brochue.pdf
Yashwin Enchante Uppar Kharadi Pune E-Brochue.pdfManishSaxena95
 
Cheap Rate ✨➥9711108085▻✨Call Girls In Bhajanpura (Delhi)
Cheap Rate ✨➥9711108085▻✨Call Girls In Bhajanpura (Delhi)Cheap Rate ✨➥9711108085▻✨Call Girls In Bhajanpura (Delhi)
Cheap Rate ✨➥9711108085▻✨Call Girls In Bhajanpura (Delhi)delhi24hrs1
 
Low Rate Call girls in Sant Nagar{Delhi }8447779280} Service Escorts In South...
Low Rate Call girls in Sant Nagar{Delhi }8447779280} Service Escorts In South...Low Rate Call girls in Sant Nagar{Delhi }8447779280} Service Escorts In South...
Low Rate Call girls in Sant Nagar{Delhi }8447779280} Service Escorts In South...asmaqueen5
 
9990771857 Call Girls Dwarka Sector 8 Delhi (Call Girls ) Delhi
9990771857 Call Girls  Dwarka Sector 8 Delhi (Call Girls ) Delhi9990771857 Call Girls  Dwarka Sector 8 Delhi (Call Girls ) Delhi
9990771857 Call Girls Dwarka Sector 8 Delhi (Call Girls ) Delhidelhimodel235
 
9990771857 Call Girls in Dwarka Sector 2 Delhi (Call Girls) Delhi
9990771857 Call Girls in Dwarka Sector 2 Delhi (Call Girls) Delhi9990771857 Call Girls in Dwarka Sector 2 Delhi (Call Girls) Delhi
9990771857 Call Girls in Dwarka Sector 2 Delhi (Call Girls) Delhidelhimodel235
 
SVN Live 5.6.24 Weekly Property Broadcast
SVN Live 5.6.24 Weekly Property BroadcastSVN Live 5.6.24 Weekly Property Broadcast
SVN Live 5.6.24 Weekly Property BroadcastSVN International Corp.
 
9990771857 Call Girls in Dwarka Sector 6 Delhi (Call Girls) Delhi
9990771857 Call Girls in Dwarka Sector 6 Delhi (Call Girls) Delhi9990771857 Call Girls in Dwarka Sector 6 Delhi (Call Girls) Delhi
9990771857 Call Girls in Dwarka Sector 6 Delhi (Call Girls) Delhidelhimodel235
 
Acibadem Konaklari Uskudar - Listin Turkey
Acibadem Konaklari Uskudar - Listin TurkeyAcibadem Konaklari Uskudar - Listin Turkey
Acibadem Konaklari Uskudar - Listin TurkeyListing Turkey
 
9990771857 Call Girls in Dwarka Sector 08 Delhi (Call Girls) Delhi
9990771857 Call Girls in Dwarka Sector 08 Delhi (Call Girls) Delhi9990771857 Call Girls in Dwarka Sector 08 Delhi (Call Girls) Delhi
9990771857 Call Girls in Dwarka Sector 08 Delhi (Call Girls) Delhidelhimodel235
 
Sector 62, Noida Call girls :8448380779 Noida Escorts | 100% verified
Sector 62, Noida Call girls :8448380779 Noida Escorts | 100% verifiedSector 62, Noida Call girls :8448380779 Noida Escorts | 100% verified
Sector 62, Noida Call girls :8448380779 Noida Escorts | 100% verifiedDelhi Call girls
 
Sector 62, Noida Call girls :8448380779 Model Escorts | 100% verified
Sector 62, Noida Call girls :8448380779 Model Escorts | 100% verifiedSector 62, Noida Call girls :8448380779 Model Escorts | 100% verified
Sector 62, Noida Call girls :8448380779 Model Escorts | 100% verifiedDelhi Call girls
 
Rohan Harita Tathawade Pune Brochure.pdf
Rohan Harita Tathawade Pune Brochure.pdfRohan Harita Tathawade Pune Brochure.pdf
Rohan Harita Tathawade Pune Brochure.pdfabbu831446
 
Vanam At Purva Soukhyam Guduvanchery.pdf.pdf
Vanam At Purva Soukhyam Guduvanchery.pdf.pdfVanam At Purva Soukhyam Guduvanchery.pdf.pdf
Vanam At Purva Soukhyam Guduvanchery.pdf.pdfkratirudram
 
Parksville 96 Surrey Floor Plans May 2024
Parksville 96 Surrey Floor Plans May 2024Parksville 96 Surrey Floor Plans May 2024
Parksville 96 Surrey Floor Plans May 2024VickyAulakh1
 
9990771857 Call Girls in Dwarka Sector 3 Delhi (Call Girls) Delhi
9990771857 Call Girls in Dwarka Sector 3 Delhi (Call Girls) Delhi9990771857 Call Girls in Dwarka Sector 3 Delhi (Call Girls) Delhi
9990771857 Call Girls in Dwarka Sector 3 Delhi (Call Girls) Delhidelhimodel235
 
Kolte Patil Kharadi Pune E Brochure.pdf
Kolte Patil Kharadi Pune E  Brochure.pdfKolte Patil Kharadi Pune E  Brochure.pdf
Kolte Patil Kharadi Pune E Brochure.pdfabbu831446
 
Low Rate ✨➥9711108085▻✨Call Girls In East Of Kailash (E.K) (Delhi)
Low Rate ✨➥9711108085▻✨Call Girls In East Of Kailash (E.K) (Delhi)Low Rate ✨➥9711108085▻✨Call Girls In East Of Kailash (E.K) (Delhi)
Low Rate ✨➥9711108085▻✨Call Girls In East Of Kailash (E.K) (Delhi)delhi24hrs1
 
Goa Call Girls 8617370543 Call Girls In Goa By Russian Call Girl in goa
Goa Call Girls 8617370543 Call Girls In Goa By Russian Call Girl in goaGoa Call Girls 8617370543 Call Girls In Goa By Russian Call Girl in goa
Goa Call Girls 8617370543 Call Girls In Goa By Russian Call Girl in goaNitya salvi
 
Enjoy Night ≽ 8448380779 ≼ Call Girls In Huda City Centre (Gurgaon)
Enjoy Night ≽ 8448380779 ≼ Call Girls In Huda City Centre (Gurgaon)Enjoy Night ≽ 8448380779 ≼ Call Girls In Huda City Centre (Gurgaon)
Enjoy Night ≽ 8448380779 ≼ Call Girls In Huda City Centre (Gurgaon)Delhi Call girls
 

Dernier (20)

9990771857 Call Girls in Dwarka Sector 10 Delhi (Call Girls) Delhi
9990771857 Call Girls in Dwarka Sector 10 Delhi (Call Girls) Delhi9990771857 Call Girls in Dwarka Sector 10 Delhi (Call Girls) Delhi
9990771857 Call Girls in Dwarka Sector 10 Delhi (Call Girls) Delhi
 
Yashwin Enchante Uppar Kharadi Pune E-Brochue.pdf
Yashwin Enchante Uppar Kharadi Pune  E-Brochue.pdfYashwin Enchante Uppar Kharadi Pune  E-Brochue.pdf
Yashwin Enchante Uppar Kharadi Pune E-Brochue.pdf
 
Cheap Rate ✨➥9711108085▻✨Call Girls In Bhajanpura (Delhi)
Cheap Rate ✨➥9711108085▻✨Call Girls In Bhajanpura (Delhi)Cheap Rate ✨➥9711108085▻✨Call Girls In Bhajanpura (Delhi)
Cheap Rate ✨➥9711108085▻✨Call Girls In Bhajanpura (Delhi)
 
Low Rate Call girls in Sant Nagar{Delhi }8447779280} Service Escorts In South...
Low Rate Call girls in Sant Nagar{Delhi }8447779280} Service Escorts In South...Low Rate Call girls in Sant Nagar{Delhi }8447779280} Service Escorts In South...
Low Rate Call girls in Sant Nagar{Delhi }8447779280} Service Escorts In South...
 
9990771857 Call Girls Dwarka Sector 8 Delhi (Call Girls ) Delhi
9990771857 Call Girls  Dwarka Sector 8 Delhi (Call Girls ) Delhi9990771857 Call Girls  Dwarka Sector 8 Delhi (Call Girls ) Delhi
9990771857 Call Girls Dwarka Sector 8 Delhi (Call Girls ) Delhi
 
9990771857 Call Girls in Dwarka Sector 2 Delhi (Call Girls) Delhi
9990771857 Call Girls in Dwarka Sector 2 Delhi (Call Girls) Delhi9990771857 Call Girls in Dwarka Sector 2 Delhi (Call Girls) Delhi
9990771857 Call Girls in Dwarka Sector 2 Delhi (Call Girls) Delhi
 
SVN Live 5.6.24 Weekly Property Broadcast
SVN Live 5.6.24 Weekly Property BroadcastSVN Live 5.6.24 Weekly Property Broadcast
SVN Live 5.6.24 Weekly Property Broadcast
 
9990771857 Call Girls in Dwarka Sector 6 Delhi (Call Girls) Delhi
9990771857 Call Girls in Dwarka Sector 6 Delhi (Call Girls) Delhi9990771857 Call Girls in Dwarka Sector 6 Delhi (Call Girls) Delhi
9990771857 Call Girls in Dwarka Sector 6 Delhi (Call Girls) Delhi
 
Acibadem Konaklari Uskudar - Listin Turkey
Acibadem Konaklari Uskudar - Listin TurkeyAcibadem Konaklari Uskudar - Listin Turkey
Acibadem Konaklari Uskudar - Listin Turkey
 
9990771857 Call Girls in Dwarka Sector 08 Delhi (Call Girls) Delhi
9990771857 Call Girls in Dwarka Sector 08 Delhi (Call Girls) Delhi9990771857 Call Girls in Dwarka Sector 08 Delhi (Call Girls) Delhi
9990771857 Call Girls in Dwarka Sector 08 Delhi (Call Girls) Delhi
 
Sector 62, Noida Call girls :8448380779 Noida Escorts | 100% verified
Sector 62, Noida Call girls :8448380779 Noida Escorts | 100% verifiedSector 62, Noida Call girls :8448380779 Noida Escorts | 100% verified
Sector 62, Noida Call girls :8448380779 Noida Escorts | 100% verified
 
Sector 62, Noida Call girls :8448380779 Model Escorts | 100% verified
Sector 62, Noida Call girls :8448380779 Model Escorts | 100% verifiedSector 62, Noida Call girls :8448380779 Model Escorts | 100% verified
Sector 62, Noida Call girls :8448380779 Model Escorts | 100% verified
 
Rohan Harita Tathawade Pune Brochure.pdf
Rohan Harita Tathawade Pune Brochure.pdfRohan Harita Tathawade Pune Brochure.pdf
Rohan Harita Tathawade Pune Brochure.pdf
 
Vanam At Purva Soukhyam Guduvanchery.pdf.pdf
Vanam At Purva Soukhyam Guduvanchery.pdf.pdfVanam At Purva Soukhyam Guduvanchery.pdf.pdf
Vanam At Purva Soukhyam Guduvanchery.pdf.pdf
 
Parksville 96 Surrey Floor Plans May 2024
Parksville 96 Surrey Floor Plans May 2024Parksville 96 Surrey Floor Plans May 2024
Parksville 96 Surrey Floor Plans May 2024
 
9990771857 Call Girls in Dwarka Sector 3 Delhi (Call Girls) Delhi
9990771857 Call Girls in Dwarka Sector 3 Delhi (Call Girls) Delhi9990771857 Call Girls in Dwarka Sector 3 Delhi (Call Girls) Delhi
9990771857 Call Girls in Dwarka Sector 3 Delhi (Call Girls) Delhi
 
Kolte Patil Kharadi Pune E Brochure.pdf
Kolte Patil Kharadi Pune E  Brochure.pdfKolte Patil Kharadi Pune E  Brochure.pdf
Kolte Patil Kharadi Pune E Brochure.pdf
 
Low Rate ✨➥9711108085▻✨Call Girls In East Of Kailash (E.K) (Delhi)
Low Rate ✨➥9711108085▻✨Call Girls In East Of Kailash (E.K) (Delhi)Low Rate ✨➥9711108085▻✨Call Girls In East Of Kailash (E.K) (Delhi)
Low Rate ✨➥9711108085▻✨Call Girls In East Of Kailash (E.K) (Delhi)
 
Goa Call Girls 8617370543 Call Girls In Goa By Russian Call Girl in goa
Goa Call Girls 8617370543 Call Girls In Goa By Russian Call Girl in goaGoa Call Girls 8617370543 Call Girls In Goa By Russian Call Girl in goa
Goa Call Girls 8617370543 Call Girls In Goa By Russian Call Girl in goa
 
Enjoy Night ≽ 8448380779 ≼ Call Girls In Huda City Centre (Gurgaon)
Enjoy Night ≽ 8448380779 ≼ Call Girls In Huda City Centre (Gurgaon)Enjoy Night ≽ 8448380779 ≼ Call Girls In Huda City Centre (Gurgaon)
Enjoy Night ≽ 8448380779 ≼ Call Girls In Huda City Centre (Gurgaon)
 

Third Quarter Condo Report 2014

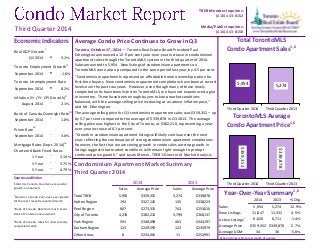
  • 1. Total TorontoMLS Condo Apartment Sales1,6 Condominium Apartment Market Summary Third Quarter 2014 Sales Average Price Sales Average Price Total TREB 5,954 $359,352 5,274 $339,878 Halton Region 192 $327,145 135 $338,223 Peel Region 807 $273,331 743 $253,010 City of Toronto 4,233 $382,210 3,799 $360,137 York Region 591 $348,098 463 $343,197 Durham Region 123 $249,593 123 $235,979 Other Areas 8 $234,061 11 $252,991 2014 2013 TREB Member Inquiries: (416) 443-8152 Media/Public Inquiries: (416) 443-8158 Average Condo Price Continues to Grow in Q3 Toronto, October 17, 2014 — Toronto Real Estate Board President Paul Etherington announced a 12.9 per cent year-over-year increase in condominium apartment sales through the TorontoMLS system in the third quarter of 2014. Sales amounted to 5,954. New listings of condominium apartments on TorontoMLS were also up compared to the same period last year, by 4.5 per cent. “Condominium apartments represent an affordable home ownership option for first-time buyers. New condominium apartment completions have been at record levels over the past two years. However, even though many of these newly completed units have been listed on TorontoMLS, we have not experienced a glut in inventory. There have been enough buyers to keep market conditions balanced, with the average selling price increasing at an above-inflation pace,” said Mr. Etherington. The average selling price for Q3 condominium apartment sales was $359,352 – up by 5.7 per cent compared to the average of $339,878 in Q3 2013. The average selling price was highest in the City of Toronto, at $382,210, representing a year- over-year increase of 6.1 per cent. “Growth in condominium apartment listings will likely continue over the next year, reflecting the continuation of strong condominium apartment completions. However, the fact that we are seeing growth in condo sales outstrip growth in listings suggests that market conditions will remain tight enough to prompt continued price growth,” said Jason Mercer, TREB’s Director of Market Analysis. Third Quarter 2014 Real GDP Growthi Q2 2014 t 3.1% Toronto Employment Growthii September 2014 u -1.6% Toronto Unemployment Rate September 2014 u 8.2% Inflation (Yr./Yr. CPI Growth)ii August 2014 q 2.1% Bank of Canada Overnight Rateiii September 2014 q 1.0% Prime Rate iv September 2014 q 3.0% Mortgage Rates (Sept. 2014) iv Chartered Bank Fixed Rates 1 Year q 3.14% 3 Year q 3.75% 5 Year q 4.79% Sources and Notes: Economic Indicators i Statistics Canada, Quarter-over-quarter growth, annualized ii Statistics Canada, Year-over-year growth for the most recently reported month iii Bank of Canada, Rate from most recent Bank of Canada announcement iv Bank of Canada, rates for most recently completed month 5,954 5,274 ThirdQuarter 2014 ThirdQuarter 2013 $359,352 $339,878 ThirdQuarter 2014 ThirdQuarter 2013 TorontoMLS Average Condo Apartment Price1,6 2014 2013 % Chg. Sales 5,954 5,274 12.9% New Listings 11,847 11,332 4.5% Active Listings i 6,620 6,711 -1.4% Average Price $359,352 $339,878 5.7% Average DOM 34 36 -5.6% i Active listings refer to last month of quarter. Year-Over-Year Summary 1,6
  • 2. Condo Market Report, Third Quarter 2014 Industrial Leasing Page 3 2 Toronto Real Estate Board ALL TREB AREAS THIRD QUARTER 2014 Sales1 Dollar Volume1 Average Price1 Median Price1 New Listings2 Active Listings3 Avg. SP/LP4 Avg. DOM5 TREB Total 5,954 $2,139,582,963 $359,352 $320,000 11,847 6,620 98% 34- - - - - - - - Halton Region 192 $62,811,840 $327,145 $298,743 305 184 98% 35 Burlington 67 $20,744,624 $309,621 $265,000 95 59 98% 38 Halton Hills 8 $2,317,800 $289,725 $310,250 11 3 98% 18 Milton 34 $9,734,630 $286,313 $300,000 53 22 99% 35 Oakville 83 $30,014,786 $361,624 $321,000 146 100 98% 33- - - - - - - - Peel Region 807 $220,577,861 $273,331 $255,000 1,659 933 97% 36 Brampton 110 $25,426,798 $231,153 $225,000 191 91 98% 31 Caledon 3 $1,224,000 $408,000 $422,000 3 2 98% 60 Mississauga 694 $193,927,063 $279,434 $262,000 1,465 840 97% 37- - - - - - - - City of Toronto 4,233 $1,617,894,918 $382,210 $340,000 8,323 4,579 98% 33 - - - - - - - - York Region 591 $205,725,904 $348,098 $325,000 1,349 825 97% 40 Aurora 22 $7,507,600 $341,255 $316,350 38 18 97% 32 E. Gwillimbury 0 - - - - - - - Georgina 1 $263,000 $263,000 $263,000 1 1 101% 16 King 3 $1,017,000 $339,000 $307,000 32 27 97% 19 Markham 207 $69,830,200 $337,344 $318,000 475 277 98% 40 Newmarket 15 $4,163,500 $277,567 $275,000 19 9 98% 21 Richmond Hill 162 $53,921,176 $332,847 $315,000 402 241 98% 38 Vaughan 177 $67,213,428 $379,737 $360,000 381 247 97% 44 Whitchurch-Stouffville 4 $1,810,000 $452,500 $451,500 1 5 97% 72- - - - - - - - Durham Region 123 $30,699,950 $249,593 $237,000 198 79 98% 24 Ajax 24 $5,723,550 $238,481 $230,000 31 10 99% 16 Brock 0 - - - - - - - Clarington 22 $4,629,900 $210,450 $197,000 33 15 98% 19 Oshawa 17 $3,571,050 $210,062 $179,000 43 23 97% 36 Pickering 30 $8,229,750 $274,325 $269,950 54 18 100% 17 Scugog 2 $694,000 $347,000 $347,000 1 - 98% 47 Uxbridge 4 $1,093,000 $273,250 $284,000 6 3 98% 28 Whitby 24 $6,758,700 $281,613 $274,250 30 10 98% 32- - - - - - - - Dufferin County 3 $826,000 $275,333 $240,000 7 9 97% 32 Orangeville 3 $826,000 $275,333 $240,000 7 9 97% 32- - - - - - - - Simcoe County 5 $1,046,490 $209,298 $210,000 6 11 98% 49 Adjala-Tosorontio 0 - - - - - - - Bradford West Gwillimbury 3 $654,990 $218,330 $210,000 2 4 98% 52 Essa 0 - - - - - - - Innisfil 0 - - - - - - - New Tecumseth 2 $391,500 $195,750 $195,750 4 7 98% 44 ! TURN PAGE FOR CITY OF TORONTO TABLES OR CLICK HERE: SUMMARY OF CONDOMINIUM APARTMENT TRANSACTIONS
  • 3. Condo Market Report, Third Quarter 2014 Industrial Leasing Page 3 3 Toronto Real Estate Board CITY OF TORONTO THIRD QUARTER 2014 Sales 1 Dollar Volume 1 Average Price 1 Median Price 1 New Listings 2 Active Listings 3 Avg. SP/LP 4 Avg. DOM 5 TREB Total 5,954 $2,139,582,963 $359,352 $320,000 11,847 6,620 98% 34 City of Toronto Total 4,233 $1,617,894,918 $382,210 $340,000 8,323 4,579 98% 33 Toronto West 842 $254,684,445 $302,476 $289,900 1,677 997 98% 38 Toronto W01 54 $20,503,289 $379,691 $344,000 171 112 99% 37 Toronto W02 42 $16,894,190 $402,243 $389,000 77 44 100% 22 Toronto W03 20 $5,714,000 $285,700 $289,500 24 10 96% 29 Toronto W04 58 $12,053,450 $207,818 $183,500 117 66 96% 36 Toronto W05 79 $16,007,925 $202,632 $174,000 166 111 97% 39 Toronto W06 181 $68,041,533 $375,920 $344,800 454 289 97% 42 Toronto W07 6 $2,943,000 $490,500 $415,000 14 8 99% 21 Toronto W08 255 $83,538,458 $327,602 $300,000 425 226 98% 38 Toronto W09 51 $10,916,400 $214,047 $180,000 76 45 96% 35 Toronto W10 96 $18,072,200 $188,252 $194,000 153 86 97% 40 Toronto Central 2,651 $1,165,682,998 $439,714 $378,400 5,488 3,064 98% 33 Toronto C01 1,080 $478,222,081 $442,798 $386,300 2,246 1,288 98% 35 Toronto C02 85 $80,931,790 $952,139 $635,000 218 156 97% 35 Toronto C03 19 $12,187,000 $641,421 $585,000 64 49 101% 20 Toronto C04 43 $22,569,000 $524,860 $380,000 49 22 99% 27 Toronto C06 44 $14,392,900 $327,111 $308,000 99 69 98% 39 Toronto C07 162 $57,257,350 $353,440 $336,500 314 183 98% 40 Toronto C08 374 $163,765,011 $437,874 $393,000 737 340 98% 30 Toronto C09 26 $17,543,200 $674,738 $565,000 53 29 102% 14 Toronto C10 83 $40,668,100 $489,977 $408,000 161 90 99% 28 Toronto C11 66 $16,694,930 $252,953 $238,250 97 35 98% 27 Toronto C12 33 $22,600,914 $684,876 $530,000 59 29 99% 23 Toronto C13 105 $35,987,500 $342,738 $306,000 159 66 99% 24 Toronto C14 336 $131,967,436 $392,760 $366,000 786 439 98% 32 Toronto C15 195 $70,895,787 $363,568 $330,000 446 269 98% 35 Toronto East 740 $197,527,475 $266,929 $255,000 1,158 518 98% 28 Toronto E01 37 $17,074,783 $461,481 $450,000 68 32 99% 25 Toronto E02 26 $12,244,090 $470,927 $398,700 40 22 101% 24 Toronto E03 34 $7,730,000 $227,353 $167,950 38 13 96% 29 Toronto E04 98 $19,978,224 $203,859 $201,500 135 51 98% 31 Toronto E05 105 $29,099,702 $277,140 $265,888 148 57 98% 21 Toronto E06 22 $9,559,800 $434,536 $361,700 51 15 104% 13 Toronto E07 113 $28,716,288 $254,126 $255,000 220 108 97% 31 Toronto E08 49 $10,564,300 $215,598 $180,500 78 38 98% 19 Toronto E09 187 $50,135,938 $268,107 $260,000 270 121 98% 34 Toronto E10 5 $802,000 $160,400 $155,000 27 20 97% 43 Toronto E11 64 $11,622,350 $181,599 $183,500 83 41 97% 29 SUMMARY OF CONDOMINIUM APARTMENT TRANSACTIONS
  • 4. Condo Market Report, Third Quarter 2014 Page 3 4 Toronto Real Estate Board Condominium Apartment Market Summary1 71% 14% 10% Share of Total Condo Apartment Sales By TREB Area City of Toronto Peel Region York Region Durham Region Halton Region Source: TREB 18% 22% 34% 17% 7% Share of Total Condo Apartment Sales By Bedroom Type (All Areas) Bachelor OneBedroom OneBedroom + Den Two Bedroom Two Bedroom + Den ThreeBedroom + Source: TREB 1,000,000+ 900K-999,999 800K-899,999 700K-799,999 600K-699,999 500K-599,999 400K-499,999 300K-399,999 200K-299,999 0-199,999 Number of Sales SellingPriceRange Condo Apartment Sales by Price Range (All Areas) Source: TREB $0 $50,000 $100,000 $150,000 $200,000 $250,000 $300,000 $350,000 $400,000 $450,000 $500,000 Bachelor One Bedroom One Bedroom +Den Two Bedroom Two Bedroom +Den Three Bedroom + Total Source: Toronto Real Estate Board Condo Apartment Price by Bedroom Type (All Areas) Average SellingPrice MedianSellingPrice
  • 5. Condo Market Report, Third Quarter 2014 Sub-Market Breakdown: Downtown Core1 Page 3 5 Toronto Real Estate Board 1,000,000+ 900K-999,999 800K-899,999 700K-799,999 600K-699,999 500K-599,999 400K-499,999 300K-399,999 200K-299,999 0-199,999 Number of Sales SellingPriceRange Condo Apartment Sales byPriceRange(Downtown Core) Source: TREB $0 $200,000 $400,000 $600,000 $800,000 $1,000,000 $1,200,000 $1,400,000 Bachelor One Bedroom One Bedroom +Den Two Bedroom Two Bedroom +Den Three Bedroom + Total Source: Toronto Real Estate Board Condo Apartment Price by BedroomType (Downtown Core) Average SellingPrice MedianSellingPrice 21 190 325 461 404 53 0 100 200 300 400 500 Three Bedroom + TwoBedroom + Den TwoBedroom One Bedroom + Den One Bedroom Bachelor Source: TREB CondoApartment Sales By BedroomType (DowntownCore)
  • 6. Condo Market Report, Third Quarter 2014 Sub-Market Breakdown: North York City Centre1 Page 3 6 Toronto Real Estate Board 1,000,000+ 900K-999,999 800K-899,999 700K-799,999 600K-699,999 500K-599,999 400K-499,999 300K-399,999 200K-299,999 0-199,999 Number of Sales SellingPriceRange Condo Apartment Sales by Price Range (North York City Centre) Source: TREB $0 $50,000 $100,000 $150,000 $200,000 $250,000 $300,000 $350,000 $400,000 $450,000 $500,000 Bachelor One Bedroom One Bedroom +Den Two Bedroom Two Bedroom +Den Three Bedroom + Total Source: Toronto Real Estate Board Condo Apartment Price by Bedroom Type (North York CityCentre) Average SellingPrice MedianSellingPrice 33 86 167 119 90 3 0 50 100 150 200 Three Bedroom + TwoBedroom + Den TwoBedroom One Bedroom + Den One Bedroom Bachelor Source: TREB Condo Apartment Sales By Bedroom Type (North York CityCentre)
  • 7. Condo Market Report, Third Quarter 2014 Sub-Market Breakdown: Mississauga City Centre1 Page 3 7 Toronto Real Estate Board 1,000,000+ 900K-999,999 800K-899,999 700K-799,999 600K-699,999 500K-599,999 400K-499,999 300K-399,999 200K-299,999 0-199,999 Number of Sales SellingPriceRange Condo Apartment Sales by Price Range (Mississauga City Centre) Source: TREB $0 $50,000 $100,000 $150,000 $200,000 $250,000 $300,000 $350,000 $400,000 $450,000 $500,000 Bachelor One Bedroom One Bedroom +Den Two Bedroom Two Bedroom +Den Three Bedroom + Total Source: Toronto Real Estate Board Condo Apartment Price by Bedroom Type (Mississauga CityCentre) Average SellingPrice MedianSellingPrice 6 85 87 74 38 1 0 20 40 60 80 100 Three Bedroom + TwoBedroom + Den TwoBedroom One Bedroom + Den One Bedroom Bachelor Source: TREB Condo Apartment Sales By Bedroom Type (Mississauga CityCentre)
  • 8. Condo Market Report, Third Quarter 2014 New Home Market Page 3 8 Toronto Real Estate Board Condo Apartment Prices Grew Above the Rate of Inflation in Q3 • The trend for active condominium apartment listings generally follows the trend for condominium apartment completions (bottom left chart). • Based on strong completions over the last two years, the number of active condominium apartment listings has continued to trend near historic highs. However, sales have also been strong. In the third quarter, market conditions remained tight enough to exert upward pressure on selling prices. • While new condominium apartment completions have been strong over the last two years, a glut in inventory has not been observed. This suggests that many buyers have been waiting for new projects to complete before purchasing these units in order to live in them. 0 2,000 4,000 6,000 8,000 10,000 12,000 14,000 16,000 18,000 20,000 Source: CMHC; TREB Adjustment Toronto CMA CondominiumApartment Completions (Annualized,12-Month Moving Average) 0 5,000 10,000 15,000 20,000 25,000 30,000 Source: Toronto Real Estate Board; CMHC Condominium Apartment Completions and MLS® Active Listings (Annualized Trends) Completions Active Listings -10% -5% 0% 5% 10% 15% 20% 25% 0% 10% 20% 30% 40% 50% 60% 70% AnnualMedianPriceGrowth Sales-to-ActiveListingsRatio Source: Toronto Real Estate Board Condominium Apartment Sales-to-Active Listings Ratio and Median Price Growth (All Areas) Annual Median PriceChange (Right Scale) Sales-to-ActiveListings Ratio (Left Scale)
  • 9. Condo Market Report, Third Quarter 2014 Rental Market Summary Page 3 9 Toronto Real Estate Board Strong Growth in Condo Apartment Rentals in Q3 2014 • Condo apartment rental transactions were up on a year-over-year basis in the third quarter of 2014. For the second quarter in a row, the number of units listed for rent at some point during the quarter were also up, but by a lesser amount compared to transactions. • Average rents for popular one-bedroom and two-bedroom units were little changed on a year-over-year basis. • If rental transactions continue to increase relative to the number of units listed, we will likely see renewed growth in average rents as competition between renters increases. 0 500 1,000 1,500 2,000 2,500 3,000 3,500 4,000 4,500 5,000 Downtown Core North York City Centre Mississauga Source: TREB Number of Units Listed Q32014 vs. Q3 2013 2014 2013 0 500 1,000 1,500 2,000 2,500 3,000 3,500 Downtown Core North York City Centre Mississauga Source: TREB Number of Units Rented Q32014 vs. Q3 2013 2014 2013 $0 $400 $800 $1,200 $1,600 $2,000 $2,400 $2,800 All TREB Downtown Core North York City Centre Mississauga Source: TREB AverageTwo-Bedroom Rents Q32014 vs. Q3 2013 2014 2013
  • 10. Condo Market Report, Third Quarter 2014 Industrial Leasing Page 3 Toronto Real Estate Board 10 NOTES 6 Past monthly and year-to-date figures are revised monthly. 1 Sales, dollar volume, average sale prices and median sale prices are based on firm transactions entered into the TorontoMLS system between the first and last day of the quarter being reported. 2 New listings entered into the TorontoMLS system between the first and last day of the quarter being reported. 3 Active listings as of the end of the last day of the quarter being reported. 4 Ratio of the average selling price to the average listing price for firm transactions entered into the TorontoMLS system between the first and last day of the quarter being reported. 5 Average number of days on the market for firm transactions entered into the TorontoMLS system between the first and last day of the quarter being reported. 15.0% 23.3% 27.6% 21.6% 12.6% Halton Peel Toronto York Durham Source:CMHC, 2013 Fall Rental Market Survey Share of GTA Condo Apartments In Rental 2.7% 1.5% 1.7% 2.7% 0.5% Halton Peel Toronto York Durham Source:CMHC, 2013 Fall Rental Market Survey GTA Condo Apartment Vacancy Rate