Scaling API-first – The story of a global engineering organization
09 08 11 Web 2.0 Weekly
1. SOFTWARE & SERVICES 11 AUGUST 2009
DAVID SHORE, CFA, MBA 416.860.6784
WEB 2.O WEEKLY david.shore@researchcapital.com
Arun Thomas (Associate) 416.860.7666
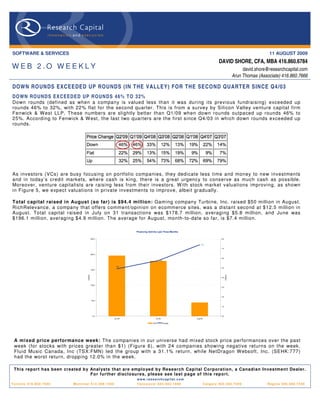
DOWN RO UNDS EXCEEDED UP ROUNDS (IN THE VALLEY) FOR THE SECOND QUARTER SINCE Q4/03
DO W N RO UN D S E X C E ED E D UP R O UN D S 46% T O 32%
Down rounds (defined as when a company is valued less than it was during its previous fundraising) exceeded up
rounds 46% to 32%, with 22% flat for the second quarter. This is from a survey by Silicon Valley venture capital firm
Fenwick & W est LLP. These numbers are slightly better than Q1/09 when down rounds outpaced up rounds 46% to
25%. According to Fenwick & W est, the last two quarters are the first since Q4/03 in which down rounds exceeded up
rounds.
As investors (VCs) are busy focusing on portfolio companies, they dedicate less time and money to new investments
and in today’s credit markets, where cash is king, there is a great urgency to conserve as much cash as possible.
Moreover, venture capitalists are raising less from their investors. W ith stock market valuations improving, as shown
in Figure 5, we expect valuations in private investments to improve, albeit gradually.
Total capital raised in August (so far) is $94.4 million: Gaming company Turbine, Inc. raised $50 million in August.
RichRelevance, a company that offers comment/opinion on ecommerce sites, was a distant second at $12.5 million in
August. Total capital raised in July on 31 transactions was $178.7 million, averaging $5.8 million, and June was
$196.1 million, averaging $4.9 million. The average for August, month-to-date so far, is $7.4 million.
Financing Activity Last Three Months
250.0 8.0
7.4
7.0
200.0
6.0
5.8
4.9
5.0
150.0
(US$m)
(US$m)
4.0
100.0
3.0
2.0
50.0
1.0
0.0 0.0
Jun-09 Jul-09 Aug-09
Total Average
A mixed price performance week: The companies in our universe had mixed stock price performances over the past
week (for stocks with prices greater than $1) (Figure 6), with 24 companies showing negative returns on the week.
Fluid Music Canada, Inc (TSX:FMN) led the group with a 31.1% return, while NetDragon W ebsoft, Inc. (SEHK:777)
had the worst return, dropping 12.0% in the week.
This report has been created b y Anal ysts that are emplo yed b y Research Capital Corporation, a Canadian Investment Dealer.
For further disclosures, please see last page of this report.
w w w . r e s e a rc h c a p i t a l . c o m
T o ro n t o 4 1 6 . 8 6 0 . 7 6 0 0 Montreal 514.399.1500 Vancouver 604.662.1800 Calgary 403.265.7400 Regina 306.566.7550
2. Page 2
THE WEB 2.0 UNIVERSE
Ninety-one public Web 2.0 companies identified: Our W eb 2.0 universe contains 91 companies, with a combined market
cap of ~$63 billion (Figure 1). The median market cap for the group is ~$61 million, with average trailing revenue of
~$157.3 million (median $56.2 million). The companies are also generally profitable, with a median EBITDA margin of
13.1%. On a valuation basis, the overall average is 5.0x trailing revenue (median 1.9x) and 11.1x trailing EBITDA (median
9.8x). Twenty-one of the companies have more than 500 employees.
C omparable C ompany Analys is > Web 2.0
Trading C urrent US D Market US D L TM Total US D L TM Total E B ITDA TE V/L TM TE V/L TM
C ompany Name L TM as of Ticker E xc hange C urrency HQ P rice C ap ($m) R ev ($m) E B ITDA ($m) % R evenue E B ITDA E mployees
Accelerize New Media , Inc. 3/31/2009 AC LZ OT C B B US D United S ta tes 0. 57 15. 8 4. 1 (4.4) NM 5. 1x - 11
Actoz S oft C o. , Ltd. 3/31/2009 A052790 K OS E KR W S outh K orea 23,550 165. 3 94. 0 20. 4 21. 7% 1. 4x 6. 6x NA
AQ Interactive, Inc. 3/31/2009 3838 TS E JPY J a pan 53,600 29. 9 63. 5 4.0 6.3% 0. 0x 0. 3x NA
As s ociated Media Holdings Inc. 6/30/2007 AS MH OT C P K US D United S ta tes 0. 01 0.6 0. 1 (2.3) NM 15.6x - 3
B igs tring C orp. 3/31/2009 BS GC OT C B B US D United S ta tes 0. 03 1.3 0. 1 (2.0) NM 35.7x - 4
B eta wave C orporation 3/31/2009 B W AV OT C B B US D United S ta tes 0. 08 2.2 8. 4 (12. 6) NM - - 53
B eyond C ommerce, Inc. 3/31/2009 B Y OC OT C B B US D United S ta tes 0. 30 13. 5 7. 1 (9.5) NM 2. 6x - 69
B right T hings plc 9/30/2008 AIM: B G T AIM GBP United K ingdom 0. 02 4.8 0. 3 (1.9) NM 17.6x - 9
B roa dW ebAs ia Inc. 9/30/2008 BWBA OT C P K US D United S ta tes 0. 23 19. 5 0. 0 (4.6) NM - - 46
C DC C orp. 3/31/2009 C HIN. A Na s daqG S US D Hong K ong 2. 76 292. 3 389.9 30. 8 7.9% 0. 8x 9. 9x 2, 227
C hangyou. com L imited 6/30/2009 C Y OU Na s daqG S US D C hina 39. 35 2,164. 4 241.2 147.2 61. 0% 7. 8x 12. 8x 628
C hina G a teway C orporation 9/30/2008 CGWY OT C P K US D United S ta tes 0. 02 0.3 6. 7 (6.6) -98. 9% 0. 0x - 37
C hines e G amer Interna tiona l 3/31/2009 G T S M: 3083 GTS M TWD T aiwa n 430 1,101. 7 56. 3 31. 5 56. 0% 18.4x 32. 9x NA
C LIC K E R Inc. 5/31/2009 C LK Z OT C B B US D United S ta tes 0. 01 0.6 2. 5 (1.2) -45. 8% 0. 3x - 22
C ornerW orld C orpora tion 1/31/2009 CWR L OT C B B US D United S ta tes 0. 06 3.5 1. 3 NM NM 3. 8x - NA
C yberplex Inc. 3/31/2009 T S X :C X TS X C AD C anada 2 102. 3 75. 2 7.8 10. 3% 1. 3x 12. 6x NA
DADA S pA 3/31/2009 C M: DA CM E UR Italy 6. 10 139. 8 237.6 34. 8 14. 6% 0. 8x 5. 5x 578
DXN Holdings B hd 2/28/2009 DX N K LS E MY R Ma la ys ia 0. 47 30. 9 78. 9 10. 9 13. 8% 0. 6x 4. 1x NA
Dibz International, Inc. NA DIB Z OT C P K US D United S ta tes 0. 00 0.0 NA NM NM - - NA
DigitalP os t Interactive, Inc. 3/31/2009 DG LP OT C B B US D United S ta tes 0. 06 4.4 0. 7 (2.6) NM 8. 2x - 7
DigitalT own, Inc. 5/31/2009 DG T W OT C B B US D United S ta tes 1. 30 35. 6 NM (2.5) NM - - 3
Dolphin Digital Media , Inc. 3/31/2009 DP DM OT C B B US D United S ta tes 0. 40 20. 7 0. 8 (3.7) NM 28.0x - NA
E olith C o. Ltd. 12/31/2008 A041060 K OS E KR W S outh K orea 820 48. 4 15. 0 (3.5) -23. 6% 3. 4x - NA
E xtens ions , Inc. 3/31/2009 E XT I OT C P K US D United S ta tes 0. 20 8.9 NM NM NM - - 2
F luid Mus ic C a nada , Inc. 3/31/2009 T S X :F MN TS X C AD United S ta tes 1. 18 57. 2 5. 0 (6.9) NM 9. 7x - NA
F rogs ter Interactive P ictures AG 12/31/2008 FRG XT R A E UR G ermany 14. 50 51. 8 3. 2 (6.2) NM 15.4x - NA
G ama nia Digita l E ntertainment C o., Ltd. 3/31/2009 6180 GTS M TWD T aiwa n 58. 00 268. 3 126.2 21. 0 16. 6% 1. 9x 11. 7x NA
G ameOn C o Ltd. 3/31/2009 3812 TS E JPY J a pan 103,700 103. 0 75. 6 17. 9 23. 7% 0. 6x 2. 4x NA
G eoS entric O yj 3/31/2009 G E O 1V HL S E E UR F inland 0. 05 63. 5 6. 0 (15. 5) NM 9. 9x - 108
G iant Interactive G roup, Inc. 3/31/2009 GA NY S E US D C hina 8 1,818. 1 218.9 NM NM - - 1, 570
G iga Media Ltd. 3/31/2009 G IG M Na s daqG S US D T aiwa n 4. 94 269. 3 183.6 NM NM 1. 1x - 751
G ravity C o., Ltd 3/31/2009 GR VY Na s daqG M US D S outh K orea 2. 10 58. 4 46. 6 12. 8 27. 5% - - 469
G ree, Inc. 6/30/2009 T S E : 3632 TS E JPY J a pan 7,740 1,779. 8 143.3 86. 1 60. 1% 11.7x 19. 4x NA
G ungHo O nline E ntertainment, Inc. 3/31/2009 3765 OS E JPY J a pan 202,000 237. 7 105.9 19. 0 18. 0% 2. 0x 11. 0x NA
HanbitS oft, Inc. 3/31/2009 A047080 K OS E KR W S outh K orea 4,305 76. 8 56. 2 (15. 1) -26. 8% 1. 1x - NA
IAC /InterActiveC orp. 6/30/2009 IAC I Na s daqG S US D United S ta tes 18. 50 2,449. 4 1, 392. 3 52. 7 3.8% 0. 5x 13. 5x 3, 200
IAS E nergy, Inc. 1/31/2009 IAS C . A OT C B B US D C anada 0. 18 12. 6 0. 0 (0.8) NM - - NA
is eemedia Inc. 3/31/2009 IE E T S XV C AD C anada 0. 07 3.3 1. 6 (5.1) NM 1. 5x - NA
J umbuck E nterta inment P ty Ltd. 12/31/2008 AS X :J MB AS X AUD Aus tralia 0. 37 15. 1 15. 0 5.6 37. 2% 0. 7x 1. 8x 72
K AB Dis tribution Inc. 3/31/2009 T S X :K AB TS X C AD C anada 1 82. 7 76. 0 9.0 11. 9% 1. 2x 9. 7x NA
K ings oft C o. Ltd. 3/31/2009 3888 S E HK HK D C hina 8 1,134. 8 129.0 52. 0 40. 3% 8. 7x 21. 7x 2, 271
Lingo Media C orporation 3/31/2009 T S X V :LM T S XV C AD C anada 1. 12 12. 9 0. 9 (1.6) NM 12.4x - NA
LiveW orld Inc. 3/31/2009 LVW D OT C P K US D United S ta tes 0. 06 1.9 11. 4 (0.0) -0.4% 0. 1x - NA
LookS mart, Ltd. 6/30/2009 L OO K Na s daqG M US D United S ta tes 1. 25 21. 4 56. 8 (4.7) -8.2% - - 90
Magnitude Information S ys tems Inc. 3/31/2009 MAG Y OT C B B US D United S ta tes 0. 01 2.7 0. 1 (3.1) NM - - 14
Mixi, Inc. 6/30/2009 2121 TS E JPY J a pan 618000. 00 976. 1 125.7 42. 4 33. 8% 6. 9x 20. 4x NA
Modern T imes G roup Mtg AB 6/30/2009 MT G B OM SEK S weden 293. 00 2,662. 8 1, 893. 2 290.9 15. 4% 1. 7x 11. 1x 2, 969
MO K O .mobi Limited 12/31/2008 MK B AS X AUD Aus tralia 0. 07 4.7 1. 2 (2.5) NM 2. 9x - NA
Myriad G roup AG 12/31/2008 MY R N SWX C HF S witzerland 4. 12 80. 9 40. 0 0.8 1.9% 2. 3x - 405
NE O W IZ G ames C orpora tion 12/31/2008 A095660 K OS E KR W S outh K orea 31850. 00 545. 9 201.6 54. 1 26. 8% 2. 7x 9. 9x NA
NetDragon W ebS oft, Inc. 3/31/2009 777 S E HK HK D C hina 6 390. 1 86. 9 34. 4 39. 5% 2. 9x 7. 4x 2, 426
Neteas e. com Inc. 3/31/2009 NT E S Na s daqG S US D C hina 45. 36 5,870. 8 470.4 305.7 65. 0% - - 3, 109
NeuLion Incorporated 3/31/2009 T S X :NLN TS X C AD C anada 1. 06 111. 7 18. 1 (11. 8) -65. 2% 5. 5x - 237
NeXplore C orporation 6/30/2008 NX P C OT C P K US D United S ta tes 1 39. 0 0. 7 (6.2) NM - - NA
Ngi G roup Inc. 3/31/2009 2497 TS E JPY J a pan 32200. 00 41. 0 90. 7 10. 9 12. 0% 0. 0x 0. 1x NA
Northgate T echnologies L imited 6/30/2009 590057 BSE INR India 35. 20 25. 7 83. 2 (41. 6) -50. 0% 0. 3x - NA
O pen T ext C orp. 3/31/2009 OT E X Na s daqG S US D C anada 38. 44 2,022. 8 782.6 199.2 25. 5% 2. 7x 10. 5x 3, 400
O penwave S ys tems Inc. 6/30/2009 OP W V Na s daqG S US D United S ta tes 2. 62 218. 3 191.7 5.3 2.8% 0. 6x 20. 6x NA
P erfect W orld C o. , Ltd. 3/31/2009 PWRD Na s daqG S US D C hina 37. 40 1,819. 0 228.0 124.5 54. 6% 0. 5x 0. 9x 2, 096
P NI Digital Media Inc. 3/31/2009 T S X V :P N T S XV C AD C anada 1. 48 46. 8 20. 0 0.5 2.3% 2. 3x - NA
Q uepa s a C orp. 3/31/2009 QP S A OT C B B US D United S ta tes 1 15. 9 0. 1 (10. 8) NM - - 74
O AO R B C Information S ys tems 12/31/2007 R BCI R TS US D R us s ia 1. 05 145. 7 148.8 19. 4 13. 1% 0. 0x 0. 2x NA
S handa Interactive E nterta inment Ltd. 3/31/2009 S NDA Na s daqG S US D C hina 49. 96 3,335. 8 569.9 260.8 45. 8% - - 3, 124
S hutterfly, Inc. 6/30/2009 S FLY Na s daqG S US D United S ta tes 15. 89 404. 5 218.6 27. 3 12. 5% 1. 6x 12. 5x 514
S K C ommunications C o., Ltd. 12/31/2008 A066270 K OS E KR W S outh K orea 10100. 00 344. 7 187.4 12. 2 6.5% 1. 8x 28. 3x NA
S NAP Interactive, Inc. 3/31/2009 S TVI OT C B B US D United S ta tes 0 4.3 3. 3 0.9 28. 0% 0. 9x 3. 1x 11
S NM G loba l Holdings 9/30/2008 S NMN OT C P K US D United S ta tes 0. 00 0.0 2. 0 (0.7) -34. 8% 1. 1x - 33
S ocial Media V enures , Inc. 12/31/2008 S MV I OT C P K US D United S ta tes 0 0.0 0. 1 (0.1) -60. 6% 4. 5x - NA
S ocialwis e, Inc. 3/31/2009 S C LW OT C B B US D United S ta tes 0. 74 32. 1 0. 0 (4.8) NM - - NA
S ohu. com Inc. 6/30/2009 S O HU Na s daqG S US D C hina 64. 00 2,453. 4 485.1 209.4 43. 2% 4. 0x 9. 3x 3, 197
S park Networks , Inc. 3/31/2009 L OV AME X US D United S ta tes 3 56. 1 54. 3 11. 8 21. 7% 1. 0x 4. 8x 183
S pectrumDNA, Inc. 3/31/2009 S P XA OT C B B US D United S ta tes 0 10. 7 0. 1 (2.6) NM - - 7
T encent Holdings Ltd. 3/31/2009 700 S E HK HK D C hina 111 25, 897.8 1, 203. 1 582.7 48. 4% 23.6x 48. 8x 6, 123
T he P arent C ompany 8/2/2008 K IDS . Q OT C P K US D United S ta tes 0. 02 0.4 112.0 (13. 5) -12. 0% 0. 2x - 347
T he9 Limited 12/31/2008 NC T Y Na s daqG S US D C hina 9. 38 239. 2 250.3 85. 4 34. 1% - - 1, 626
T heS treet. com, Inc. 3/31/2009 TS CM Na s daqG M US D United S ta tes 2. 30 70. 4 67. 0 1.9 2.9% 0. 1x 3. 0x 310
T ota l S port O nline AS 3/31/2006 T OS O O T C NO NO K Norway 0. 03 0.1 2. 2 (1.1) -50. 6% 4. 6x - 16
T ree.C om, Inc. 6/30/2009 TR E E Na s daqG M US D United S ta tes 9. 88 106. 7 216.6 (1.0) -0.4% 0. 5x - 700
Unis erve C ommunica tions C orp. 2/28/2009 T S X V :US S T S XV C AD C anada 0. 05 1.0 24. 0 0.1 0.2% 0. 2x - NA
United O nline Inc. 6/30/2009 UNT D Na s daqG S US D United S ta tes 7. 55 633. 0 949.8 206.2 21. 7% 0. 9x 4. 4x 1, 469
UOMO Media, Inc 1/31/2009 UO MO OT C B B US D C anada 0 12. 9 0. 6 (0.5) -78. 2% 20.8x - NA
V alueC lick Inc. 6/30/2009 V C LK Na s daqG S US D United S ta tes 11 948. 2 563.6 99. 1 17. 6% 1. 4x 8. 2x 1, 189
V OIS , Inc. 3/31/2009 V O IS OT C B B US D United S ta tes 0 4.4 0. 0 (1.1) NM - - 4
W ebzen Inc. 3/31/2009 W ZE N Na s daqG M US D S outh K orea 3. 28 38. 8 23. 4 (0.6) -2.4% - - NA
W izzard S oftwa re C orporation 3/31/2009 W ZE AME X US D United S ta tes 0. 47 22. 5 5. 6 (5.3) -94. 5% 4. 3x - 110
W orlds . com Inc. 3/31/2009 W DDD OT C B B US D United S ta tes 0. 09 4.7 0. 0 (0.8) NM - - 1
W oozyF ly, Inc. 3/31/2009 W ZY F OT C B B US D United S ta tes 0. 15 2.6 NM NM NM - - NA
W ynds torm C orpora tion NA W Y ND OT C P K US D United S ta tes 0. 10 1.8 NA NM NM - - NA
XING AG 3/31/2009 O 1B C XT R A E UR G ermany 26. 70 199. 0 53. 5 16. 7 31. 2% 2. 7x 8. 8x 239
Y eda ngO nline C orp. 12/31/2007 A052770 K OS E KR W S outh K orea 9,440 120. 7 55. 8 12. 0 21. 6% 2. 4x 10. 9x NA
Y nk K orea Inc. 3/31/2009 A023770 K OS E KR W S outh K orea 4,910 21. 4 10. 7 (0.8) -7.6% - - NA
High 25, 897.8 1,893. 2 582. 7 65. 0% 35.7x 48. 8x 6, 123
Low 0.0 0. 0 -41.6 -98. 9% 0. 0x 0. 1x 1
Average 696.6 157.3 35.6 6.9% 5.0x 11.1x 905
Median 60. 9 56.2 0. 9 13. 1% 1. 9x 9. 8x 405
Figure 1. Web 2.0 Universe Summary
Source. Capital IQ
3. Page 3
C A P I T A L M A R K E T S A C T I V I T Y (M & A A N D F I N A N C I N G )
Total capital raised in August (so far) is $94.4 million: Online gaming company Turbine, Inc. raised $50 million in
August – the largest transaction in August. RichRelevance, a company that offers comment/opinion on ecommerce sites,
was a distant second at $12.5 million. Total capital raised in July on 31 transactions was $178.7 million, averaging $5.8
million, and June was $196.1 million (averaging $4.9 million). The average for August, month-to-date so far, is $7.4 million.
Financing Activity Last Three Months
250.0 8.0
7.4
7.0
200.0
6.0
5.8
4.9
5.0
150.0
(US$m)
(US$m)
4.0
100.0
3.0
2.0
50.0
1.0
0.0 0.0
Jun-09 Jul-09 Aug-09
Total Average
Figure 2. Financings, Last Three Months
Source. Company reports
4. Page 4
Turbine, Inc. raises $50 million: On the capital raise front, Turbine, Inc. raised $50 million, the largest transaction so far
in August. RichRelevance was a distant second securing a $12.5 million round. Closely behind was Traffiq (a company that
offers display advertising on a digital media platform) raising $10 million. All other transactions (three from a total of eight)
were below $10 million each, with the total for August so far at $94.4 million. In addition, Friends Reunited was acquired
for $42 million. For additional details on financings, see Figures 23 and 24 (at end of note).
Financing & M/A Summary - Last Three Months
90.0
80.0
70.0
60.0
50.0
Aug-09
(US$m)
Jul-09
Jun-09
40.0
30.0
20.0
10.0
0.0
AdEx Media
Jaxtr
xoopit
blueKiwi Software SA
OneTXT
People Media
AdLink Internet Media
Pandora Media
MediaMath
RichRelevance
QuickPlay Media
Bubble Motion
Invodo
Nexage
RingRevenue
YuMe
ProtonMedia
iLoop Mobile
Cognitive Match
iSyndica
I Love Rewards
Metaversum
StyleCaster
AdMeld Inc.
Quikr India Pvt. Ltd.
Crowdcast
Newser LLC
CoTweet
Turbine
Friends Reunited
Ning
Boku
Traffiq
AdChina
ConnectEdu
SBNation
Nokeena
Busca
Yapta
my6sense
Lat49
Aloqa
Cellufun
Glubble
Clikthrough
Picaboo
BookFresh
Super Rewards
Grab Networks
Sense Networks
MojoPages
TweetDeck
MashLogic
Gather
LiquidPlanner
Sugar Inc.
Kontera Ltd.
Goojet SAS
beeTV
KODA
GROU.PS
Cliqset
ClickFuel
Inigral
TodaCell
People Capital
Taomee
Animoto
GameGround
Comunitae
Causes
Outspark
Acquia, Inc
Zoosk
OPEN Sports
eRepublik
Bill.com
Tributes.com
Tumri
Akademos
AdWhirl
Wimba
Figure 3. Capital Market Activity, Last Three Months
Source. Company reports
5. Page 5
Ad Netw ork remains the most active sector in dollars raised: Following recent trends, Ad Networks as a sector saw
the most activity in dollars raised ($126.4 million), followed by the Social Network sector with 12 transactions, raising
$99.6 million (Figure 4).
Capital Market Activity by Sector - Last Three Months
140.0
120.0
100.0
80.0
(US$m)
126.4
60.0
99.6
40.0 80.0
69.6
57.8
47.5
20.0
35.0
26.4 24.0 22.3 21.5
13.1 13.0 12.5 12.0 10.7
5.2 5.0 4.1 3.2 3.0 1.0 1.0
0.0 0.5 0.5 0.0
Comment/Reputation
Mobile Payment
Communities
Online Dating
Gaming
Online Calendar
Enterprise
Mobile
Media
Collaboration
Online Learning
Microblog
Publishing
Online Lending
Music
Infrastructure
Blog
Search
Classified
Mobile Ad
SMS/Voice
Social Networks
Virtual World
Video
Ad Network
Analytics
Vertical
# companies
13 12 1 4 4 8 1 4 2 7 4 3 1 1 2 2 2 1 1 1 2 1 1 1 1 0
Figure 4. Capital Market Activity, by Sector, Last Three Months
Source. Company reports
C A P I T A L M A R K E T S A C T I V I T Y (P R I C E P E R F O R M A N C E )
Web 2.0 index far outpaces NASDAQ recovery: Our W eb 2.0 index (market-cap weighted) essentially mirrored the
performance of the NASDAQ composite index from mid-2008 until earlier this year. However, the index has recently had a
much stronger recovery relative to the NASDAQ index (Figure 5).
Web 2.0 Index Price Performance
130
120
110
100
90
80
70
60
50
40
8/11/2008
8/25/2008
9/8/2008
9/22/2008
10/6/2008
10/20/2008
11/3/2008
11/17/2008
12/1/2008
12/15/2008
12/29/2008
1/12/2009
1/26/2009
2/9/2009
2/23/2009
3/9/2009
3/23/2009
4/6/2009
4/20/2009
5/4/2009
5/18/2009
6/1/2009
6/15/2009
6/29/2009
7/13/2009
7/27/2009
8/10/2009
^COMP - Share Pricing Index: Web 2.0 X (Market Cap Weights) - Index Value
Figure 5. Web 2.0 Price Performance
Source. Capital IQ
6. Page 6
A mixed price performance week: The companies in our universe had mixed stock price performances over the past
week (for stocks with prices greater than $1) (Figure 6), with 24 companies showing negative returns on the week. Fluid
Music Canada, Inc (TSX:FMN) led the group with a 31.1% return, while NetDragon W ebsoft, Inc. (SEHK:777) had the
worst return, dropping 12.0% in the week.
1 Week P rice P erformance
Fluid Mus ic Canada , Inc . 31.1%
NeuLion Incorporated 27.7%
G ravity Co., Ltd 25.0%
Y edangOnline Corp. 14.4%
S park Netw orks , Inc . 12.8%
TheS treet.com, Inc . 11.1%
Frogs ter Interactive Pictures A G 8.3%
Changy ou. com Limited 6. 4%
Modern Times G roup Mtg A B 6.2%
Chines e Gamer International 5.4%
Openw ave S y s tems Inc . 4.8%
S K Communications Co., Ltd. 4.7%
Quepas a Corp. 4. 2%
Gree, Inc . 2.5%
S ohu.com Inc . 2.0%
The9 Limited 1.9%
S hutterf ly , Inc . 1. 7%
LookS mart, Ltd. 1.6%
Tencent Holdings Ltd. 1.2%
Open Tex t Corp. 0.8%
Cy berplex Inc . 0.6%
My riad G roup A G 0.5%
DA DA S pA 0.3%
G ameOn Co Ltd. 0. 2%
S handa Interac tive Entertainment Ltd. 0.1%
IA C/InterA c tiveCorp. -0.1%
Tree.Com, Inc . -0. 3%
Perfect World Co., Ltd. -0.7%
G igaMedia Ltd. -1.0%
Neteas e.com Inc . -1.2%
PNI Digita l Media Inc . -1.3%
Ga mania Digital Enterta inment Co. , -1.7%
Eolith Co. Ltd. -1.8%
G iant Interac tive Group, Inc . -1.9%
Ngi Group Inc . -2.7%
XING A G -2.7%
Ha nbitS oft, Inc . -3.0%
Y nk K orea Inc . -4.7%
K ings of t Co. Ltd. -5. 0%
Northgate Technologies Limited -5.4%
Webz en Inc . -6.7%
CDC Corp. -6.9%
Digita lTow n, Inc . -7.1%
V a lueClick Inc . -7.4%
A ctoz S oft Co., Ltd. -8.0%
Mix i, Inc . -9.4%
A Q Interac tive, Inc . -9. 6%
NEOWIZ Games Corporation -11.2%
NetDra gon WebS oft, Inc . -12.0%
-15.0% -10.0% -5.0% 0.0% 5.0% 10.0% 15.0% 20.0% 25.0% 30.0% 35.0%
Figure 6. 1-Week Price Performance
Source. Capital IQ
7. Page 7
INDUSTRY NEWS (PARTNERSHIPS, FINANCIAL RESULTS, NEW PRODUCTS)
K ey Developments
C ompany Headline Notes
Openwave S ys tems Inc. T els tra S elects O penwave Mobile Ana lytics of O penwave O penwa ve S ys tems Inc. a nnounced that T els tra has s elected Openwa ve Mobile Analytics , a s olution that provides T els tra a das hboa rd view
(Nas daqG S : OP WV) S ys tems Inc of all as pects of a ggrega ted mobile s ubs criber da ta a ctivity, levera ging a pla tform of intelligent analytics a nd rich reporting ca pabilities acros s
its mobile device portfolio, including s ma rtphones a nd fea ture phones , iP hone traffic, netbooks a nd other mobile-ca pable devices . O penwave
Mobile Ana lytics empowers T els tra to aggrega te s ubs criber data and behaviora l informa tion a cros s a variety of data s ources , including on
porta l and open internet brows ing, mobile email mes s a ging, video and audio s treaming, device type, demogra phics and location to provide a
360-degree view of their mobile s ubs criber bas e. Openwa ve Mobile Analytics a ls o provides T els tra with ins ight into the opera tional as pects
of their mobile broa dband network, allowing them to control network operations more efficiently by optimizing pres ent ca pa city a nd managing
ongoing ba ndwidth dema nds .
Acc elerize New Media, Inc. Accelerize New Media Inc. Adds T wo New C lients for Accelerize New Media Inc. a nnounced that it ha s partnered with G uzov O fs ink, L LC and with a multina tional education compa ny to provide
(OTC B B : AC L Z) P erforma nce-B as ed Marketing C a mpa igns performa nce-bas ed ma rketing s ervices to generate new bus ines s via www.S E C F ilings .com. S E C F ilings . com ta rgets a niche a udience within
a highly coveted fina ncial demogra phic tha t includes s enior executives , fina ncial profes s ionals , a nd inves tors by providing free rea l-time
a cces s to over 7 million S E C filings dating ba ck to 1994.
L ookS mart, L td. (Nas daqGM: L OOK ) LookS ma rt Ltd. Announces Unaudited C ons olida ted L ookS ma rt L td. a nnounced unaudited cons olidated financia l res ults for the s econd quarter a nd s ix months ended J une 30, 2009. R evenues
F ina ncial R es ults for the S econd Quarter a nd S ix Months for the s econd quarter of 2009 were $13.2 million, a 23% decreas e from $17.1 million in the s econd quarter of 2008. Net los s for the s econd
E nded J une 30, 2009 ; R ecords Impairment C ha rge qua rter of 2009 wa s $1. 3 million, or $0.08 per bas ic and diluted s ha re. T his is compared to a net los s for the s econd qua rter of 2008 of $0. 2
million or $0. 01 per ba s ic and diluted s ha re. Los s from continuing operations for the s econd quarter of 2009 was $1.4 million or $0. 09 per
bas ic and diluted s ha re, which includes a $0.2 million impairment cha rge and $0. 2 million of expens es related to the evalua tion of s tra tegic
growth alterna tives . T his compa res to a los s from continuing opera tions in the s econd quarter of 2008 of $0. 04 million. Non-G AAP net los s
(net los s before dis continued opera tions and excluding s tock bas ed compens ation a nd impairment cha rges ) for the s econd quarter of 2009
wa s $0. 7 million compared to non-G AAP net income of $0.5 million in the s econd quarter of 2008. C a pital expenditures , including
capita lization of internally developed s oftwa re, in the s econd quarter of 2009 were $0. 4 million, compa red to $0.9 million in the s econd qua rter
ValueC lick Inc . (Nas daqG S : VC L K ) V a lueC lick Inc. R eports E arnings R es ults for S econd V a lueC lick Inc. reported fina ncial res ults for the s econd qua rter and s ix months ended J une 30, 2009. F or the period, the company reported
Quarter a nd S ix Months E nded J une 30, 2009 ; P rovides net income of $14. 9 million or $0. 17 per diluted s ha re on revenues of $130. 4 million a ga ins t net income of $16. 5 million or $0. 17 per diluted
E a rnings O utlook for T hird Quarter of 2009 s ha re on revenues of $158. 5 million for s a me period a year a go. Income from operations for the period wa s $23. 4 million a ga ins t $28.0
million for s a me period a year a go. Income before income ta xes for the period was $24. 6 million a ga ins t $29.4 million for s ame period a year
a go. Net income from continuing opera tions for the period was $14. 9 million or $0.17 per diluted s hare aga ins t net income from continuing
opera tions for the period was $16. 5 million or $0.17 per diluted s hare for s ame period a yea r ago. In the s econd quarter of 2009, the
company generated approxima tely $23. 5 million in free cas h flow, defined a s net cas h from opera tions les s ca pital expenditures . F or the
period, the company reported net income of $28.1 million or $0. 32 per diluted s ha re on revenues of $265. 4 million a ga ins t net income of
$35.7 million or $0.37 per diluted s ha re on revenues of $327.7 million for s ame period a year ago. Income from operations for the period wa s $
B eyond C ommerc e, Inc. B eyond C ommerce Inc. Announces L oca lAdLink's B eyond C ommerce Inc. a nnounced the P re-La unch of L ocalAdLink into the country of India. T he Indian ma rket pres ents a lucrative
(OTC B B : B YOC ) E xpa ns ion into India expa ns ion opportunity for L oca lAdL ink. T he country of India currently has over a million people in the network marketing indus try. Indus try
obs ervers , who are highly optimis tic a bout the growth of this indus try in India , es tima te the s ize of the indus try to cros s $1, 000 billion ma rk by
the year 2010.
United Online Inc. (Nas daqGS : UNTD) United O nline Inc. R eports Un-Audited C ons olidated United Online Inc. reported un-a udited cons olida ted ea rnings res ults for the s econd quarter a nd s ix months ended J une 30, 2009. F or the
E a rnings R es ults for the S econd Q ua rter and S ix Months qua rter, the compa ny reported net income a pplica ble to common s tockholders of $17.7 million or $0.21 diluted per s ha re on tota l revenues of
E nded J une 30, 2009 ; P rovides E a rnings G uida nce for $260. 8 million a ga ins t $12.8 million or $0.18 diluted per s ha re on tota l revenues of $122. 3 million a yea r ago. Operating income wa s $43. 1
the T hird Q ua rter of 2009 million a gains t $22 million a yea r a go. Income before income ta xes was $34. 7 million a ga ins t $23. 5 million a yea r ago. Net income was
$19.3 million agains t $13. 7 million a year ago. Adjus ted opera ting income before depreciation a nd amortization was $68.5 million agains t
$37.6 million a yea r a go. Adjus ted net income a pplica ble to common s tockholders was $31.4 million or $0.37 diluted per s hare agains t net
income of $20. 4 million or $0.29 diluted per s hare a year a go. Net ca s h provided by opera ting a ctivities wa s $32. 5 million a ga ins t $36.1
million a yea r ago. F or the s ix months , the compa ny reported net income applicable to common s tockholders of $34 million or $0.41 diluted
per s hare on tota l revenues of $524. 4 million agains t $25 million or $0.36 diluted per s hare on tota l revenues of $244.1 million a yea r ago. Ope
T he compa ny provided ea rnings guidance for the third quarter of 2009. F or the quarter, the company expects revenues in the ra nge of $208. 0
Giant Interactive G roup, Inc . G ia nt Intera ctive G roup Inc. R eports E arnings R es ults for G iant Interactive G roup Inc. reported ea rnings res ults for the firs t quarter of 2009. F or the qua rter, the compa ny's opera ting revenues
(NYS E : GA) the F irs t Q ua rter of 2009 rea ched C NY 1. 595 billion a nd C NY 374 million in 2008 and the firs t qua rter of 2009 res pectively.
P erfect W orld C o., L td. P erfect W orld Announces New 2D MMO R P G 'Dragon P erfect W orld C o. , L td. a nnounced the introduction of its firs t 2D rea l-time fa nta s y MMOR P G , 'Dragon E xcalibur. ' Developed by P erfect
(Nas daqG S : P WR D) E xca libur' W orld's S hanghai R & D tea m, 'Dragon E xca libur' is a 2D fa ntas y online game tha t runs on R a ider, the C ompany's proprieta ry 2D ga me
engine. T he innova tive 2D technology will allow the ga me to feature a dva nced a nd unique vis ual effects . In 'Dragon E xca libur, ' a fantas y
world is crea ted where huma n beings , demons and gods meet in a s imulated his torical s cene. It us hers the pla yers into a world of a
voluminous his torical novel where they can s huttle between different dyna s ties . T he game players can als o fa miliarize thems elves with the
s imulated his torica l s ettings and ca n try to a lter the fa te of his tory with their coura ge in the ga me. T he innovative pla y modes will bring a
bra nd new game experience to the pla yers .
MOK O.mobi L imited (AS X: MK B ) MOK O .mobi Limited R eports P a rent a nd C ons olida ted MOK O. mobi L imited reported parent a nd cons olida ted earnings res ults for the year ended J une 30, 2009. F or the year, the company
E a rnings R es ults for the Y ea r E nded J une 30, 2009 reported cons olida ted los s a fter ta x and los s a ttributa ble to equity holders of AUD 2, 487, 159 or 3. 16 cents per diluted s ha re on revenue from
continuing opera tions of AUD 555, 058 compa red to cons olidated los s after ta x a nd los s attributable to equity holders of AUD 3,114,862 or
5.18 cents per diluted s hare on revenue from continuing operations of AUD 1,474,485 for the s ame period a yea r ago. T he company
reported cons olida ted los s before income ta x expens e of AUD 2, 808, 925 compared to cons olida ted los s before income ta x expens e of AUD
3,114, 862 for the s ame period a yea r ago. Net cas h us ed in opera ting activities was AUD 2, 100, 797 compared to net ca s h us ed in opera ting
a ctivities wa s AUD 2, 162,428 for the s ame period a year ago. F or the yea r, the pa rent compa ny reported los s a fter ta x a nd los s attributable
to equity holders of AUD 2,475, 810 on revenue from continuing opera tions of AUD 555, 058 compa red to los s a fter ta x and los s a ttributa ble
to equity holders of AUD 3,114, 452 on revenue from continuing opera tions of AUD 1, 474, 485 for the s a me period a year a go. T he company re
Figure 7. Key Developments
Source. Capital IQ
8. Page 8
VALUATION
Online Gaming companies lead market-cap charts: Thirteen companies in our W eb 2.0 universe top US$1 billion in
market capitalization (Figure 8). Fifty-six of the 91 companies have market caps under US$100 million, with 24 under
US$10 million. Online gaming companies dominate the top of the list, led by Tencent Holdings with a market cap over
US$20 billion.
Market C ap (US D m)
Tenc ent Holdings Ltd.
Neteas e.c om Inc.
S ha nda Interactive Entertainment Ltd. 3335.8
Modern Times Group Mtg A B 2662.8
S ohu.c om Inc. 2453.4
IA C/InterA ctiveCorp. 2449.4
Changy ou.com L imited 2164.4
Open Tex t Corp. 2022.8
Perf ec t World Co., Ltd. 1819.0
Giant Interactive G roup, Inc. 1818.1
Gree, Inc. 1779.8
K ings oft Co. Ltd. 1134.8
Chines e G amer International 1101.7
Mix i, Inc. 976.1
V alueClick Inc. 948.2
United Online Inc. 633.0
NEOWIZ G ames Corpora tion 545.9
S hutterf ly , Inc. 404.5
NetDragon WebS of t, Inc. 390.1
S K Communications Co., Ltd. 344.7
CDC Corp. 292.3
GigaMedia Ltd. 269.3
Ga mania Digital Entertainment Co., Ltd. 268.3
The9 L imited 239.2
GungHo Online Entertainment, Inc. 237.7
Openw a ve S y s tems Inc. 218.3
XING A G 199.0
A ctoz S of t Co., Ltd. 165.3
OA O R B C Information S y s tems 145.7
DA DA S pA 139.8
Y edangOnline Corp. 120.7
NeuLion Inc orporated 111.7
Tree.Com, Inc. 106.7
G ameOn Co Ltd. 103.0
Cy berplex Inc. 102.3
K A B Dis tribution Inc. 82.7
My riad G roup A G 80.9
HanbitS of t, Inc. 76.8
TheS treet.c om, Inc. 70.4
G eoS entric Oy j 63. 5
G ra vity Co., Ltd 58. 4
Fluid Mus ic Ca nada, Inc. 57.2
S park Netw orks , Inc. 56.1
Frogs ter Interactiv e Pic tures A G 51.8
Eolith Co. Ltd. 48.4
PNI Digital Media Inc. 46.8
Ngi G roup Inc. 41.0
NeXplore Corpora tion 39.0
Webz en Inc. 38.8
DigitalTow n, Inc. 35.6
S oc ialw is e, Inc. 32.1
DXN Holdings B hd 30.9
A Q Interactive, Inc. 29.9
Northgate Technologies L imited 25.7
Wiz z ard S of tw are Corpora tion 22.5
LookS mart, Ltd. 21.4
Y nk K orea Inc. 21.4
Dolphin Digital Media, Inc. 20.7
B roa dWebA s ia Inc. 19.5
Quepas a Corp. 15.9
A cceleriz e New Media, Inc. 15.8
J umbuck Enterta inment Pty Ltd. 15.1
B ey ond Commerce, Inc. 13.5
L ingo Media Corpora tion 12.9
UOMO Media, Inc 12.9
IA S Energy , Inc. 12.6
S pectrumDNA , Inc. 10.7
Ex tens ions , Inc. 8.9
B right Things plc 4.8
MOK O.mobi L imited 4.7
Worlds .c om Inc. 4.7
DigitalPos t Interactive, Inc. 4.4
V OIS , Inc. 4.4
S NA P Interactive, Inc. 4.3
CornerWorld Corpora tion 3.5
is eemedia Inc. 3.3
Magnitude Information S y s tems Inc. 2.7
Wooz y Fly , Inc. 2.6
B eta w ave Corpora tion 2.2
Liv eWorld Inc. 1.9
Wy nds torm Corpora tion 1.8
B igs tring Corp. 1.3
Unis erve Communications Corp. 1.0
CLICK ER Inc. 0.6
A s s ocia ted Media Holdings Inc. 0.6
The Pa rent Company 0.4
China Ga tew ay Corpora tion 0.3
Total S port Online A S 0.1
S NM Global Holdings 0.0
Dibz International, Inc. 0.0
S ocial Media V enures , Inc. 0.0
0 500 1, 000 1,500 2, 000 2,500 3,000 3,500 4,000
Figure 8. Market Cap Ranking
Source. Capital IQ