SlideShare une entreprise Scribd logo
1  sur  8
Excersice 1 การเปลี่ยนแปลงอุณหภูมิในช่วง 1970-9 และ 2000-9

วัตถุประสงค์ ต้องการทราบลักษณะการเปลี่ยนแปลงอุณหภูืืืุืิมิในช่วงเวลาดังกล่าว
สิ่งที่ต้องใช้
     - ข้อมูลภูมิอากาศรายวันของสถานีที่ต้องการ Chantaburi.xls
     - โปรแกรม Excel
     - หรือ โปรแกรม Access
เริ่มต้น
1. เปิดไฟล์ข้อมูล Chantaburi.xls เพิ่อตรวจสอบความสมบรูณ์ของข้อมูล
2. เลือกข้อมูลอุณหภูมิเฉลี่ยรายวันในช่วงที่ต้องการ คือ 1970-9 และ 2000-9 จากไฟล์
ข้อมูล Chantaburi.xls แยกเป็น ٢ ช่วงให้ชัดเจน
٣. สามารถใช้ โปรแกรม access ช่วยในการจัดการข้อมูลได้ โดย
          3.1 สร้างฐานข้อมูลใหม่ ชื่อ chantaburi.mdb
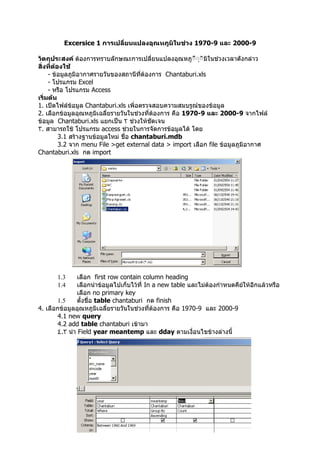
          3.2 จาก menu File >get external data > import เลือก file ข้อมูลภูมิอากาศ
Chantaburi.xls กด import


       1.3    เลือก first row contain column heading
       1.4    เลือกนำาข้อมูลไปเก็บไว้ที่ In a new table และไม่ต้องกำาหนดคีย์ให้อีกแล้วหรือ
              เลือก no primary key
       1.5    ตั้งชื่อ table chantaburi กด finish
4. เลือกข้อมูลอุณหภูมิเฉลี่ยรายวันในช่วงที่ต้องการ คือ 1970-9 และ 2000-9
       4.1 new query
       4.2 add table chantaburi เข้ามา
       ٤.٣ นำา Field year meantemp และ dday ตามเงื่อนไขข้างล่างนี้
٤.٤ คลิกขวาที่ query เลือก properties จะปรากฎตามภาพ กำาหนดให้ unique value มี
ค่าเป็น yes


       4.5     save query ชื่อ avgtemp1960-9
       4.6     เปิด query ชื่อ avgtemp1960-9 จะได้ผลลัพธ์อุณหภูมิเฉลี่ย เรียงตาม
               อุณหภูมิจากน้อยไปมาก และจำานวนวันที่มีอุณหภูมิเท่านั้น
       4.7     เลือก query ชื่อ avgtemp1960-9 แล้ว save as query ชื่อ avgtemp2000-9


       4.8     เลืืิอก query ชื่อ avgtemp2000-9 มาแก้ไข ด้วย design view แก้ไขช่วงปีที่
               ต้องการดึงข้อมูล “between 2000 and 2009”


หรือสร้าง Query ขึ้นใหม่ด้วยวิธีการทำานองเดียวกันกับข้อ ٤.٤ -٤.١ แต่ต่างกันทีเลือกปีของข้อมูล
                                                                              ่
٥. ผลลัพธ์ที่ได้นำามาวางใน excel ซึ่งสามารถสร้าื้งกราฟได้ดีกว่า
        ٥.١ เลือกช่วงของข้อมูลที่เป็นจำานวนวัน เลือกชนิดของกราฟเป็นเส้น แล้วกด next
٥.٢ ที่ Tab series มากำาหนด category (x) axis labels ให้นำาข้อมูลมาจาก ช่วงข้อมูล
อุณหภูมิเฉลี่ย


                   ٥.٣ Tab titles สามารถกำาหนดชื่อ หรือ label ต่าง ๆ ได้ เช่น


                                   avg temp                                180                                            CHANTABURI
             200                                                                                                                                                                                   1960-9
                                                      1960-9               160
                                                                                                                                                                                                   2000-9
             150                                                           140
                                                                           120
 frequency


                                                               frequency


             100                                                           100
                                                                            80
             50                                                             60
                                                                            40
              0
                                                                            20
                   18 .2
                   20 .4
                           21 .3
                           22 .1
                           22 .9
                                   23 .7
                                   24 .5
                                           25 .3
                                           26 .1
                                           26 .9
                                                   27 .7
                                                   28 .5
                                                   29 .3


                                                                             0
                                                                                                                                                                                           29
                                                                                        20


                                                                                                                         23


                                                                                                                                                          26
                                                                                 18.2


                                                                                             20.6
                                                                                                    21.2
                                                                                                           21.8
                                                                                                                  22.4


                                                                                                                              23.6


                                                                                                                                            24.8
                                                                                                                                                   25.4


                                                                                                                                                               26.6
                                                                                                                                                                      27.2
                                                                                                                                                                             27.8
                                                                                                                                                                                    28.4


                                                                                                                                                                                                29.6
                                                                                                                                                                                                       30.2
                                                                                                                                                                                                              30.8
                                                                                                                                     24.2


                                       temp                                                                                                        temp
٦. สำาหรับการนำามา plot กราฟร่วมกันต้องนำามาเรียงให้อุณหภูืิมิตรงกัน

ทางเลือกอื่น ๆ
      หรือทำาการสรุปข้อมูลเป็นกลุ่มใหญ่ ๆ เช่น อุณหภูืิมิทุก ١ องศา ซึ่งสามารถใช้
ACCESS ช่วยจัดการได้ ด้วย function Round
      ทำาให้อุณหภูืิมิปัดเป็นจำานวนเต็มก่อนนำามานับรวมกัน
               rtemp: Round([meantemp],0)


ผลผลัพธ์จากการทำา Round อุณหภูืิมิ นำามาวางลงใน excel ดังตาราง นำามาทำากราฟได้ดัง
ภาพ

 avgtemp       1960-9       2000-9
      18             2                                     1400                      average temperature
      19             1                                                      1960-9
      20             9             2                       1200
                                                                            2000-9
      21           22              3                       1000
      22           40              7
                                               frequency


      23           83             20                        800
      24          196             63                        600
      25          349            149
      26         1011            497                        400
      27         1059            790                        200
      28          725           1218
                                                              0
      29          143            652
      30           13            240                              18   19    20   21    22   23   24   25   26   27   28   29   30   31
      31                          12                                                         temperature C


คำาืำถาม
١. มีการเปลี่ยนแปลงอุณหภูมิในพื้นที่จังหวัดจันทบุรีอย่างไร ระหว่าง ٢ ช่วงที่ศึกษา
............................................................................................................................
...........................................................................................................................
.٢. อุณหภูมิสูงขึ้นหรือไม่ ค่าเฉลี่ย(mean)ของแต่ละช่วงต่างกันเท่าไร
.................................
ค่า variance ของทั้ง ٢ ช่วงต่างกันหรือไม่อย่างไร...........................................................
............................................................................................................................
Excersice ٢ การเปลี่ยนแปลงภูมิอากาศจากค่าปกติ ตัวอย่าง ปริมาณนำ้าฝน

วัตถุประสงค์ ต้องการทราบลักษณะการเปลี่ยนแปลงของปริมาณนำ้าฝน ปีใดที่ตำ่ากว่าค่าปกติ ปี
ใดที่สูงกว่าค่าปกติ
สิ่งที่ต้องใช้
     - ข้อมูลภูมิอากาศรายวันของสถานีที่ต้องการ Chantaburi.xls หรือ chantaburi.mdb
     - โปรแกรม excel
     - หรือ โปรแกรม access
เริ่มต้น
     1. เปิดไฟล์ฐานข้อมูล chantaburi.mdb หากไม่มีให้นำาดำาเนินการตาม Excersice ١ ข้อ ٣
     ٢. สรุปข้อมูลปริมาณนำ้าฝนรายปี จากข้อมูลรายวัน เนื่องจากมีข้อมูลรายวัน หากมีข้อมูลราย
เดืืิอนก็สรุปมาใช้ได้
          ٢.1 new query
          ٢.2 add table chantaburi เข้ามา
          ٢.٣ นำา Field year rain ตามเงื่อนไขข้างล่างนี้


หมายเหตุ ปริมาณนำ้าฝนรายปี ได้จากการรวมปริมาณนำ้าฝนในทุก ๆวันที่ตกในรอบปีเข้าด้วยกัน
หากเป็นข้อมูลอื่น เช่นอุณหภูมิ ควรใช้ค่าเฉลี่ย หรือ max หรือ min แล้วแต่กรณื

         2.4       save query ชื่อ rainyearly
         2.5       เปิด query ชื่อ rainyearly จะได้ผลลัพธ์ ปริมาณนำ้าฝนรายปี เรียงตามปีจาก
                   น้อยไปมาก และปริมาณนำ้าฝนในแต่ละปี
         2.6       คัดลอกผลลัพธ์ลง excel
     3. ต้องการทราบค่าปริมาณนำ้าฝนเฉลี่ยซึ่งจะใช้เป็นค่าปกติในการศึกษาครั้งนี้
                             ด้วยคำาสั่ง =AVERAGE(Xi)
     ٤. หาค่าส่วนต่างจากค่าปกติ จากสูตร = ((X-Mean)/Mean)*100
       ตัวอย่างสูตรใน excel = (B2-$B$62)/$B$62*100
     ٥. นำาข้อมูลมาสร้างกราฟ add trend line สมการ Regression และ R2
คำาืำ ถาม
١. กราฟการเปลี่ยนแปลงปริมาณนำ้าฝนเป็นอย่างไร............................................................
สมการ Regression
คือ................................................................R2 คือ........................
٢.ปีใดที่มีการเปลียนแปลงปริมาณนำ้าฝนที่สูงกว่าค่าเฉลี่ยสูงสุดทางบวก.............................
                      ่
....และมีค่า
เท่าใด..........................................................................................................٣. ปีใด
ที่มีการเปลียนแปลงปริมาณนำ้าฝนที่สูงกว่าค่าเฉลี่ยสูงสุดทางลบ.................................และมี
              ่
ค่าเท่าใด.........................................................................................................
٤. นอกจากปริมาณนำ้าฝนรายปีแล้วควรให้ความสนใจสารประกอบทางอุตุนิยมวิทยาใดบ้างใน
งานวิจัยทางด้านการเกษตร........................................................................................
Excersice 3 การจัดเตรียมข้อมูลภูมิอากาศรายสัปดาห์จากข้อมูลรายวัน

วัตถุประสงค์ ต้องการทราบวิธีการในการจัดการและสรุปข้อมูลเป็นรายสัปดาห์
สิ่งที่ต้องใช้
     - ข้อมูลภูมิอากาศรายวันของสถานีที่ต้องการ chantaburi.xls หรือ chantaburi.mdb
     - โปรแกรม Excel
     - โปรแกรม Access
     - standard meteorological weeks
เริ่มต้น
     1.เปิดไฟล์ฐานข้อมูล chantaburi.mdb หากไม่มีให้นำาดำาเนินการตาม Excersice ١ ข้อ ٣
     ٢. สร้างตารางข้อมูล month day week ด้วย excel แล้วนำาข้อมูลจากตารางเข้าสู่ ฐานข้อมูล
chantaburi.mdb และตั้งชื่อ stdweek (ดูวิธีการนำาเข้าข้อมุล excel จาก Excersice ١)
     ٣. สรุปข้อมูลปริมาณนำ้าฝนรายสัปดาห์
          ٣.1 new query
          ٣.2 add table chantaburi และ stdweek เข้ามา
          3.٣ สร้างความสัมพันธ์ของ ٢ ตารางด้วย month และ day
          ٣.٤ นำา Field year rain ตามเงื่อนไขข้างล่างนี้


         ٣.٥ save query ชื่อ rainweekly
         ٣.٦ เปิด query ชื่อ rainweekly จะได้ผลลัพธ์ ปริมาณนำ้าฝนรายสับดาห์เรียงตามปี
         จากน้อยไปมาก
         3.7    คัดลอกผลลัพธ์ลง excel หรือนำาไปใช้งาน

คำาืำ ถาม
١. หากต้องการข้อมูลเป็น เมตริกของปี และสัปดาห์ จะดำาเนินการอย่างไร.............................
..............................................................................................................................
..............................................................................................................................
.............................................................................................................................
...
ปี/สัปดาห์          ١         ٢         ٣         ٤        ٥         ٦         ٧         ٨         ٩         ١٠        ١١
١٩٦٠
١٩٦١
١٩٦٢

Contenu connexe

En vedette

2024 State of Marketing Report – by Hubspot
2024 State of Marketing Report – by Hubspot2024 State of Marketing Report – by Hubspot
2024 State of Marketing Report – by HubspotMarius Sescu
 
Everything You Need To Know About ChatGPT
Everything You Need To Know About ChatGPTEverything You Need To Know About ChatGPT
Everything You Need To Know About ChatGPTExpeed Software
 
Product Design Trends in 2024 | Teenage Engineerings
Product Design Trends in 2024 | Teenage EngineeringsProduct Design Trends in 2024 | Teenage Engineerings
Product Design Trends in 2024 | Teenage EngineeringsPixeldarts
 
How Race, Age and Gender Shape Attitudes Towards Mental Health
How Race, Age and Gender Shape Attitudes Towards Mental HealthHow Race, Age and Gender Shape Attitudes Towards Mental Health
How Race, Age and Gender Shape Attitudes Towards Mental HealthThinkNow
 
AI Trends in Creative Operations 2024 by Artwork Flow.pdf
AI Trends in Creative Operations 2024 by Artwork Flow.pdfAI Trends in Creative Operations 2024 by Artwork Flow.pdf
AI Trends in Creative Operations 2024 by Artwork Flow.pdfmarketingartwork
 
PEPSICO Presentation to CAGNY Conference Feb 2024
PEPSICO Presentation to CAGNY Conference Feb 2024PEPSICO Presentation to CAGNY Conference Feb 2024
PEPSICO Presentation to CAGNY Conference Feb 2024Neil Kimberley
 
Content Methodology: A Best Practices Report (Webinar)
Content Methodology: A Best Practices Report (Webinar)Content Methodology: A Best Practices Report (Webinar)
Content Methodology: A Best Practices Report (Webinar)contently
 
How to Prepare For a Successful Job Search for 2024
How to Prepare For a Successful Job Search for 2024How to Prepare For a Successful Job Search for 2024
How to Prepare For a Successful Job Search for 2024Albert Qian
 
Social Media Marketing Trends 2024 // The Global Indie Insights
Social Media Marketing Trends 2024 // The Global Indie InsightsSocial Media Marketing Trends 2024 // The Global Indie Insights
Social Media Marketing Trends 2024 // The Global Indie InsightsKurio // The Social Media Age(ncy)
 
Trends In Paid Search: Navigating The Digital Landscape In 2024
Trends In Paid Search: Navigating The Digital Landscape In 2024Trends In Paid Search: Navigating The Digital Landscape In 2024
Trends In Paid Search: Navigating The Digital Landscape In 2024Search Engine Journal
 
5 Public speaking tips from TED - Visualized summary
5 Public speaking tips from TED - Visualized summary5 Public speaking tips from TED - Visualized summary
5 Public speaking tips from TED - Visualized summarySpeakerHub
 
ChatGPT and the Future of Work - Clark Boyd
ChatGPT and the Future of Work - Clark Boyd ChatGPT and the Future of Work - Clark Boyd
ChatGPT and the Future of Work - Clark Boyd Clark Boyd
 
Getting into the tech field. what next
Getting into the tech field. what next Getting into the tech field. what next
Getting into the tech field. what next Tessa Mero
 
Google's Just Not That Into You: Understanding Core Updates & Search Intent
Google's Just Not That Into You: Understanding Core Updates & Search IntentGoogle's Just Not That Into You: Understanding Core Updates & Search Intent
Google's Just Not That Into You: Understanding Core Updates & Search IntentLily Ray
 
Time Management & Productivity - Best Practices
Time Management & Productivity -  Best PracticesTime Management & Productivity -  Best Practices
Time Management & Productivity - Best PracticesVit Horky
 
The six step guide to practical project management
The six step guide to practical project managementThe six step guide to practical project management
The six step guide to practical project managementMindGenius
 
Beginners Guide to TikTok for Search - Rachel Pearson - We are Tilt __ Bright...
Beginners Guide to TikTok for Search - Rachel Pearson - We are Tilt __ Bright...Beginners Guide to TikTok for Search - Rachel Pearson - We are Tilt __ Bright...
Beginners Guide to TikTok for Search - Rachel Pearson - We are Tilt __ Bright...RachelPearson36
 

En vedette (20)

2024 State of Marketing Report – by Hubspot
2024 State of Marketing Report – by Hubspot2024 State of Marketing Report – by Hubspot
2024 State of Marketing Report – by Hubspot
 
Everything You Need To Know About ChatGPT
Everything You Need To Know About ChatGPTEverything You Need To Know About ChatGPT
Everything You Need To Know About ChatGPT
 
Product Design Trends in 2024 | Teenage Engineerings
Product Design Trends in 2024 | Teenage EngineeringsProduct Design Trends in 2024 | Teenage Engineerings
Product Design Trends in 2024 | Teenage Engineerings
 
How Race, Age and Gender Shape Attitudes Towards Mental Health
How Race, Age and Gender Shape Attitudes Towards Mental HealthHow Race, Age and Gender Shape Attitudes Towards Mental Health
How Race, Age and Gender Shape Attitudes Towards Mental Health
 
AI Trends in Creative Operations 2024 by Artwork Flow.pdf
AI Trends in Creative Operations 2024 by Artwork Flow.pdfAI Trends in Creative Operations 2024 by Artwork Flow.pdf
AI Trends in Creative Operations 2024 by Artwork Flow.pdf
 
Skeleton Culture Code
Skeleton Culture CodeSkeleton Culture Code
Skeleton Culture Code
 
PEPSICO Presentation to CAGNY Conference Feb 2024
PEPSICO Presentation to CAGNY Conference Feb 2024PEPSICO Presentation to CAGNY Conference Feb 2024
PEPSICO Presentation to CAGNY Conference Feb 2024
 
Content Methodology: A Best Practices Report (Webinar)
Content Methodology: A Best Practices Report (Webinar)Content Methodology: A Best Practices Report (Webinar)
Content Methodology: A Best Practices Report (Webinar)
 
How to Prepare For a Successful Job Search for 2024
How to Prepare For a Successful Job Search for 2024How to Prepare For a Successful Job Search for 2024
How to Prepare For a Successful Job Search for 2024
 
Social Media Marketing Trends 2024 // The Global Indie Insights
Social Media Marketing Trends 2024 // The Global Indie InsightsSocial Media Marketing Trends 2024 // The Global Indie Insights
Social Media Marketing Trends 2024 // The Global Indie Insights
 
Trends In Paid Search: Navigating The Digital Landscape In 2024
Trends In Paid Search: Navigating The Digital Landscape In 2024Trends In Paid Search: Navigating The Digital Landscape In 2024
Trends In Paid Search: Navigating The Digital Landscape In 2024
 
5 Public speaking tips from TED - Visualized summary
5 Public speaking tips from TED - Visualized summary5 Public speaking tips from TED - Visualized summary
5 Public speaking tips from TED - Visualized summary
 
ChatGPT and the Future of Work - Clark Boyd
ChatGPT and the Future of Work - Clark Boyd ChatGPT and the Future of Work - Clark Boyd
ChatGPT and the Future of Work - Clark Boyd
 
Getting into the tech field. what next
Getting into the tech field. what next Getting into the tech field. what next
Getting into the tech field. what next
 
Google's Just Not That Into You: Understanding Core Updates & Search Intent
Google's Just Not That Into You: Understanding Core Updates & Search IntentGoogle's Just Not That Into You: Understanding Core Updates & Search Intent
Google's Just Not That Into You: Understanding Core Updates & Search Intent
 
How to have difficult conversations
How to have difficult conversations How to have difficult conversations
How to have difficult conversations
 
Introduction to Data Science
Introduction to Data ScienceIntroduction to Data Science
Introduction to Data Science
 
Time Management & Productivity - Best Practices
Time Management & Productivity -  Best PracticesTime Management & Productivity -  Best Practices
Time Management & Productivity - Best Practices
 
The six step guide to practical project management
The six step guide to practical project managementThe six step guide to practical project management
The six step guide to practical project management
 
Beginners Guide to TikTok for Search - Rachel Pearson - We are Tilt __ Bright...
Beginners Guide to TikTok for Search - Rachel Pearson - We are Tilt __ Bright...Beginners Guide to TikTok for Search - Rachel Pearson - We are Tilt __ Bright...
Beginners Guide to TikTok for Search - Rachel Pearson - We are Tilt __ Bright...
 

Excersice 1

  • 1. Excersice 1 การเปลี่ยนแปลงอุณหภูมิในช่วง 1970-9 และ 2000-9 วัตถุประสงค์ ต้องการทราบลักษณะการเปลี่ยนแปลงอุณหภูืืืุืิมิในช่วงเวลาดังกล่าว สิ่งที่ต้องใช้ - ข้อมูลภูมิอากาศรายวันของสถานีที่ต้องการ Chantaburi.xls - โปรแกรม Excel - หรือ โปรแกรม Access เริ่มต้น 1. เปิดไฟล์ข้อมูล Chantaburi.xls เพิ่อตรวจสอบความสมบรูณ์ของข้อมูล 2. เลือกข้อมูลอุณหภูมิเฉลี่ยรายวันในช่วงที่ต้องการ คือ 1970-9 และ 2000-9 จากไฟล์ ข้อมูล Chantaburi.xls แยกเป็น ٢ ช่วงให้ชัดเจน ٣. สามารถใช้ โปรแกรม access ช่วยในการจัดการข้อมูลได้ โดย 3.1 สร้างฐานข้อมูลใหม่ ชื่อ chantaburi.mdb 3.2 จาก menu File >get external data > import เลือก file ข้อมูลภูมิอากาศ Chantaburi.xls กด import 1.3 เลือก first row contain column heading 1.4 เลือกนำาข้อมูลไปเก็บไว้ที่ In a new table และไม่ต้องกำาหนดคีย์ให้อีกแล้วหรือ เลือก no primary key 1.5 ตั้งชื่อ table chantaburi กด finish 4. เลือกข้อมูลอุณหภูมิเฉลี่ยรายวันในช่วงที่ต้องการ คือ 1970-9 และ 2000-9 4.1 new query 4.2 add table chantaburi เข้ามา ٤.٣ นำา Field year meantemp และ dday ตามเงื่อนไขข้างล่างนี้
  • 2. ٤.٤ คลิกขวาที่ query เลือก properties จะปรากฎตามภาพ กำาหนดให้ unique value มี ค่าเป็น yes 4.5 save query ชื่อ avgtemp1960-9 4.6 เปิด query ชื่อ avgtemp1960-9 จะได้ผลลัพธ์อุณหภูมิเฉลี่ย เรียงตาม อุณหภูมิจากน้อยไปมาก และจำานวนวันที่มีอุณหภูมิเท่านั้น 4.7 เลือก query ชื่อ avgtemp1960-9 แล้ว save as query ชื่อ avgtemp2000-9 4.8 เลืืิอก query ชื่อ avgtemp2000-9 มาแก้ไข ด้วย design view แก้ไขช่วงปีที่ ต้องการดึงข้อมูล “between 2000 and 2009” หรือสร้าง Query ขึ้นใหม่ด้วยวิธีการทำานองเดียวกันกับข้อ ٤.٤ -٤.١ แต่ต่างกันทีเลือกปีของข้อมูล ่ ٥. ผลลัพธ์ที่ได้นำามาวางใน excel ซึ่งสามารถสร้าื้งกราฟได้ดีกว่า ٥.١ เลือกช่วงของข้อมูลที่เป็นจำานวนวัน เลือกชนิดของกราฟเป็นเส้น แล้วกด next
  • 3. ٥.٢ ที่ Tab series มากำาหนด category (x) axis labels ให้นำาข้อมูลมาจาก ช่วงข้อมูล อุณหภูมิเฉลี่ย ٥.٣ Tab titles สามารถกำาหนดชื่อ หรือ label ต่าง ๆ ได้ เช่น avg temp 180 CHANTABURI 200 1960-9 1960-9 160 2000-9 150 140 120 frequency frequency 100 100 80 50 60 40 0 20 18 .2 20 .4 21 .3 22 .1 22 .9 23 .7 24 .5 25 .3 26 .1 26 .9 27 .7 28 .5 29 .3 0 29 20 23 26 18.2 20.6 21.2 21.8 22.4 23.6 24.8 25.4 26.6 27.2 27.8 28.4 29.6 30.2 30.8 24.2 temp temp
  • 4. ٦. สำาหรับการนำามา plot กราฟร่วมกันต้องนำามาเรียงให้อุณหภูืิมิตรงกัน ทางเลือกอื่น ๆ หรือทำาการสรุปข้อมูลเป็นกลุ่มใหญ่ ๆ เช่น อุณหภูืิมิทุก ١ องศา ซึ่งสามารถใช้ ACCESS ช่วยจัดการได้ ด้วย function Round ทำาให้อุณหภูืิมิปัดเป็นจำานวนเต็มก่อนนำามานับรวมกัน rtemp: Round([meantemp],0) ผลผลัพธ์จากการทำา Round อุณหภูืิมิ นำามาวางลงใน excel ดังตาราง นำามาทำากราฟได้ดัง ภาพ avgtemp 1960-9 2000-9 18 2 1400 average temperature 19 1 1960-9 20 9 2 1200 2000-9 21 22 3 1000 22 40 7 frequency 23 83 20 800 24 196 63 600 25 349 149 26 1011 497 400 27 1059 790 200 28 725 1218 0 29 143 652 30 13 240 18 19 20 21 22 23 24 25 26 27 28 29 30 31 31 12 temperature C คำาืำถาม ١. มีการเปลี่ยนแปลงอุณหภูมิในพื้นที่จังหวัดจันทบุรีอย่างไร ระหว่าง ٢ ช่วงที่ศึกษา ............................................................................................................................ ........................................................................................................................... .٢. อุณหภูมิสูงขึ้นหรือไม่ ค่าเฉลี่ย(mean)ของแต่ละช่วงต่างกันเท่าไร ................................. ค่า variance ของทั้ง ٢ ช่วงต่างกันหรือไม่อย่างไร...........................................................
  • 6. Excersice ٢ การเปลี่ยนแปลงภูมิอากาศจากค่าปกติ ตัวอย่าง ปริมาณนำ้าฝน วัตถุประสงค์ ต้องการทราบลักษณะการเปลี่ยนแปลงของปริมาณนำ้าฝน ปีใดที่ตำ่ากว่าค่าปกติ ปี ใดที่สูงกว่าค่าปกติ สิ่งที่ต้องใช้ - ข้อมูลภูมิอากาศรายวันของสถานีที่ต้องการ Chantaburi.xls หรือ chantaburi.mdb - โปรแกรม excel - หรือ โปรแกรม access เริ่มต้น 1. เปิดไฟล์ฐานข้อมูล chantaburi.mdb หากไม่มีให้นำาดำาเนินการตาม Excersice ١ ข้อ ٣ ٢. สรุปข้อมูลปริมาณนำ้าฝนรายปี จากข้อมูลรายวัน เนื่องจากมีข้อมูลรายวัน หากมีข้อมูลราย เดืืิอนก็สรุปมาใช้ได้ ٢.1 new query ٢.2 add table chantaburi เข้ามา ٢.٣ นำา Field year rain ตามเงื่อนไขข้างล่างนี้ หมายเหตุ ปริมาณนำ้าฝนรายปี ได้จากการรวมปริมาณนำ้าฝนในทุก ๆวันที่ตกในรอบปีเข้าด้วยกัน หากเป็นข้อมูลอื่น เช่นอุณหภูมิ ควรใช้ค่าเฉลี่ย หรือ max หรือ min แล้วแต่กรณื 2.4 save query ชื่อ rainyearly 2.5 เปิด query ชื่อ rainyearly จะได้ผลลัพธ์ ปริมาณนำ้าฝนรายปี เรียงตามปีจาก น้อยไปมาก และปริมาณนำ้าฝนในแต่ละปี 2.6 คัดลอกผลลัพธ์ลง excel 3. ต้องการทราบค่าปริมาณนำ้าฝนเฉลี่ยซึ่งจะใช้เป็นค่าปกติในการศึกษาครั้งนี้ ด้วยคำาสั่ง =AVERAGE(Xi) ٤. หาค่าส่วนต่างจากค่าปกติ จากสูตร = ((X-Mean)/Mean)*100 ตัวอย่างสูตรใน excel = (B2-$B$62)/$B$62*100 ٥. นำาข้อมูลมาสร้างกราฟ add trend line สมการ Regression และ R2 คำาืำ ถาม ١. กราฟการเปลี่ยนแปลงปริมาณนำ้าฝนเป็นอย่างไร............................................................ สมการ Regression คือ................................................................R2 คือ........................ ٢.ปีใดที่มีการเปลียนแปลงปริมาณนำ้าฝนที่สูงกว่าค่าเฉลี่ยสูงสุดทางบวก............................. ่ ....และมีค่า เท่าใด..........................................................................................................٣. ปีใด ที่มีการเปลียนแปลงปริมาณนำ้าฝนที่สูงกว่าค่าเฉลี่ยสูงสุดทางลบ.................................และมี ่ ค่าเท่าใด.........................................................................................................
  • 8. Excersice 3 การจัดเตรียมข้อมูลภูมิอากาศรายสัปดาห์จากข้อมูลรายวัน วัตถุประสงค์ ต้องการทราบวิธีการในการจัดการและสรุปข้อมูลเป็นรายสัปดาห์ สิ่งที่ต้องใช้ - ข้อมูลภูมิอากาศรายวันของสถานีที่ต้องการ chantaburi.xls หรือ chantaburi.mdb - โปรแกรม Excel - โปรแกรม Access - standard meteorological weeks เริ่มต้น 1.เปิดไฟล์ฐานข้อมูล chantaburi.mdb หากไม่มีให้นำาดำาเนินการตาม Excersice ١ ข้อ ٣ ٢. สร้างตารางข้อมูล month day week ด้วย excel แล้วนำาข้อมูลจากตารางเข้าสู่ ฐานข้อมูล chantaburi.mdb และตั้งชื่อ stdweek (ดูวิธีการนำาเข้าข้อมุล excel จาก Excersice ١) ٣. สรุปข้อมูลปริมาณนำ้าฝนรายสัปดาห์ ٣.1 new query ٣.2 add table chantaburi และ stdweek เข้ามา 3.٣ สร้างความสัมพันธ์ของ ٢ ตารางด้วย month และ day ٣.٤ นำา Field year rain ตามเงื่อนไขข้างล่างนี้ ٣.٥ save query ชื่อ rainweekly ٣.٦ เปิด query ชื่อ rainweekly จะได้ผลลัพธ์ ปริมาณนำ้าฝนรายสับดาห์เรียงตามปี จากน้อยไปมาก 3.7 คัดลอกผลลัพธ์ลง excel หรือนำาไปใช้งาน คำาืำ ถาม ١. หากต้องการข้อมูลเป็น เมตริกของปี และสัปดาห์ จะดำาเนินการอย่างไร............................. .............................................................................................................................. .............................................................................................................................. ............................................................................................................................. ... ปี/สัปดาห์ ١ ٢ ٣ ٤ ٥ ٦ ٧ ٨ ٩ ١٠ ١١ ١٩٦٠ ١٩٦١ ١٩٦٢