SlideShare une entreprise Scribd logo
1  sur  9
Télécharger pour lire hors ligne
Android Fragmentation 2014
An OpenSignal Report
ANDROID FRAGMENTATION VISUALIZED (AUGUST 2014)
Fragmentation is both a strength and weakness of the Android ecosystem,
a headache for developers that also provides the basis for Android’s
global reach. Android devices come in all shapes and sizes, with vastly
different performance levels and screen sizes. Furthermore, there are
many different versions of Android that are concurrently active at any one
time, adding another level of fragmentation. What this means is that
developing apps that work across the whole range of Android devices can
be extremely challenging and time-consuming.
Despite the problems, fragmentation also has a great number of benefits –
for both developers and users. The availability of cheap Android phones
(rarely running the most recent version) means that they have a much
greater global reach than iOS, so app developers have a wider audience to
build for. Android is successfully filling the gap left behind by the decline of
Nokia’s Symbian – and in this report we look at the different shape of
fragmentation in countries from different economic positions, as a way of showing that fragmentation benefits
Android much more than it hurts it. Android is now the dominant mobile operating system and this is because of
fragmentation, not in spite of it.
DEVICE FRAGMENTATION
18,796
Distinct Android devices seen this year
11,868
Distinct Android devices seen last year
682,000
Devices surveyed for this report.
43%
Samsung's share of those devices.
20.9%Android users on KitKat
20.9%
Android users on KitKat
Android Fragmentation 2014
An OpenSignal Report
We have seen 18,769 distinct devices download our app in the past few
months. In our report last year we saw 11,868.
This is the best way of visualizing the sheer variety of Android devices that have downloaded the OpenSignal
app over the past couple of months. This graph shows the challenge that faces Android developers; over 18,000
distinct devices can immediately use their app, making optimization a real challenge. Compared to last year,
fragmentation has risen by around 60%, with 11,868 devices seen last year compared to 18,796 this year.
Compared to our first report, in 2012, device fragmentation has more than quadrupled - with our first report
showing that there were ‘only’ 3,997 distinct Android devices. Another way of looking at how fragmentation
affects developers is to see what % of the market is occupied by the top 10 devices - as developers generally
only own a few devices to test on. Last year having the 10 most popular devices in the market would represent
21% of the devices out there, this year that number has fallen to 15% - making testing on a few devices less
representative.
BRAND FRAGMENTATION
Samsung have a 43% share of the Android market.
Android Fragmentation 2014
An OpenSignal Report
Similar to the above graph, this shows the market divided in terms of manufacturer, with Samsung once again
proving dominant. In the first fragmentation graphic Samsung had made 12 of the 13 most popular devices –
showing why they have a 43% share of the market. This is actually a slight reduction since the last report –
which showed Samsung having a 47.5% market share. Sony rank second with a 4.8% market share, showing
quite how large the gap is between Samsung and second place.
ANDROID OPERATING SYSTEM FRAGMENTATION
The Android operating system is the most fragmented it has ever been.
Device fragmentation is not the only challenge that developers face when building for Android; the operating
system itself is extremely fragmented and has only become more so over time. The above graph shows the
relative stages of Android fragmentation, and the steady decline of any one Android version having prominence
can be seen by the progress of the white line.
Android Fragmentation 2014
An OpenSignal Report
FRAGMENTATION VS GDP/CAPITA
There is a clear correlation between fragmentation and GDP/Capita
One of the strengths of Android fragmentation is that it allows for a great amount of freedom for device
manufacturers, meaning that consumers are able to get a device that perfectly fits the specifications of their
demands. This has proven especially valuable in allowing Android to take the place of Nokia’s Symbian as the
go-to OS in less economically developed countries. API fragmentation is a good proxy for fragmentation in
general, as older devices are typically running older version of Android –as they would run less well with the
more sophisticated modern versions. This graph plots GDP/capita against the market share of the top 5 Android
APIs (4 versions of Android KitKat and 4.3.1 Jelly Bean) so a higher score on the y-axis is equivalent to less
fragmentation. The correlation between the two is clear, with Qatar an obvious outlier owing to their immensely
high GDP/capita, which does not necessarily reflect the actual material conditions of the general populace.
The following bar chart breaks down the world into countries with GDP/capita > $20,000 and countries where
GDP/capita <$20,000 in order to show how the shape of Fragmentation is different. Building an app for an
economically developed market is a lot easier, with many more devices on the most recent Android versions,
with around 35% of devices in more economically developed countries on Android Kitkat, compared to around
12% for less economically developed countries.
Android Fragmentation 2014
An OpenSignal Report
COMPARISON WITH IOS
Android fragmentation of all kinds is usually illustrated in comparison with iOS. These two pie charts clearly
show the difference in API fragmentation between the two competing operating systems.
Android Fragmentation 2014
An OpenSignal Report
SENSOR FRAGMENTATION
The proliferation of sensors in Android devices allows for increasingly
sophisticated apps and networks
The above chart shows the development of Android devices in terms of the number of sensors they contain,
using the Galaxy S series to demonstrate this trend. One of the most exciting developments in mobile has been
the rise of devices that are able to collect data about the world around them, such as our crowd-sourced mobile
weather network WeatherSignal. The clearest example of this is the Galaxy series of phones, which show what
we have termed ‘sensor creep’, with manufacturers increasingly putting sophisticated sensors into the devices
they produce. This graph also shows the flip-side to that trend, which is that developers may build for certain
sensors (WeatherSignal makes use of the humidity and temperature sensors, among others) that then get
discontinued – an additional hazard of fragmentation for developers. To see a full report on the sensors
Android Fragmentation 2014
An OpenSignal Report
available in Android phones – see our brand new sensor library, which looks at which sensors are available in
Android devices as well as their frequency in the market.
SCREEN SIZE FRAGMENTATION
Key to the success of any app is getting the UI right, and Android presents two particular challenges to
developers in this regard. Firstly, brands have a tendency to produce their own variants on the system UI
(Samsung’s Touchwhizz and the HTC Sense being two such examples - which can change the look of various
default elements. Secondly, no other smartphone platform boasts such a proliferation of different screen sizes.
Designing and coding layouts that work well across all these screens is hugely challenging. Across the dozen or
so iPod-touch, iPhones and iPad varieties there are just 4 different physical screen sizes - partly due to Apple's
tendency to double pixel density while quadrupling resolution (e.g. iPad 2 -> iPad 3) maintaining the same
physical screen size. The graphic below shows iOS screen size fragmentation, allowing for an easy comparison
with Android.
Android Fragmentation 2014
An OpenSignal Report
NOTES ON METHODOLOGY
The Device Fragmentation Graphic shows the 18,796 distinct device types that were present in the last
682,000 unique devices to download our app. The reason we chose 682,000 is because we wanted to make a
fair comparison with the fragmentation reports from 2013 and 2012 , which were also based on a sample of
682,000 devices.
The Brand Fragmentation Graphic is based on the same 682,000 devices as the device fragmentation
graphic.
The API Level Fragmentation Graphic is based on data made publicly available by Google.
Android Fragmentation 2014
An OpenSignal Report
GDP per Capita data is from IMF data from 2013 (via Wikipedia)
iOS API pie chart is based on data made publicly available by Apple.
The Android Screen Size Graphic is based on information from almost 10 million OpenSignal users. In this
graphic we are showing physical screen size, not size in pixels. Changes in resolution at the same screen size
(for example as between the iPad 3 and iPad 2) present fewer difficulties for developers than changes in
physical size. We derive the screen size by dividing the number of pixels of height and width by the pixel density
(points per inch - ppi). Ideally we would use separate values for X-density and Y-density as screens are
sometimes manufactured with different ppi in different directions, however Android only gives access to one
variable. Also worth noting: with rooted devices users are able to “alter” the pixel density - in reality the physical
characteristics of the screen stay the same, but the Android OS thinks it’s running on a larger device.
If you have any questions on the 2014 Fragmentation report then please contact Sam at sam@opensignal.com


Contenu connexe

Tendances

Appcelerator report-q3-2012-final
Appcelerator report-q3-2012-finalAppcelerator report-q3-2012-final
Appcelerator report-q3-2012-final
Daria Berger
 
Android and android phones
Android and android phonesAndroid and android phones
Android and android phones
Dorothy Marcella
 
Android and android phones
Android and android phonesAndroid and android phones
Android and android phones
noeyes15
 
Android and android phones
Android and android phonesAndroid and android phones
Android and android phones
akosipalos
 
Powerpointactivity2
Powerpointactivity2Powerpointactivity2
Powerpointactivity2
Cj Aquino
 
Power point activity 2
Power point activity 2Power point activity 2
Power point activity 2
ianoblepias
 

Tendances (17)

IDC Q3 2012 Mobile Developer Report
IDC Q3 2012 Mobile Developer ReportIDC Q3 2012 Mobile Developer Report
IDC Q3 2012 Mobile Developer Report
 
Appcelerator report-q3-2012-final
Appcelerator report-q3-2012-finalAppcelerator report-q3-2012-final
Appcelerator report-q3-2012-final
 
Power point activity 2
Power point activity 2Power point activity 2
Power point activity 2
 
Power point activity 2
Power point activity 2Power point activity 2
Power point activity 2
 
Android and android phones
Android and android phonesAndroid and android phones
Android and android phones
 
Android Application Development
Android Application DevelopmentAndroid Application Development
Android Application Development
 
Powerpoint act2
Powerpoint act2Powerpoint act2
Powerpoint act2
 
Android and android phones
Android and android phonesAndroid and android phones
Android and android phones
 
Let's Talk Android
Let's Talk AndroidLet's Talk Android
Let's Talk Android
 
Android and android phones
Android and android phonesAndroid and android phones
Android and android phones
 
Shamit khemka discusses future of android software development
Shamit khemka discusses future of android software developmentShamit khemka discusses future of android software development
Shamit khemka discusses future of android software development
 
Android Presentation
Android PresentationAndroid Presentation
Android Presentation
 
The Importance of Object-Oriented Programming in This Era of Mobile Applicati...
The Importance of Object-Oriented Programming in This Era of Mobile Applicati...The Importance of Object-Oriented Programming in This Era of Mobile Applicati...
The Importance of Object-Oriented Programming in This Era of Mobile Applicati...
 
Mobile megatrends 2012
Mobile megatrends 2012Mobile megatrends 2012
Mobile megatrends 2012
 
11 Most Amazing Facts About Mobile Apps Development
11 Most Amazing Facts About Mobile Apps Development11 Most Amazing Facts About Mobile Apps Development
11 Most Amazing Facts About Mobile Apps Development
 
Powerpointactivity2
Powerpointactivity2Powerpointactivity2
Powerpointactivity2
 
Power point activity 2
Power point activity 2Power point activity 2
Power point activity 2
 

Similaire à Open Signal 2014 Android Fragmentation Report

Millennialmedia mobilemix Q2 2013
Millennialmedia mobilemix Q2 2013Millennialmedia mobilemix Q2 2013
Millennialmedia mobilemix Q2 2013
Sergey Polovnikov
 

Similaire à Open Signal 2014 Android Fragmentation Report (20)

Android
AndroidAndroid
Android
 
1.iOS vs Android Development_ What’s the Difference_.pdf
1.iOS vs Android Development_ What’s the Difference_.pdf1.iOS vs Android Development_ What’s the Difference_.pdf
1.iOS vs Android Development_ What’s the Difference_.pdf
 
Android technlogy
Android technlogyAndroid technlogy
Android technlogy
 
Android as a technology
Android as a technologyAndroid as a technology
Android as a technology
 
Reasons to Develop Your Next App in Android
Reasons to Develop Your Next App in AndroidReasons to Develop Your Next App in Android
Reasons to Develop Your Next App in Android
 
Mobile Convention Brussels 2014 - Chris Heilmann
Mobile Convention Brussels 2014 - Chris HeilmannMobile Convention Brussels 2014 - Chris Heilmann
Mobile Convention Brussels 2014 - Chris Heilmann
 
Android Application Development
Android Application DevelopmentAndroid Application Development
Android Application Development
 
Presentation On Android OS
Presentation On Android OSPresentation On Android OS
Presentation On Android OS
 
Clear Reasons Why Android App Development is Preferable for Developing On-dem...
Clear Reasons Why Android App Development is Preferable for Developing On-dem...Clear Reasons Why Android App Development is Preferable for Developing On-dem...
Clear Reasons Why Android App Development is Preferable for Developing On-dem...
 
2. Android VS iOS _ Mobile App Development - HKInfoway Technologies.pdf
2. Android VS iOS _ Mobile App Development - HKInfoway Technologies.pdf2. Android VS iOS _ Mobile App Development - HKInfoway Technologies.pdf
2. Android VS iOS _ Mobile App Development - HKInfoway Technologies.pdf
 
Adobe Digital Index Q2 2013
Adobe Digital Index Q2 2013Adobe Digital Index Q2 2013
Adobe Digital Index Q2 2013
 
whyglobal services.pptx
whyglobal services.pptxwhyglobal services.pptx
whyglobal services.pptx
 
Android L
Android LAndroid L
Android L
 
Android & iOS Marketplace in Development Era
Android & iOS Marketplace in Development EraAndroid & iOS Marketplace in Development Era
Android & iOS Marketplace in Development Era
 
Millennialmedia mobilemix Q2 2013
Millennialmedia mobilemix Q2 2013Millennialmedia mobilemix Q2 2013
Millennialmedia mobilemix Q2 2013
 
Millennial Media's Q2 2013 Mobile Mix Report
Millennial Media's Q2 2013 Mobile Mix ReportMillennial Media's Q2 2013 Mobile Mix Report
Millennial Media's Q2 2013 Mobile Mix Report
 
Android workshop sn tech solutions
Android workshop sn tech solutionsAndroid workshop sn tech solutions
Android workshop sn tech solutions
 
ios vs android development – key differences
ios vs android development – key differencesios vs android development – key differences
ios vs android development – key differences
 
Android-Ppt.pptx
Android-Ppt.pptxAndroid-Ppt.pptx
Android-Ppt.pptx
 
Android operating system-Ppt.pptx
Android operating system-Ppt.pptxAndroid operating system-Ppt.pptx
Android operating system-Ppt.pptx
 

Plus de Dario Caliendo

iOS backdoors attack points and surveillance mechanisms
iOS backdoors attack points and surveillance mechanismsiOS backdoors attack points and surveillance mechanisms
iOS backdoors attack points and surveillance mechanisms
Dario Caliendo
 
Samsung Sustainability reports 2014
Samsung Sustainability reports 2014Samsung Sustainability reports 2014
Samsung Sustainability reports 2014
Dario Caliendo
 
Aumento Equo Compenso: ecco la tabella ufficiale con tutti in rincari di smar...
Aumento Equo Compenso: ecco la tabella ufficiale con tutti in rincari di smar...Aumento Equo Compenso: ecco la tabella ufficiale con tutti in rincari di smar...
Aumento Equo Compenso: ecco la tabella ufficiale con tutti in rincari di smar...
Dario Caliendo
 
Audiweb @ Iab Seminar Mobile & Advertising
Audiweb @ Iab Seminar Mobile & AdvertisingAudiweb @ Iab Seminar Mobile & Advertising
Audiweb @ Iab Seminar Mobile & Advertising
Dario Caliendo
 
Auricolari, svelato il mistero dei nodi nei cavi
Auricolari, svelato il mistero dei nodi nei caviAuricolari, svelato il mistero dei nodi nei cavi
Auricolari, svelato il mistero dei nodi nei cavi
Dario Caliendo
 
Le 250 nuove Emoticon che saranno introdotte a Luglio 2014
Le 250 nuove Emoticon che saranno introdotte a Luglio 2014Le 250 nuove Emoticon che saranno introdotte a Luglio 2014
Le 250 nuove Emoticon che saranno introdotte a Luglio 2014
Dario Caliendo
 
Calcoli tariffe 2013-2014
Calcoli tariffe 2013-2014Calcoli tariffe 2013-2014
Calcoli tariffe 2013-2014
Dario Caliendo
 
Brevetto Apple: Sistemi e metodi di controllo della fotocamera
Brevetto Apple: Sistemi e metodi di controllo della fotocameraBrevetto Apple: Sistemi e metodi di controllo della fotocamera
Brevetto Apple: Sistemi e metodi di controllo della fotocamera
Dario Caliendo
 
Samsung, in arrivo uno smartwatch indipendente che non richiederà uno smartphone
Samsung, in arrivo uno smartwatch indipendente che non richiederà uno smartphoneSamsung, in arrivo uno smartwatch indipendente che non richiederà uno smartphone
Samsung, in arrivo uno smartwatch indipendente che non richiederà uno smartphone
Dario Caliendo
 
Cider, avviare le applicazoni iOS su Android
Cider, avviare le applicazoni iOS su AndroidCider, avviare le applicazoni iOS su Android
Cider, avviare le applicazoni iOS su Android
Dario Caliendo
 
Equo compenso: sondaggio copia privata Quorum
Equo compenso: sondaggio copia privata QuorumEquo compenso: sondaggio copia privata Quorum
Equo compenso: sondaggio copia privata Quorum
Dario Caliendo
 
Apple Q2 fy14 earnings financials
Apple Q2 fy14 earnings financialsApple Q2 fy14 earnings financials
Apple Q2 fy14 earnings financials
Dario Caliendo
 
Apple Patent: Sports monitoring system for headphones, earbuds and/or headsets
Apple Patent: Sports monitoring system for headphones, earbuds and/or headsetsApple Patent: Sports monitoring system for headphones, earbuds and/or headsets
Apple Patent: Sports monitoring system for headphones, earbuds and/or headsets
Dario Caliendo
 
Anti social media - Racism on Twitter
Anti social media - Racism on TwitterAnti social media - Racism on Twitter
Anti social media - Racism on Twitter
Dario Caliendo
 
Brevetto Apple per la modifica dei messaggi dopo l'invio
Brevetto Apple per la modifica dei messaggi dopo l'invioBrevetto Apple per la modifica dei messaggi dopo l'invio
Brevetto Apple per la modifica dei messaggi dopo l'invio
Dario Caliendo
 

Plus de Dario Caliendo (20)

Siri su Mac: il brevetto di Apple
Siri su Mac: il brevetto di AppleSiri su Mac: il brevetto di Apple
Siri su Mac: il brevetto di Apple
 
Eyeglasses-free Display: Towards Correcting Visual Aberrations with Computati...
Eyeglasses-free Display: Towards Correcting Visual Aberrations with Computati...Eyeglasses-free Display: Towards Correcting Visual Aberrations with Computati...
Eyeglasses-free Display: Towards Correcting Visual Aberrations with Computati...
 
Ip 14-847 en
Ip 14-847 enIp 14-847 en
Ip 14-847 en
 
iOS backdoors attack points and surveillance mechanisms
iOS backdoors attack points and surveillance mechanismsiOS backdoors attack points and surveillance mechanisms
iOS backdoors attack points and surveillance mechanisms
 
Samsung Sustainability reports 2014
Samsung Sustainability reports 2014Samsung Sustainability reports 2014
Samsung Sustainability reports 2014
 
Aumento Equo Compenso: ecco la tabella ufficiale con tutti in rincari di smar...
Aumento Equo Compenso: ecco la tabella ufficiale con tutti in rincari di smar...Aumento Equo Compenso: ecco la tabella ufficiale con tutti in rincari di smar...
Aumento Equo Compenso: ecco la tabella ufficiale con tutti in rincari di smar...
 
Audiweb @ Iab Seminar Mobile & Advertising
Audiweb @ Iab Seminar Mobile & AdvertisingAudiweb @ Iab Seminar Mobile & Advertising
Audiweb @ Iab Seminar Mobile & Advertising
 
Auricolari, svelato il mistero dei nodi nei cavi
Auricolari, svelato il mistero dei nodi nei caviAuricolari, svelato il mistero dei nodi nei cavi
Auricolari, svelato il mistero dei nodi nei cavi
 
Le 250 nuove Emoticon che saranno introdotte a Luglio 2014
Le 250 nuove Emoticon che saranno introdotte a Luglio 2014Le 250 nuove Emoticon che saranno introdotte a Luglio 2014
Le 250 nuove Emoticon che saranno introdotte a Luglio 2014
 
Calcoli tariffe 2013-2014
Calcoli tariffe 2013-2014Calcoli tariffe 2013-2014
Calcoli tariffe 2013-2014
 
Internet Trends 2014
Internet Trends 2014Internet Trends 2014
Internet Trends 2014
 
Brevetto Apple: Sistemi e metodi di controllo della fotocamera
Brevetto Apple: Sistemi e metodi di controllo della fotocameraBrevetto Apple: Sistemi e metodi di controllo della fotocamera
Brevetto Apple: Sistemi e metodi di controllo della fotocamera
 
Samsung, in arrivo uno smartwatch indipendente che non richiederà uno smartphone
Samsung, in arrivo uno smartwatch indipendente che non richiederà uno smartphoneSamsung, in arrivo uno smartwatch indipendente che non richiederà uno smartphone
Samsung, in arrivo uno smartwatch indipendente che non richiederà uno smartphone
 
Cider, avviare le applicazoni iOS su Android
Cider, avviare le applicazoni iOS su AndroidCider, avviare le applicazoni iOS su Android
Cider, avviare le applicazoni iOS su Android
 
Equo compenso: sondaggio copia privata Quorum
Equo compenso: sondaggio copia privata QuorumEquo compenso: sondaggio copia privata Quorum
Equo compenso: sondaggio copia privata Quorum
 
Apple Q2 fy14 earnings financials
Apple Q2 fy14 earnings financialsApple Q2 fy14 earnings financials
Apple Q2 fy14 earnings financials
 
The future of digital trust
The future of digital trust The future of digital trust
The future of digital trust
 
Apple Patent: Sports monitoring system for headphones, earbuds and/or headsets
Apple Patent: Sports monitoring system for headphones, earbuds and/or headsetsApple Patent: Sports monitoring system for headphones, earbuds and/or headsets
Apple Patent: Sports monitoring system for headphones, earbuds and/or headsets
 
Anti social media - Racism on Twitter
Anti social media - Racism on TwitterAnti social media - Racism on Twitter
Anti social media - Racism on Twitter
 
Brevetto Apple per la modifica dei messaggi dopo l'invio
Brevetto Apple per la modifica dei messaggi dopo l'invioBrevetto Apple per la modifica dei messaggi dopo l'invio
Brevetto Apple per la modifica dei messaggi dopo l'invio
 

Dernier

Why Teams call analytics are critical to your entire business
Why Teams call analytics are critical to your entire businessWhy Teams call analytics are critical to your entire business
Why Teams call analytics are critical to your entire business
panagenda
 

Dernier (20)

AXA XL - Insurer Innovation Award Americas 2024
AXA XL - Insurer Innovation Award Americas 2024AXA XL - Insurer Innovation Award Americas 2024
AXA XL - Insurer Innovation Award Americas 2024
 
ProductAnonymous-April2024-WinProductDiscovery-MelissaKlemke
ProductAnonymous-April2024-WinProductDiscovery-MelissaKlemkeProductAnonymous-April2024-WinProductDiscovery-MelissaKlemke
ProductAnonymous-April2024-WinProductDiscovery-MelissaKlemke
 
FWD Group - Insurer Innovation Award 2024
FWD Group - Insurer Innovation Award 2024FWD Group - Insurer Innovation Award 2024
FWD Group - Insurer Innovation Award 2024
 
Strategize a Smooth Tenant-to-tenant Migration and Copilot Takeoff
Strategize a Smooth Tenant-to-tenant Migration and Copilot TakeoffStrategize a Smooth Tenant-to-tenant Migration and Copilot Takeoff
Strategize a Smooth Tenant-to-tenant Migration and Copilot Takeoff
 
"I see eyes in my soup": How Delivery Hero implemented the safety system for ...
"I see eyes in my soup": How Delivery Hero implemented the safety system for ..."I see eyes in my soup": How Delivery Hero implemented the safety system for ...
"I see eyes in my soup": How Delivery Hero implemented the safety system for ...
 
Apidays New York 2024 - Accelerating FinTech Innovation by Vasa Krishnan, Fin...
Apidays New York 2024 - Accelerating FinTech Innovation by Vasa Krishnan, Fin...Apidays New York 2024 - Accelerating FinTech Innovation by Vasa Krishnan, Fin...
Apidays New York 2024 - Accelerating FinTech Innovation by Vasa Krishnan, Fin...
 
Polkadot JAM Slides - Token2049 - By Dr. Gavin Wood
Polkadot JAM Slides - Token2049 - By Dr. Gavin WoodPolkadot JAM Slides - Token2049 - By Dr. Gavin Wood
Polkadot JAM Slides - Token2049 - By Dr. Gavin Wood
 
Ransomware_Q4_2023. The report. [EN].pdf
Ransomware_Q4_2023. The report. [EN].pdfRansomware_Q4_2023. The report. [EN].pdf
Ransomware_Q4_2023. The report. [EN].pdf
 
TrustArc Webinar - Stay Ahead of US State Data Privacy Law Developments
TrustArc Webinar - Stay Ahead of US State Data Privacy Law DevelopmentsTrustArc Webinar - Stay Ahead of US State Data Privacy Law Developments
TrustArc Webinar - Stay Ahead of US State Data Privacy Law Developments
 
Strategies for Unlocking Knowledge Management in Microsoft 365 in the Copilot...
Strategies for Unlocking Knowledge Management in Microsoft 365 in the Copilot...Strategies for Unlocking Knowledge Management in Microsoft 365 in the Copilot...
Strategies for Unlocking Knowledge Management in Microsoft 365 in the Copilot...
 
Navi Mumbai Call Girls 🥰 8617370543 Service Offer VIP Hot Model
Navi Mumbai Call Girls 🥰 8617370543 Service Offer VIP Hot ModelNavi Mumbai Call Girls 🥰 8617370543 Service Offer VIP Hot Model
Navi Mumbai Call Girls 🥰 8617370543 Service Offer VIP Hot Model
 
presentation ICT roal in 21st century education
presentation ICT roal in 21st century educationpresentation ICT roal in 21st century education
presentation ICT roal in 21st century education
 
Why Teams call analytics are critical to your entire business
Why Teams call analytics are critical to your entire businessWhy Teams call analytics are critical to your entire business
Why Teams call analytics are critical to your entire business
 
Axa Assurance Maroc - Insurer Innovation Award 2024
Axa Assurance Maroc - Insurer Innovation Award 2024Axa Assurance Maroc - Insurer Innovation Award 2024
Axa Assurance Maroc - Insurer Innovation Award 2024
 
DBX First Quarter 2024 Investor Presentation
DBX First Quarter 2024 Investor PresentationDBX First Quarter 2024 Investor Presentation
DBX First Quarter 2024 Investor Presentation
 
MINDCTI Revenue Release Quarter One 2024
MINDCTI Revenue Release Quarter One 2024MINDCTI Revenue Release Quarter One 2024
MINDCTI Revenue Release Quarter One 2024
 
Apidays New York 2024 - The Good, the Bad and the Governed by David O'Neill, ...
Apidays New York 2024 - The Good, the Bad and the Governed by David O'Neill, ...Apidays New York 2024 - The Good, the Bad and the Governed by David O'Neill, ...
Apidays New York 2024 - The Good, the Bad and the Governed by David O'Neill, ...
 
Mastering MySQL Database Architecture: Deep Dive into MySQL Shell and MySQL R...
Mastering MySQL Database Architecture: Deep Dive into MySQL Shell and MySQL R...Mastering MySQL Database Architecture: Deep Dive into MySQL Shell and MySQL R...
Mastering MySQL Database Architecture: Deep Dive into MySQL Shell and MySQL R...
 
MS Copilot expands with MS Graph connectors
MS Copilot expands with MS Graph connectorsMS Copilot expands with MS Graph connectors
MS Copilot expands with MS Graph connectors
 
A Year of the Servo Reboot: Where Are We Now?
A Year of the Servo Reboot: Where Are We Now?A Year of the Servo Reboot: Where Are We Now?
A Year of the Servo Reboot: Where Are We Now?
 

Open Signal 2014 Android Fragmentation Report

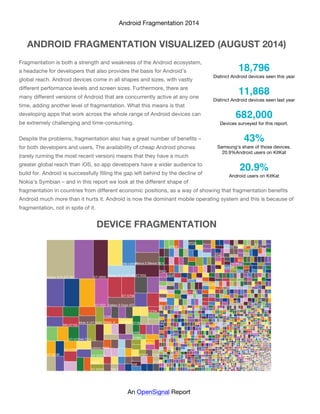
  • 1. Android Fragmentation 2014 An OpenSignal Report ANDROID FRAGMENTATION VISUALIZED (AUGUST 2014) Fragmentation is both a strength and weakness of the Android ecosystem, a headache for developers that also provides the basis for Android’s global reach. Android devices come in all shapes and sizes, with vastly different performance levels and screen sizes. Furthermore, there are many different versions of Android that are concurrently active at any one time, adding another level of fragmentation. What this means is that developing apps that work across the whole range of Android devices can be extremely challenging and time-consuming. Despite the problems, fragmentation also has a great number of benefits – for both developers and users. The availability of cheap Android phones (rarely running the most recent version) means that they have a much greater global reach than iOS, so app developers have a wider audience to build for. Android is successfully filling the gap left behind by the decline of Nokia’s Symbian – and in this report we look at the different shape of fragmentation in countries from different economic positions, as a way of showing that fragmentation benefits Android much more than it hurts it. Android is now the dominant mobile operating system and this is because of fragmentation, not in spite of it. DEVICE FRAGMENTATION 18,796 Distinct Android devices seen this year 11,868 Distinct Android devices seen last year 682,000 Devices surveyed for this report. 43% Samsung's share of those devices. 20.9%Android users on KitKat 20.9% Android users on KitKat
  • 2. Android Fragmentation 2014 An OpenSignal Report We have seen 18,769 distinct devices download our app in the past few months. In our report last year we saw 11,868. This is the best way of visualizing the sheer variety of Android devices that have downloaded the OpenSignal app over the past couple of months. This graph shows the challenge that faces Android developers; over 18,000 distinct devices can immediately use their app, making optimization a real challenge. Compared to last year, fragmentation has risen by around 60%, with 11,868 devices seen last year compared to 18,796 this year. Compared to our first report, in 2012, device fragmentation has more than quadrupled - with our first report showing that there were ‘only’ 3,997 distinct Android devices. Another way of looking at how fragmentation affects developers is to see what % of the market is occupied by the top 10 devices - as developers generally only own a few devices to test on. Last year having the 10 most popular devices in the market would represent 21% of the devices out there, this year that number has fallen to 15% - making testing on a few devices less representative. BRAND FRAGMENTATION Samsung have a 43% share of the Android market.
  • 3. Android Fragmentation 2014 An OpenSignal Report Similar to the above graph, this shows the market divided in terms of manufacturer, with Samsung once again proving dominant. In the first fragmentation graphic Samsung had made 12 of the 13 most popular devices – showing why they have a 43% share of the market. This is actually a slight reduction since the last report – which showed Samsung having a 47.5% market share. Sony rank second with a 4.8% market share, showing quite how large the gap is between Samsung and second place. ANDROID OPERATING SYSTEM FRAGMENTATION The Android operating system is the most fragmented it has ever been. Device fragmentation is not the only challenge that developers face when building for Android; the operating system itself is extremely fragmented and has only become more so over time. The above graph shows the relative stages of Android fragmentation, and the steady decline of any one Android version having prominence can be seen by the progress of the white line.
  • 4. Android Fragmentation 2014 An OpenSignal Report FRAGMENTATION VS GDP/CAPITA There is a clear correlation between fragmentation and GDP/Capita One of the strengths of Android fragmentation is that it allows for a great amount of freedom for device manufacturers, meaning that consumers are able to get a device that perfectly fits the specifications of their demands. This has proven especially valuable in allowing Android to take the place of Nokia’s Symbian as the go-to OS in less economically developed countries. API fragmentation is a good proxy for fragmentation in general, as older devices are typically running older version of Android –as they would run less well with the more sophisticated modern versions. This graph plots GDP/capita against the market share of the top 5 Android APIs (4 versions of Android KitKat and 4.3.1 Jelly Bean) so a higher score on the y-axis is equivalent to less fragmentation. The correlation between the two is clear, with Qatar an obvious outlier owing to their immensely high GDP/capita, which does not necessarily reflect the actual material conditions of the general populace. The following bar chart breaks down the world into countries with GDP/capita > $20,000 and countries where GDP/capita <$20,000 in order to show how the shape of Fragmentation is different. Building an app for an economically developed market is a lot easier, with many more devices on the most recent Android versions, with around 35% of devices in more economically developed countries on Android Kitkat, compared to around 12% for less economically developed countries.
  • 5. Android Fragmentation 2014 An OpenSignal Report COMPARISON WITH IOS Android fragmentation of all kinds is usually illustrated in comparison with iOS. These two pie charts clearly show the difference in API fragmentation between the two competing operating systems.
  • 6. Android Fragmentation 2014 An OpenSignal Report SENSOR FRAGMENTATION The proliferation of sensors in Android devices allows for increasingly sophisticated apps and networks The above chart shows the development of Android devices in terms of the number of sensors they contain, using the Galaxy S series to demonstrate this trend. One of the most exciting developments in mobile has been the rise of devices that are able to collect data about the world around them, such as our crowd-sourced mobile weather network WeatherSignal. The clearest example of this is the Galaxy series of phones, which show what we have termed ‘sensor creep’, with manufacturers increasingly putting sophisticated sensors into the devices they produce. This graph also shows the flip-side to that trend, which is that developers may build for certain sensors (WeatherSignal makes use of the humidity and temperature sensors, among others) that then get discontinued – an additional hazard of fragmentation for developers. To see a full report on the sensors
  • 7. Android Fragmentation 2014 An OpenSignal Report available in Android phones – see our brand new sensor library, which looks at which sensors are available in Android devices as well as their frequency in the market. SCREEN SIZE FRAGMENTATION Key to the success of any app is getting the UI right, and Android presents two particular challenges to developers in this regard. Firstly, brands have a tendency to produce their own variants on the system UI (Samsung’s Touchwhizz and the HTC Sense being two such examples - which can change the look of various default elements. Secondly, no other smartphone platform boasts such a proliferation of different screen sizes. Designing and coding layouts that work well across all these screens is hugely challenging. Across the dozen or so iPod-touch, iPhones and iPad varieties there are just 4 different physical screen sizes - partly due to Apple's tendency to double pixel density while quadrupling resolution (e.g. iPad 2 -> iPad 3) maintaining the same physical screen size. The graphic below shows iOS screen size fragmentation, allowing for an easy comparison with Android.
  • 8. Android Fragmentation 2014 An OpenSignal Report NOTES ON METHODOLOGY The Device Fragmentation Graphic shows the 18,796 distinct device types that were present in the last 682,000 unique devices to download our app. The reason we chose 682,000 is because we wanted to make a fair comparison with the fragmentation reports from 2013 and 2012 , which were also based on a sample of 682,000 devices. The Brand Fragmentation Graphic is based on the same 682,000 devices as the device fragmentation graphic. The API Level Fragmentation Graphic is based on data made publicly available by Google.
  • 9. Android Fragmentation 2014 An OpenSignal Report GDP per Capita data is from IMF data from 2013 (via Wikipedia) iOS API pie chart is based on data made publicly available by Apple. The Android Screen Size Graphic is based on information from almost 10 million OpenSignal users. In this graphic we are showing physical screen size, not size in pixels. Changes in resolution at the same screen size (for example as between the iPad 3 and iPad 2) present fewer difficulties for developers than changes in physical size. We derive the screen size by dividing the number of pixels of height and width by the pixel density (points per inch - ppi). Ideally we would use separate values for X-density and Y-density as screens are sometimes manufactured with different ppi in different directions, however Android only gives access to one variable. Also worth noting: with rooted devices users are able to “alter” the pixel density - in reality the physical characteristics of the screen stay the same, but the Android OS thinks it’s running on a larger device. If you have any questions on the 2014 Fragmentation report then please contact Sam at sam@opensignal.com