SlideShare une entreprise Scribd logo
1  sur  73
Télécharger pour lire hors ligne
1
Living with a Plug-in
Electric Car in Canberra
Dave Southgate
August 2014
Driving towards a
sustainable ACT
2
FOREWORD
The electric car has arrived!
After decades of false starts, production models of plug-in electric vehicles (EVs) are now globally
available from major car manufacturers. They are beautiful to drive and cost very little to run.
However, at the moment they cost more to buy and generally have a shorter range than
conventional cars.
The sales of EVs are growing rapidly around the world – more than 500,000 plug-in EVs have been
sold globally over the past three years. To date this revolution has largely passed Australia by. It is
exceptional to see a plug-in electric car on the streets in Canberra and the mainstream media in
Australia rarely reports on this fundamental transition in the fuelling of the world’s land transport.
I have therefore produced this book in an attempt to both raise awareness of the practicalities of
owning an EV in Canberra and, probably more importantly, to draw attention to how the advent of
the EV provides the ACT with opportunities to establish a sustainable future.
The introduction of EVs into Canberra is particularly important given the wonderful strides that the
ACT Government has made in introducing renewable energy into the Territory. By 2020 90% of our
electricity consumption should be derived from renewables. An electricity sector based on
renewables opens up a vision of carbon free urban transport. At the present time the electricity and
transport sectors make up about 85% of the ACT carbon footprint – the path to almost total
elimination of carbon from these two sectors is now in sight.
While this book is focussed on action within the ACT I think much of the material has wider
applicability. Many cities and regions around the world are now moving towards carbon neutrality -
I imagine the EV has a place in all of these.
Dave Southgate
Canberra
Australian Capital Territory (ACT)
August 2014
________________________________________________
Disclaimer
The author has no commercial interests in the electric vehicle or renewable energy industries. He is
self-funded and has produced this document purely in pursuit of a personal wish to see society
adopt more sustainable transport options.
Cover Photo: A Leaf among leaves – Parliament House, Canberra
©dsouthgate 2014
Any material in this document may be freely reproduced and distributed without acknowledgement.
3
SNAPSHOT
Is Canberra a Good Place to Own an Electric Vehicle?
Absolutely! I don’t think I’ll ever go back to owning a conventional petrol car.
An electric car makes an ideal city car for the Canberra resident.
Electric cars are great to drive and ‘filling up’ at home is extremely convenient.
Why Electric Vehicles?
Electric vehicles are rapidly being introduced around the world. There are three key drivers:
 climate change
 air quality
 energy security
Advances in battery technology mean electric vehicles are now economic and practical.
Key Information
 For many motorists the life cycle costs of owning an electric car (EV) are now
likely to be less than for owning a petrol car. An EV costs more to buy than a
conventional car but the fuel costs are less.
 I estimate that after about 10 years the total costs for my EV will be the same
as if I’d bought a petrol car.
 On average I travel about 40km/day in my EV which is about 15,000km/year.
Two hours of charging for my car provides about 50km range.
 My electric car uses about 7kWh/day. The annual fuel cost to run my electric
car will be around $400 compared to $2,000 for my previous petrol car.
 The day-to-day minimum range of my car is about 100km – more than enough
for a city car in Canberra.
 I have a 2kW solar PV system which generates around the same amount of
energy in a year as my car uses to travel about 15,000km.
Sustainable Canberra
The ACT Government has adopted a goal of 90% of the Territory’s electricity consumption
being sourced from renewables by 2020. By 2018 the transport sector will become the
largest component of the ACT’s carbon footprint.
The 90% renewables goal underpins climate change action in the electricity sector. The
development of a parallel goal for the uptake of electric vehicles could provide a vital
stimulus for CO2 management in the transport sector.
4
CHAPTER 1
INTRODUCTION
Page 5
Page 3CHAPTER 2
Buying and Using
My Car
Page 14
CHAPTER 3
Charging the
Battery
Page 22
CHAPTER 5
The Costs
Page 35
CHAPTER 4
My Solar System
Page 29
CHAPTER 7
Action Options
Page 53
CHAPTER 6
Role of the EV
Page 44
Author
Page 73
APPENDIX
Page 62
Part I
MY ELECTRIC
CAR PROJECT
Part 2
SUSTAINABLE
CANBERRA
CONTENTS
[These are live tiles – click to select]
5
Introduction
1.1 The Rebirth of the Electric Vehicle
The electric vehicle (EV) has been with us for a long time. In the late 1800s and early 1900s electric
powered cars outsold petrol cars but as motoring developed liquid fuelled cars became established
due to their greater range and speed of re-fuelling. While petrol and diesel fuels have dominated
road vehicles for over a century, during that time electricity has been widely used to power public
transport (for example trams and trolley buses) and many attempts have been made to produce
workable electric cars.1
Small groups of enthusiasts have continued to use and promote electric
cars. In recent years there have been a number of electric vehicle festivals in Canberra which have
showcased the latest EV developments.
Until recently most electric cars on the road have been conversions of commercial petrol cars.
However, in the past three years there has been a dramatic EV renaissance. Advances in battery
technology have led to EVs now becoming both technically feasible and affordable. Around 2010,
the major car manufacturers began producing, and selling globally, plug-in electric cars. Figure 1.1
shows the trends in global sales of plug-in electric passenger cars since 2009 (this dramatic increase
is off a very low base).2
Production electric vehicles are now readily available in many countries and
it appears that the EV is transitioning from an enthusiasts’ niche to the mainstream. Global EV sales
are currently doubling every year and if these trends continue there will be more than 1,000,000 EVs
on world roads by 2016.3
While sales around the world have surged, Australia has not contributed
significantly to this trend. Only about 100 EVs were sold to private individuals in Australia in 2013.4
1 Electric cars and history. Edison Tech Center: http://www.edisontechcenter.org/ElectricCars.html
2 Driving electrification: A global comparison of fiscal policy for electric vehicles. Figure 1. ICCT. May 2014:
http://theicct.org/driving-electrification-global-comparison-fiscal-policy-electric-vehicles
3 Electric car sales have doubled every year for three years. Transport Evolved. April 2014:
http://transportevolved.com/2014/04/16/number-electric-cars-world-doubled-past-year-say-academics/
4 2013 Plug-in EV sales in Australia. InsideEVs: http://insideevs.com/2013-plug-in-electric-vehicle-sales-in-australia/
Figure 1.1: Global sales of plug-in electric
passenger cars, 2009-2013
CONTENTS: Snapshot Introduction My Car Battery Solar PV Costs Sustainable ACT Appendix Author
6
1.2 The Pressures for Change
There are many reasons why electric vehicles are now starting to make a comeback. The Box on the
next page summarises the key reasons why governments are promoting the transition to EVs. The
pressures are varied and different governments clearly place different emphasis on the reasons for
wanting to electrify their transport systems.
Many individuals, and governments, see the
need to address climate change as the main
imperative to adopt EVs. However, EV
detractors commonly express the view that if
an EV is charged from an electricity network
based on coal fired generation there may be
no, or very small, climate change advantages
to using EVs.5
Figure 1.2 captures the essence
of this issue.6
The information in this diagram
suggests that a petrol car with a fuel
efficiency of 8l/100km has the same life cycle
carbon footprint as an electric car which is
powered by electricity sourced from coal.
This is a complex area which is worthy of
examination but in the context of the ACT,
where the Territory is rapidly moving toward
90% of its electricity being sourced from
renewables, this does not appear to be a
significant issue.
While air quality may not be a major driver for the ACT
government or residents to opt for EVs, it is a top
priority in countries with urban air quality problems.
The modern EV has its origins in California where in
1990 the State government mandated that from 2003
10% of all vehicle sales must be zero emissions in order
to address air quality issues.7
In China air quality is one
of the key political issues of the day (see Figure 1.3)8
. In
March this year, restrictions were placed on
petrol/diesel cars in Paris for some days due to a
persistent fog.9
In London Mayor Boris Johnson has
recently announced requirements for all London taxis to
be zero emission capable from 2018 primarily for air
quality reasons.10
5 Electric cars’ benefit to environment not as great as claimed. April 2014:
http://www.climatechangedispatch.com/electric-cars-benefit-to-environment-not-as-great-as-claimed.html
6 What’s the greenest car? An extremely short guide to vehicle emissions. Shrink That Footprint. April 2014:
http://shrinkthatfootprint.com/greenest-car-vehicle-emissions
7 Air Resources Board. California State Government: http://www.arb.ca.gov/knowzone/history.htm
8 Photo source: http://en.wikipedia.org/wiki/File:HarbinChinaSmog_121226.jpg#file
9 France curbs Paris car drivers to combat dangerous smog. Reuters UK. March 2014:
http://uk.reuters.com/article/2014/03/16/uk-france-pollution-idUKBREA2F0BF20140316
10 Transport for London. Press release. January 2014:
http://www.noodls.com/view/FE88B1370D96FC544154D510865EEC50D48F7F9D?3285xxx1389878269
Figure 1.2: EV carbon footprint – electricity sourced
from renewables compared to coal
Figure 1.3: Smog over Harbin, China
CONTENTS: Snapshot Introduction My Car Battery Solar PV Costs Sustainable ACT Appendix Author
7
Global Pressures to Go Electric
Around the globe there are strong pressures to move toward a carbon free road transport system. In
some regions of the world significant changes are occurring. These changes involve not only a move
to electric cars but also to electric buses, taxis, motorcycles and bicycles. There appear to be three key
drivers for the transition to electric vehicles:
In many countries transport contributes around 20% of the carbon footprint.
In Australia road transport makes up about 85% of the transport carbon
footprint. Electrifying road transport will make significant reductions in global
CO2 levels.
Urban air quality is poor in many cities of the world. For example, the
problems being encountered in China, and earlier this year in France, have
been highly publicised. Adoption of electric vehicles with zero emissions in
the urban area can lead to significant improvements in the health and quality
of life of city dwellers.
If a country is heavily dependent on imported fuels for its transport systems
its economy is open to disruption. In Australia oil refineries are progressively
being shut down and we are becoming increasingly dependent on imported
liquid fuels. Electric vehicles offer fuel diversity and are particularly suited to
integration with renewable energy.
There are many factors, both positive and negative, which are influencing the rate of uptake of
electric vehicles. These include:
Cost – at the present time the purchase price of an electric vehicle is generally significantly more
than an equivalent conventionally fuelled vehicle. By the same token the running costs are
significantly less. The breakeven point for cost appears to be in the area of 5 to 10 years.
Range – electric vehicles generally have markedly less range than their petrol/diesel equivalent.
Nevertheless the current generation of electric vehicles have a range which more than
adequately meets the day-to-day needs of a ‘city vehicle’.
Limited choice – only a limited number of models and makes of electric vehicles are currently
available on the market. The ones available tend to be at the luxury end of the market. Given
their very recent introduction there is effectively no market in used electric cars at the moment.
Comfort/performance – people who test drive an electric car generally report a very positive
response particularly about the smooth/rapid acceleration and the lack of noise and vibration.
CONTENTS: Snapshot Introduction My Car Battery Solar PV Costs Sustainable ACT Appendix Author
Climate Change
Air Quality
Energy Security
Uptake Factors
8
Fuel security is a major driver to go EV in many economies. Electric vehicles offer the potential for
liquid fuels to be substituted by other energy sources – coal; natural gas; and renewables are the
obvious substitute energy sources when using electricity. Fuel security is particularly relevant to
Australia where our capacity to produce petroleum and other liquid fuels is being progressively
eroded - we are moving toward a transport regime based very heavily on imported liquid fuels.
Many people have raised concerns about what it would mean for our transport systems if there
were major interruptions to shipping (strikes; weather; terrorism, etc). Following announcements in
2011 and 2012 of the closure of the Clyde and Kurnell refineries, the NRMA commissioned a report
looking into Australia’s fuel security.11,12
Subsequent to the release of that report, in April of this
year BP announced the closing of its Brisbane refinery.13
Rising petrol prices are an ongoing reason for individuals and governments to look for alternative
transport fuels. Electric vehicles are very efficient compared to internal combustion engine (ICE)
vehicles. At present EVs cost significantly more to buy than ICE vehicles but have substantially lower
fuel costs. Electric vehicles are also mechanically much simpler than ICE vehicles and therefore have
lower maintenance costs.14
For an average driver in the ACT it appears that the current payback
period if buying an EV instead of an ICE vehicle will be around 7-10 years (see Chapter 5).
Electric vehicles represent new technology and integrate well with the emerging renewable energy
sources. They also offer an ideal platform for autonomous vehicles which are now being trialled as a
way, amongst other things, to improve road safety. In September 2013 a Nissan Leaf was the first
vehicle in Japan to receive approval to operate in a driverless mode on Japan’s public roads.15
Noise from road traffic has been an ongoing problem for many decades. At slow speeds EVs are
exceptionally quiet. In fact concerns about the lack of noise has led to requirements for slow moving
EVs to emit an audible warning signal to alert pedestrians.16
At high speeds the noise difference
between an EV and an ICE vehicle for a person living next to a road is not likely to be great since
most of the noise generated by a modern car travelling at speed arises from tyre/road and
aerodynamic interactions rather than from the engine.
1.3 Author’s Motivation for Going EV
After some years working on climate change issues as a Federal bureaucrat I came to the conclusion
that agreement on effective strategies to address climate change is unlikely to be achieved at the
international level, or indeed at the national level in Australia, within a reasonable time frame. The
issues are just too complex and wide ranging. By the same token I was very aware that much was
being achieved at the individual and local/regional government level around the world through
focussed programs and action. Climate change is an issue that is well suited to ‘bottom-up’
solutions. On my retirement in 2012 I began to search for a climate change project where I, as an
individual, could make a difference.
11 Australia’s Liquid Fuel Security. NRMA. 2013: http://www.mynrma.com.au/media/Fuel_Security_Report.pdf
12 Australia’s Liquid Fuel Security. NRMA. 2013: http://www.mynrma.com.au/images/About-PDF/Fuel-Security-Report-
Pt2.pdf
13 Jobs to go as BP closes Brisbane refinery. Sydney Morning Herald. April 2014: http://www.smh.com.au/business/mining-
and-resources/jobs-to-go-as-bp-closes-brisbane-refinery-20140402-35xkr.html
14 Electric Vehicles: Myths v Reality. Sierra Club: http://content.sierraclub.org/evguide/myths-vs-reality
15 Caradvice website. September 2013: http://www.caradvice.com.au/253761/nissan-leaf-becomes-japans-first-road-
legal-autonomous-vehicle/
16 EU Parliament mandates audible warnings for hybrid and electric vehicles. EV Fleetworld. May 2014:
http://evfleetworld.co.uk/news/2014/Apr/European-Parliament-mandates-audible-warnings-for-electric-and-hybrid-
vehicles/0438013782
CONTENTS: Snapshot Introduction My Car Battery Solar PV Costs Sustainable ACT Appendix Author
9
Two key happenings led me to choose the transition to EVs as a very worthwhile climate change
project. To begin with, in 2012 the ACT Government released a visionary and far reaching plan to
address the Territory’s carbon footprint.17
In the plan it adopted a target that 90% of Canberra’s
electricity consumption would be sourced from renewables by 2020 – this approach immediately
opened up the way for the transition to fossil fuel free transport in the ACT. The chance to turn this
opportunity into personal action came in mid-2013 when production EVs became affordable for me
– the price for a mainstream electric car dropped below $40,000.
The ACT’s adoption of the 90% renewables target demonstrated that at the local level, where there
is a fairly homogenous community, it is possible to take strong action on climate change. Globally
much of the progress on climate change action is now taking place at the city and regional level –
C40 and Regions 20 (R20) are two organisations which are arguably achieving a greater level of
international cooperation on climate change than has been possible through the UNFCCC (United
Nations Framework Convention on Climate Change) process.18,19
The adoption of carbon neutral electricity leads inexorably to the electrification of transport
systems. More than 80% of the ACT’s carbon footprint is derived from either the electricity or
transport sectors – electrifying our transport would lead Canberra well down the road to becoming a
carbon neutral city.
1.4 Will an EV Work for You?
It is important to recognise that the current generation of EVs will not be suitable for all users. Due
to the range limitations of current EVs, an individual or family needs to fully understand their travel
patterns before making a decision to transition to an EV.
The current generation of commercially available EVs (except the very special and highly priced
Tesla20
) have a range which is ideal for a ‘city car’ (charged at home) but which is unlikely to be
satisfactory for an all-purpose car given the effective absence of public charging infrastructure in
Australia. For the most part this means that a current EV will likely make an excellent second car
and be very capable of replacing a family car that is essentially dedicated to ‘running around town’.
The nominal range of a current generation EV is typically 150km-200km when fully charged.
However, in practice for many people the workable comfortable range of an EV is not likely to be
much greater than 100km (just like a petrol car the range depends on the driver and the conditions).
Against this background, the first step in working out whether an EV will be suitable is to keep a daily
log of distances you currently travel each day in your ‘city car’. The average distance travelled per
day by cars in the ACT is about 40km21
– a distance well within the capability of the current EV.
However, decisions on choice of vehicle are very often based on the possible occasional use, rather
than the day-to-day use (eg buying a four wheel drive vehicle which in practice is very rarely taken
off-road), and this needs to be taken into account when determining the suitability of an EV. The
author’s personal ‘range experience’ around Canberra is discussed in detail in Chapter 2.
In the case of two car families, the range limitation of the city car can often be overcome by the
family owning one electric and one internal combustion engine (ICE) vehicle. When a family or
individual owns only one car, owning an EV may be feasible if the need to take ‘out of city’ trips is
17 AP2 – A new climate change strategy and action plan for the Australian Capital Territory. ACT Government 2012:
http://www.environment.act.gov.au/__data/assets/pdf_file/0006/581136/AP2_Sept12_PRINT_NO_CROPS_SML.pdf
18 Global Leadership on Climate Change. C40Cities: http://www.c40.org/
19 R20-Regions of Climate Action: http://regions20.org/
20 Tesla Motors website: http://www.teslamotors.com/en_AU/models
21 Australian motorists drive an average of 15,530km per year. Roy Morgan research. May 2013:
http://www.roymorgan.com/findings/australian-moterists-drive-average-15530km-201305090702
CONTENTS: Snapshot Introduction My Car Battery Solar PV Costs Sustainable ACT Appendix Author
10
only occasional. For example, using public transport or hiring an ICE vehicle to undertake longer
trips may be an option. Having said that, this is likely to be inconvenient in many cases and a good
compromise solution may be to purchase a plug-in hybrid electric vehicle (PHEV). These cars, which
are not yet common in Australia, have a battery which can generally power day-to-day trips around
the city (say a range up to 60km). When undertaking a longer journey the PHEV seamlessly switches
over to a petrol engine when the battery is depleted.
Unfortunately at the present time there is not a wide range of EVs on the market in Australia. In fact
at the time of writing there are only two choices in Australia for production EVs under $40,000 – the
Nissan Leaf and the Mitsubishi iMiev. This paucity of EV choice may well mean that while an
individual may decide that they would like to own an EV, the models on sale may not meet certain
personal requirements or preferences. Globally many of the major car manufacturers are now
making and selling either EVs or PHEVs.
Against this background it is interesting to read the 2013 report on a longitudinal survey that was
carried out in California to test the views of EV owners (the survey was started in early 2012) - over
90% of more than 2,000 EV users surveyed were satisfied with their vehicle.22
1.5 Renewable Energy
Using renewable energy is not a requirement for running an EV. However, to date EV use and
renewable energy have often been closely linked. The ‘early adopter’ EV owners are commonly
technology enthusiasts who have an interest in achieving carbon neutral transport – either by buying
green energy from their electricity retailer or through installing solar PV systems. This has been an
effective way of responding to EV detractors who have been very ready to point out weaknesses in
the environmental credentials of EVs which use coal based electricity (see Figure 1.2).
About 10% of Canberra houses have solar panels.23
However, all EV users in the ACT will effectively
have carbon neutral road transport in the near future, with or without solar panels on their roofs,
given the fact that 90% of our electricity will be sourced from renewables by 2020.
The nexus between renewable energy and EVs is now coming more into focus with the ongoing
improvements in battery technology. Battery advances are driving both the uptake of EVs and the
increasing interest in residential solar PV systems which include battery storage. In effect solar PV
and EV technologies are converging courtesy of advanced batteries.
1.6 Report Focus and Structure
I have deliberately given this book a local Canberra focus for a number of reasons. In recent years
there has been no shortage of EV discussion papers and project reports examining the potential for
introducing EVs across Australia. These have typically been prepared by well-funded bodies from
government, industry and academia (see for example ESAA report24
) - as an individual I am not in a
position to develop such comprehensive documents and I also do not want to simply go over old
ground. In Section 1.3 I indicated that following several frustrating years working on global solutions
to climate change I am now at the point where I believe greater headway may well be made by using
bottom-up approaches to CO2 management – focussing a book on one city/Territory allows me to
test the reaction to local approaches. Finally, a point I deliberately make many times in this book,
22 California Plug-in Electric Vehicle Driver Survey Results. Air Resources Board. California State Government. May 2013:
http://www.electricdrive.org/index.php?ht=a/GetDocumentAction/id/40805
23 Solar Power in the ACT – April 2014 Update. Canberra Green Energy: http://canberragreenenergy.com.au/solar-power-
in-the-a-c-t-april-2014-update/
24 Sparking an Electric Vehicle Debate in Australia. Electricity Supply Association of Australia. November 2013:
http://www.esaa.com.au/policy/sparking_an_electric_vehicle_debate_in_australia
CONTENTS: Snapshot Introduction My Car Battery Solar PV Costs Sustainable ACT Appendix Author
11
the ACT is now in a unique situation where it is likely to have an electricity sector based almost
exclusively on renewable energy within the next five years – in my view it is imperative that studies
are carried out to identify ways to build on this important achievement. I hope this simple overview
book will stimulate thinking on the way ahead.
Part 1 of the report describes the different elements of what I call my ‘EV Project’. The key elements
of the project: buying the car; charging the batteries; and the installation and operation of a PV solar
system on the roof of our house – are examined in turn in Chapters 2, 3 & 4. These separate
elements are brought together in Chapter 5 which discusses the costs associated with the project.
I have attempted to make clear that there are a number of optional routes for ‘going EV’ – I describe
what I have done but I have also attempted to point out alternative routes for each project stage.
In Part 2 (Chapters 6 & 7) I have endeavoured to examine how the EV can play a role in the ACT
achieving the outcomes set out in the ACT Government’s climate change action plan.
Chapter 6 looks at the carbon footprint of the ACT and examines to what extent the adoption of EVs
could potentially reduce the Territory’s carbon footprint. Transport is currently the second largest
component of the Territory’s carbon footprint (after electricity) and, according to AP2, the ACT
Government’s Climate Change Action Plan, it will become the largest component of the footprint by
2018 (due to the significant reductions now being made in the ACT’s electricity carbon footprint).25
In the final Chapter I explore strategies for encouraging EV uptake with a view to accelerating the
Territory towards its long term goal of carbon neutrality.
While the book has a Canberra focus I think that much of the information has broader applicability,
at least throughout Australia. My experience with the project has led me to become very
enthusiastic about EV adoption and the book is unashamedly focussed on discussing what can be
achieved with EVs. Nevertheless an honest attempt has been made throughout the book to
highlight the limitations and weaknesses of EVs – I am very conscious that overhyping EVs will only
generate expectations that cannot be met.
Throughout the book there is ongoing reference to the Nissan Leaf. This is not intended to be a
promotion of the Leaf – this just happens to be the car I bought and for which I have gathered data.
I expect that lessons learnt from my Leaf experience will be broadly applicable to other electric
vehicles of a similar capacity used as city cars in Canberra.
The reader will have already noticed that I have used a number of abbreviations to describe different
vehicle types. Throughout the book when I use the term ‘EV’ I am referring to pure electric (battery
only) vehicles – these are sometimes referred to as BEVs in other documents. The term ‘ICE’
(internal combustion engine) vehicles covers vehicles using fuels such as petrol, diesel, CNG and LPG.
I believe it is important to differentiate between plug-in hybrid vehicles – ‘PHEVs’ – and conventional
hybrid vehicles such as the Toyota Prius (commonly termed HEVs) which have been on the market in
Australia for some years. While HEVs have been very important transition vehicles they do not have
any facility for inputting electricity from an external source and hence they are not part of the
discussion in this book. [Toyota is now marketing a PHEV version of the Prius in Japan and the US.]
25 AP2, Figure 11. ACT Government 2012:
http://www.environment.act.gov.au/__data/assets/pdf_file/0006/581136/AP2_Sept12_PRINT_NO_CROPS_SML.pdf
CONTENTS: Snapshot Introduction My Car Battery Solar PV Costs Sustainable ACT Appendix Author
12
I envisage that, at least in the near term, PHEVs will be the main cars used in the transition from ICE
to EV. To date these have not proven too popular in Australia but the concept of using the car in EV
mode when around town (very low fuel costs, no pollution) and then using the ICE mode when on
extended trips is likely to be attractive to many people if the purchase price of the car is right.
This is not intended to be an academic treatise. I have tried to avoid using technical terms but do
use some common technical terminology associated with electricity. I have used ‘grey literature’ for
many of the references (newspaper articles, websites, etc) – if some of the references appear to give
odd information I would recommend that the reader cross check that information with other
sources. I have endeavoured to cross check ‘the facts’ wherever possible but inevitably there will be
inconsistencies between information drawn from different sources whether in the formal or the grey
literature.
CONTENTS: Snapshot Introduction My Car Battery Solar PV Costs Sustainable ACT Appendix Author
13
PART 1
MY ELECTRIC CAR
PROJECT
14
Buying & Using my Car
2.1 Introduction
This Part of the book is my own personal experience and contains many totally subjective
comments. The data I present depends on a wide range of personal factors – for example, the siting
of my home and where and how I drive – and therefore, while I do not believe any of these are
particularly unusual, I cannot guarantee that another person’s EV experience will be the same, or
even similar, to mine. In particular, the range of an EV can vary quite markedly from person to
person.
In parallel with buying the car, I purchased and had installed at our house a charger for the car and
an additional solar PV system on the roof. These two elements of the project are discussed in the
next two chapters.
The period covered by ‘the project’ is the first 7 months of 2014. I have chosen this time window as
it covers the last two months of summer and also the first two months of winter. The data shown in
most of the figures relates to the project period.
2.2 Getting Set Up
I began the project by monitoring my daily travel distance in my old ICE car for three months in late
2013. Figure 2.1 shows the distribution of the daily travel distances for the trips I carried out around
Canberra during that period. I have only shown the ‘around town’ days since I live in a two car
family and my wife’s ICE car is available for when we go away on longer trips.
The Figure shows that the travel distance for my most common day in that period was in the range
40-50km. I travelled less than 70km on about 85% of the days. There were no days during the
period where the distance exceeded 100km. This simple preparatory work gave me confidence that
Figure 2.1: Frequency distribution of my daily travel
distances in my old ICE car – Q4 2013
0
2
4
6
8
10
12
14
NoofDays
Daily Distance (km)
Average Daily Distance = 41.3 km
CONTENTS: Snapshot Introduction My Car Battery Solar PV Costs Sustainable ACT Appendix Author
15
an EV with a range of at least 100km would very easily meet my ‘around town’ car needs. (This
distribution equates to about 15,000km/year which is around the average for a car in Australia.26
)
Once I had gathered a reasonable amount of range data I looked at the available EV options. At the
time I was in the market for an EV (the end of 2013) I could only find two choices – the Mitsubishi
iMiev and the Nissan Leaf. Both of these cars easily met my range requirements. I decided to buy
the Leaf, even though it was approximately $10,000 more than the iMiev, mainly because it looks
and feels much more like a ‘normal’ car and also because I think it provides the driver with superior
information on energy use and other aspects of car performance. I understand I was the 9th
private
purchaser of a Leaf in Canberra – a photo of my car is on the front cover.
2.3 Living with the Car
I should say upfront that this project has worked out far better than I ever imagined – I love my EV
and now cannot envisage ever going back to owning a pure ICE vehicle.
Over the past seven months I’ve tried to closely observe the reaction of other people when I tell
them I have an EV. If they haven’t seen the car, the first question I invariably get is ‘What colour is
it?’ Once we get over that hurdle the questions are generally along the expected lines: ‘How far does
it go without charging?’; ‘How do you charge it up?’; ‘What does it cost to run?’ When people see
the car for the first time they tend to be surprised as they are expecting to see something that looks
like a 1970s bubble car. When I take them for a ride they are surprised at the comfort and
performance. Not infrequently I have to assure people that it is a pure electric car – NO PETROL!
One of the nicest things has been
the driving experience. It is
extremely quiet inside, the ride is
very smooth since there are no gear
changes and the responsiveness is
amazing compared to all the other
(admittedly rather ‘normal’) cars I’ve
previously owned. When you’re
driving it feels a bit like sitting in
front of a computer rather than
driving a car. Figure 2.2 is a photo of
the instrument panel immediately in
front of the driver in a Leaf. When
driving I find myself keeping quite a
close eye on the distance the car has
left to run before the battery runs out
(km figure at bottom right of the panel). I’m also usually aware of how efficiently I am driving (the
kWh/km figure in the middle of the panel).
The convenience of refuelling the car at home has been an unexpected bonus (see Chapter 3). The
very low running costs have induced a feeling that it is costing me nothing to run around town
(which is clearly not true). While not ideal, given the fact I am in solar surplus (see Chapter 4) I now
tend to not worry too much about how much energy I use in total in my car as long as I can get
home.
26 Roy Morgan research. May 2013: http://www.roymorgan.com/findings/australian-moterists-drive-average-15530km-
201305090702
Figure 2.2: The main instrument panel in my EV
CONTENTS: Snapshot Introduction My Car Battery Solar PV Costs Sustainable ACT Appendix Author
16
2.4 Energy Use Patterns
Examining energy use for an electric vehicle is not straightforward. In this section all the data I am
reporting relates to the amount of energy used by the vehicle. This is not the same as the energy put
into the vehicle (and the energy you pay for) since my monitoring indicates there is an approximate
20% loss of energy when charging my car. I discuss this issue in detail in Section 3.4. The data
behind all the figures in this section can be found in my project core datasheet which is shown in
Appendix A.2.
Daily Energy Use
The driver’s instrument panel in the Leaf has a display which shows the efficiency of travel in units of
kWh/km (See Figure 2.2). At the end of each day over the period of the project I noted down both
the distance travelled and the value of the kWh/km reading before re-setting the values to zero.
This gave me information on how much energy the car was using each day. You can see from
Figure 2.3 that the average daily energy use, when derived from the information provided by the car,
was 6 kWh/day. It can be seen that the most common level of energy use/day is in the 4-5 kWh
band.
The car used more than 10 kWh of electricity on about 15% of the days. The days with high energy
use generally involved giving the car a top up charge sometime during the day.
The days with zero energy represent days where we used the family’s ICE car to go on a trip beyond
the range of the EV; or days where we simply used the bikes and/or walked; and holiday breaks.
Energy Efficiency
When discussing energy efficiency in this book I have converted the units ‘kWh/km’ shown on my
EV’s instrument panel to ‘kWh/100km’ in order to allow easier comparisons with fuel use in ICE
vehicles (the common unit for fuel consumption used in Australia is ‘litres of fuel/100km’).
As indicated in the previous Section, when I am driving I find myself automatically tracking how
efficiently I am driving by looking at the car’s instrument panel (Figure 2.2). For me this figure
generally tends to stay in a range between 12 and 17 kWh/100km.
Figure 2.3: Frequency distribution of the EV daily
energy use (car instrument panel)
0
5
10
15
20
25
30
35
NoofDays
Energy Range (kWh)
Average Energy Use = 6.0 kWh/day
CONTENTS: Snapshot Introduction My Car Battery Solar PV Costs Sustainable ACT Appendix Author
17
While driving I can see the quite dramatic increase in instantaneous energy use of say going up a hill
or accelerating quickly. I have tried to not let this unduly affect the way I drive – I have tried to be a
normal driver and go with the flow of the traffic. When I peruse the web I can see that many EV
drivers are much more efficient than I am and tend to get greater range out of their vehicles than I
do. By the same token there are no doubt those who perform less efficiently. This seems to be very
much an individual issue and is heavily influenced by prevailing conditions – weather, terrain,
desired temperature inside the car, etc.
Figure 2.4 shows a breakdown of the total energy I used in the car over the project period by daily
energy efficiency band (this is based on the energy efficiency figure shown on the driver’s
instrument panel at the end of each driving day). It can be seen that more than 50% of the car’s
energy use during the project period was on days in the 13 and 14 kWh/100km efficiency bands.
I did some very informal monitoring of the effect of having the climate control on – in summer this
seemed to degrade performance by up to around 10% but this figure rose to over 15% on those cold
Canberra winter days when I needed to use the lights and the wipers in addition to keeping warm.
Figure 2.5 pulls these observations together. You can see from this Figure that the driving efficiency
was relatively constant at just under 15kWh/100km from January to early June and then it began to
deteriorate quite markedly when the cold weather hit (the line shows a 7 day moving average of the
daily efficiency).
It usually starts to become noticeably cold in Canberra at the end of April but this year it was
unseasonally warm during May – the onset of the cold seemed to be delayed until the start of June.
Warmer weather reappeared at the end of July and this is reflected in the improvement in the
efficiency at the end of the project period. I am confident that this loss of efficiency due to cold
weather is a real effect – I don’t believe I made any changes in my driving patterns in June/July.
4%
27%
26%
13%
10%
6%
8%
3%
1%
1% 1%
12
13
14
15
16
17
18
19
20
21
24
Energy
Efficiency Band
(kWh/100km)
Figure 2.4: Proportion of EV energy use by
daily efficiency band
Overall Efficiency = 14.6 kWh/100km
Charge/session ≈ ??kWh
kk15,000km/year
CONTENTS: Snapshot Introduction My Car Battery Solar PV Costs Sustainable ACT Appendix Author
18
Placing this energy efficiency information in context, in my previous petrol car (a Nissan Pulsar) I was
achieving an efficiency of around 8l/100km when driving around Canberra. On an energy basis this
is equivalent to about 75 kWh/100km.27
Comparing this with my EV which has a running efficiency
of about 15 kWh/100km it can be seen that, at the point of energy use, the EV is about 5 times more
efficient than the ICE – this difference in energy efficiency is reflected in the fuel costs of running the
two different types of vehicle (see Chapter 5).
2.5 Range Anxiety
All cars, both EV and ICE, have a limited range but the differences are very stark. The ICE typically
has a range of 500km+ and it is virtually always within range of a service station where it can fill up
with fuel within a few minutes. The current generation EV vehicles typically have an effective range
which is somewhere in the 100km-150km region and public charging stations are very few and far
between in Australia. Even if there is a charging station in range, ‘filling up’ may take 2 or more
hours (see Chapter 3). Running out of petrol in an ICE car can usually be rectified with a small can of
fuel; running out of charge in an EV probably means your car being put on the back of a recovery
truck. It is hardly surprising that ‘range anxiety’ is one of the most talked about topics amongst EV
owners!
My car has a nominal range of ‘up to 170km’. In practice, based on my experience, I start to get
anxious when I travel anything over 100km. I think my car would go about 130km on a full battery in
the Canberra area but psychologically I find I want to leave around 20-30km as a ‘reserve in the tank’
just in case there is some unusual event (road accident, diversion, etc) that might leave me
electrically embarrassed. I understand that this is quite a normal reaction.28
27 What are the units to submit energy data? What are the conversion factors? Sustainable Energy Authority of Ireland:
http://www.seai.ie/Your_Business/Public_Sector/FAQ/Energy_Reporting_Overview/What_units_do_we_use_to_submit_e
nergy_data_What_are_the_conversion_factors_used_.html
28 EV range drops by 25% due to psychological safety buffer. Inside EVs. March 2014: http://insideevs.com/study-ev-range-
drops-by-25-due-to-psychological-safety-buffer/
Figure 2.5: Daily EV energy efficiency (7 day moving
average) showing impacts of cold weather
0
5
10
15
20
25
01-Jan-14 10-Feb-14 22-Mar-14 01-May-14 10-Jun-14 20-Jul-14
Efficency(kWh/100km)
Date
CONTENTS: Snapshot Introduction My Car Battery Solar PV Costs Sustainable ACT Appendix Author
19
Having said that I think most EV drivers like to push their cars towards the end of the range every
now and then just to test out the capabilities. At this point I should say that my car has two charging
levels - 80% and 100%. The car handbook advises to charge to 80% full for normal day-to-day
operations to preserve the life of the battery and to go to 100% charge when you are trying to
maximise the range for a particular trip.
Daily Use
I imagine my day-to-day around town travel patterns are very similar to those of many families in
the ACT – going shopping; picking up kids from school; visits to museums; short trips around the
ACT; driving to the start of walks, etc. Over the time I’ve owned the car I’ve deliberately tried to use
and drive it as I would my previous cars when travelling around Canberra. I’ve always used the
climate control to maintain a comfortable temperature inside the car. I have found no need to creep
along or to fry/freeze in order to save the battery. The range of the car has worked out fine for
normal day-to-day driving around Canberra.
Figure 2.6 shows the distribution of daily travel distances I recorded in the EV over the project
period. Comparing this with Figure 2.1, the distance distribution in my old ICE car, the shape is very
similar in the frequency bands around the most common days but I have possibly done a few more
over 60km trips in the EV. This suggests that the range limitation of my EV is not having any material
impact on my ‘around town’ travel behaviour compared to my previous petrol engine car. Overall
the EV gets the family from A to B in much the same as my previous ICE car – but with so much more
comfort and excitement. On average I travelled 41.0 km/day in the EV during the project period
compared to the 41.3 km/day I did in my ICE vehicle in the last three months of 2013.
I normally take the handbook advice and charge my car to 80% full (I usually charge the car
overnight) – this typically gives a nominal range of about 120km (more on charging the battery in the
next Chapter). As you can see from Figure 2.6 this very easily lets me do my normal day-to-day
running around. On some days I’ve found myself going more places than usual during the day
followed by commitments in the evening – on these days I’ve given the car an approx. 2 hour ‘top
up’ in the late afternoon. When I know I’m going to have a big day around town I charge up to
100%.
Figure 2.6: Distribution of daily
travel distances in my EV
0
5
10
15
20
25
30
35
NoofDays
Daily Distance (km)
Average daily distance = 41.0 km
CONTENTS: Snapshot Introduction My Car Battery Solar PV Costs Sustainable ACT Appendix Author
20
The Sunday Afternoon Drive
Canberra, I guess like most Australian cities and towns, has a number of places within say 1 hour’s
drive where families go on weekends for picnics, afternoon tea, craft shops, bush walks, river
swimming, etc. It’s on these sorts of trips that range anxiety starts to appear. Figure 2.7 shows five
locations (roughly north, south, east and west of Canberra) where as a family we have ventured to
‘range test’ the EV. Taking on board what I have said earlier about the effective range of the car
being around 100km for my driving in the Canberra region we have restricted ourselves to visiting
places within about 50km from home (Belconnen). You can see from the map that these places are
all a similar distance from Belconnen – I think I would say that I had some mild ‘range concern’ but
not anxiety when we undertook these trips. If you live in Tuggeranong some of these trips
(eg Tidbinbilla) will be trivial, others will probably not be possible without a great deal of anxiety
(and/or a recovery vehicle).
Figure 2.7 is also useful in that it also gives a good visualisation of the size of the urban area of
Canberra relative to places that I consider to be at about the end of the car’s range. From north to
south Canberra now extends for approximately 50km so I always charge my car up to 100% if I am
venturing to the southern part of Tuggeranong.
Further Afield
I don’t see trips going much further than 50km being practical at the present time in current
generation EVs (Teslas aside) since there is no en route charging infrastructure in place in our region.
Nevertheless it’s nice to think that this will be a short term constraint and regional and long distance
EV trips will be feasible in the not too distant future for Canberran EV owners. I discuss this in
Chapter 7.
CONTENTS: Snapshot Introduction My Car Battery Solar PV Costs Sustainable ACT Appendix Author
21
2
Gundaroo
Murrumbateman
Royalla
Tidbinbilla
Figure 2.7: Map showing comfortable range of my EV (for trips to/from
Belconnen) compared to the size of urban Canberra
Source: Bing MapsScale: 1 cm ≈ 10 km
CONTENTS: Snapshot Introduction My Car Battery Solar PV Costs Sustainable ACT Appendix Author
22
Charging the Battery
3.1 Introduction
Refuelling your car at home rather than visiting a service station is probably
the only lifestyle change you’ll notice if you transition from an ICE vehicle to
an EV. For me this has been one of most pleasant surprises of owning an EV -
charging at home is absolutely brilliant! Having said that, since there is no
practical public charging infrastructure in place in Canberra at the present
time, charging at home is the only real option for refuelling your car if you
have an EV.
The lack of public charging infrastructure is often cited as a key reason for the slow uptake of EVs
around the world. I can see that certain out of town EV users would need to use public chargers in
Canberra (eg people visiting Canberra in EVs from surrounding towns and villages) but for Canberra
residents who use their EV as a city car I don’t think this is an issue. I’ve never had the need to use a
public charger and I don’t think I would change my city driving behaviour even if Canberra were to
suddenly become dotted with public chargers. On the other hand, if there were a network of public
chargers in regional towns around the ACT I would almost certainly venture further afield in my car
(see discussion in Chapter 7). Such a network would enable me to convert my EV from a ‘city car’ to
a ‘regional car’.
There are three broad categories of EV charger29
in use around the world:
Level 1 – the ‘slow charger’; these typically draw about 10 amps and will charge an average car in 8+
hours. A Level 1 charger is usually included with most new EVs as a standard accessory. I have never
used the one that came with my car.
Level 2 – the standard home use charger; these are typically hard wired into a 32 amp circuit and are
fixed on a wall. These will typically charge an average car from ‘flat to full’ in about 4-6 hours. I have
one of these and (drawing about 16 amps) on an average night it takes about 2 hours to charge my
car (providing around 50km range).
Level 3 – these are the ‘fast’ public chargers; they typically draw over 60 amps and will charge a car
battery to 80% full in about 30 minutes.
While I just love the home battery charging part of owning my EV, this is the one area where I think I
would consider doing things differently if I were to start my electric car project over again.
3.2 The Charging Experience
This is one of the most raised topics when I talk to people about the EV owning experience. I’ve
been surprised by the number of people who have told me they hate going to service stations and
would love to be able to re-fuel their car at home. Looking back I had no problems with going to
service stations to fill my car but I must say the experience of arriving home; just plugging in the
29 Strictly speaking the EV charger is on board the vehicle and what is commonly termed ‘the charger’ is simply a device to
safely provide electricity to the charger. Within the EV family this device is commonly called the EVSE (Electric Vehicle
Supply Equipment). In this book I use the term ‘charger’ as this is the most widely used terminology.
CONTENTS: Snapshot Introduction My Car Battery Solar PV Costs Sustainable ACT Appendix Author
23
charger, then walking away and coming back the next day to a car with a ‘full tank’ sure beats going
to ‘the servo’.
I can only speak about my Leaf, but I’m sure it is similar for other EVS - charging is a trivial routine.
You take the plug out of some form of holster and insert it in a socket in the front of the car (see
Figure 3.1) - the car then automatically fills up the battery to a user selected level at a time also
chosen by the user. The car has a very simple interface on the interior computer screen which lets
the user set up times for charging. I use an off-peak tariff and usually charge my car overnight (see
Figure 3.5). However, on occasions I press an over-ride button and charge the car immediately
(usually a top up charge during the day).
3.3 Which Charger?
Charging at Home
I understand from reading the EV
blogs that when charging at home
many people solely use the Level 1
charger that comes with the car they
bought. This is the cheapest option
but it does mean that it will not be
possible to do ‘quickish’ battery top
ups. The Level 1 charger that comes
with the Leaf has a 15 amp plug which
means that, unless you do a
workaround, you will need to have a
15 amp circuit/socket installed in your
garage if you don’t already have one.
This is generally not a major job for an
electrician.
I decided against the Level 1 charger
option since I figured that it would be
nice to be able to do top up charges
whenever I wanted to (this has
turned out to be a good
decision!). However, deciding to
go down the Level 2 charger path
does involve decisions and this is
the area where I would look
harder if for some reason I had to
install a new charger.
When it came to choosing a
Level 2 charger I took the
straightforward option. I bought
the unit recommended by
Nissan. This unit is sold by Origin
Energy (see Figure 3.2) – you can
see an example of one of these
at the Lennock Nissan Philip
showroom in Woden. It seems
that many Leaf owners are
Figure 3.2: The EV charger installed on the wall of
my garage at home
Figure 3.1: Charging my car at home
CONTENTS: Snapshot Introduction My Car Battery Solar PV Costs Sustainable ACT Appendix Author
24
resisting buying this unit because of price. It costs $2,750 fully installed – well over 5% of the price
of the car! If you scour around the internet it is possible to find a wide range of alternative chargers
and picking one of these could, on the face of it, save you more than $1,000 but of course there are
inherent risks in choosing to be independent.
If you research the charger issue on the web you get the sense that in the US people are looking to
pay around $500 for a charger. It is not too hard to find Level 2 chargers on the web in the $750 –
$1,500 range. These have to be installed by an electrician so it is important if buying from overseas
to make sure that the unit meets Australian electrical standards. For me the main concern with
buying a non-standard unit would be what happens if the charger fails. There is probably not a lot of
expertise in Australia at the moment to fix these units and dismantling and sending a unit
somewhere to be repaired could be a real hassle. Having said I believe that these devices are
comparatively simple so the chances of failure are probably low.
I should say that I find the Origin unit technically very solid. I am confident that it is not going to
break down; electrocute me or the family; burn the house down; damage my car if there is a massive
electrical storm, etc. It is extremely easy to use. If something does go wrong I am confident that it
will be fixed very rapidly – this is important since if the charger fails I will effectively have no
independent car transport (given the lack of public fast chargers in Canberra). If things came to a
push I think I could do a workaround and charge the car from a standard 10 amp socket in my house
using the Level 1 charger that came with the car.
Putting aside the cost, my main misgiving with the Origin unit is that it does not provide an
indication of the energy used during a charging session (the display simply shows instantaneous
power). I felt disempowered when I first got the EV. As an ICE owner I knew to the last cent what
the fuel for my car was costing; with the EV I could only gain a broad indication of what it was
costing (by reading my electricity meter and
making assumptions about the energy use of
other devices in the house). I overcame this
problem by purchasing data logging
equipment which I used to gather key parts of
the information used in this book (see
Appendix A.2). If I were looking for a new
charger I would look for one that is capable of
providing a datalog on energy use and,
ideally, one that gives visual feedback on the
total cost of electricity used (it would need to
be capable of letting the user input local
electricity tariffs by time of use).
Public Charging
Public charging has yet to take off in the ACT.
As I indicated earlier Canberra residents who
charge their EVs at home are not likely to
need to charge their cars at public places in
Canberra. Nevertheless, public charging will
presumably be essential if residents from
surrounding areas are going to use EVs to
come into Canberra to use the city as a
regional centre (shopping trips; medical
appointments; sporting/cultural events, etc). Figure 3.3: EV charger on the University of Canberra
campus
CONTENTS: Snapshot Introduction My Car Battery Solar PV Costs Sustainable ACT Appendix Author
25
As far as I can ascertain there
are only two operational
public charging stations in the
ACT at the present time – one
on the University of Canberra
campus in Belconnen
(Figure 3.3) and one at the
Abode Hotel in Woden
(Figure 3.4). I was unable to
find a charging station sign at
either site and both seem to
be tucked away in rather
‘interesting’ places. The
situation in Australia is in
marked contrast to that
overseas where major EV
charging infrastructure is being
installed.30
Another
interesting move overseas is
the setting up of ‘electric
highways’.31
The establishment of ‘electric highways’ in Southern NSW would probably be of more interest and
potential use to Canberra residents than installing chargers in Canberra itself – this is discussed in
Chapter 7. A proposal for this concept has been put forward for Western Australia.32
The issue of where and when to build EV charging infrastructure, and the design and rules of its use,
is a complex topic. I have included some preliminary discussion on this in Section 7.6.
3.4 Other Charging Issues
Homes without Garages
In Canberra most dwellings provide some form of off-street parking for the residents. This contrasts
with many of the inner suburbs of our major cities where only on-street parking is available.
However, apartment living is becoming more popular in Canberra and residents often only have
access to an allocated parking space rather than a private garage. This can make charging at home
difficult or indeed impossible. There are issues around, for example, the security of charging
equipment in open parking spaces; getting approval from Body Corporates to install chargers;
metering and paying for electricity in communal parking areas. These are not trivial issues and these
types of constraints may effectively prohibit many people in Canberra from owning an EV. In these
circumstances the installation of public charging stations at sites close to apartments may be the
only avenue to EV ownership for some Canberra residents.
30 Charging Station. Wikipedia: http://en.wikipedia.org/wiki/Charging_station
31 Supercharger. Tesla Motors website: http://www.teslamotors.com/supercharger
32 The REV project. University of Western Australia: http://www.therevproject.com/
Figure 3.4: EV charger at the Abode
Hotel Woden
CONTENTS: Snapshot Introduction My Car Battery Solar PV Costs Sustainable ACT Appendix Author
26
Time of Charging
Our house uses a time-of-use tariff and as I have said earlier I generally charge the car at night using
the off peak rate but do occasionally top the battery during the day which of course involves more
expensive electricity. Figure 3.5 shows the time distribution of energy put into the battery by one
hour time bands for the part of the period when my data logger was in place (see Appendix A.3). It
can be seen that over the logged period the greatest amount of energy input was in the hour 23.00
to midnight – this is because I set the automatic charging to commence at 11pm. About 90% of the
energy I put into my EV during the project period was off-peak electricity. The cost outcomes of this
pattern of charging are discussed in Chapter 5.
Figure 3.6 shows the frequency distribution of the amount of energy put into the car per day during
the datalogged period. It can be seen that the most common daily charge input was between
10 and 11kWh. The charger delivers about 20-25km of range per hour – given that my average daily
travel is around 40km, this suggests that my car needs to charged, on average, for about two hours
each day. The data on minutes of charging per day shown in Figure A.1 indicates that on average the
daily charge time is 122.5 minutes.
Figure 3.5: Total energy delivered to the EV by hourly time slots. The coloured labels
show the electricity provider’s ‘time of use’ periods
0
50
100
150
200
250
300
350
400
450
EnergyDelivered(kWh)
Time Period
Off-Peak
Peak Peak
ShoulderShoulder
Off-Peak
90% of energy used was off-peak
kk15,000km/year
CONTENTS: Snapshot Introduction My Car Battery Solar PV Costs Sustainable ACT Appendix Author
27
Charging Inefficiency
The charging of any battery has inefficiencies – when a battery is discharged it delivers less energy
than was put in during the charging process (energy is primarily lost as heat). For Li-ion batteries the
charging efficiency is typically around 80-90%.33
I have attempted to compute this efficiency for my
car/charger set up by comparing the energy used by my charger with the energy use reported by the
car’s data system. This involves some derived data and I have only been able to compute an
approximate efficiency figure: my calculations indicate the charging efficiency to be about 80%. This
derivation is shown in Appendix A.3. That is, by my calculations my car uses around 20% more
energy than is indicated by the energy efficiency reading shown in the car. This charging inefficiency
figure is consistent with the 80-90% efficiency range cited above. This means that in practice, while
the EV driving efficiency for the project period was about 15kWh/100km, the overall efficiency of
the car was about 17kWh/100km when the charging inefficiency is taken into account. As the user
who pays for the fuel I consider this latter figure to be the best indicator of the efficiency of my EV
(which of course is still very significantly better than my previous ICE vehicle).
Battery Degradation
EV detractors often like to suggest that the life of the battery in an EV is short and the cost of
replacing the battery is high so the cost advantages of running an EV are much less than first
appears. EVs are relatively new but they have been around for a few years now and, as far as I can
tell, much of the commentary on EV battery short life and expensive replacement does not hold
true. The batteries will slowly degrade over time, but I have not been able to find any reports on the
internet of dramatic battery failure in a Nissan Leaf even from people who have had the car for a few
years and who have chalked up big kilometres. I guess the life of a modern family car is around
10yrs (say 100,000km -150,000km) and I’m not envisaging any problems getting that sort of life out
of my EV. This assessment is essentially consistent with the Nissan Leaf warranty which states the
‘…Lithium-ion battery is warranted against any capacity loss below nine bars of capacity as indicated
on the vehicle’s battery level gauge for a period of 60 months or 100,000 kilometres…’. [At full
capacity the Nissan Leaf battery has twelve bars so on the face of it the warranty is guaranteeing the
battery capacity will remain at 75% or better.]
33 Car Battery Efficiencies. J Sun. October 2010:http://large.stanford.edu/courses/2010/ph240/sun1/
Figure 3.6: Frequency distribution of energy
delivered to the EV battery per day
(datalogged period)
0
5
10
15
20
25
NoofDays
Energy Band (kWh)
Average Charge/day = 7.3kWh
kk15,000km/year
CONTENTS: Snapshot Introduction My Car Battery Solar PV Costs Sustainable ACT Appendix Author
28
Remote Charging
In common with many new cars, EVs let the user
remotely access and control some facilities in the car
using an app on your smartphone. These apps let you
do things such as check the charge status of your car;
start or stop the charging of your car’s battery if it is
hooked up to a charger; send you a message if your
current charging session fails; and lets you turn on the
climate control before you get in your car. Figure 3.7
shows a sample screen shot from the official Nissan Leaf
Android app (there are quite a few independent apps
which essentially do the same thing). I occassionally use
my phone to check the car battery’s state of charge; I’ve
never used it to do any of the other fancy tricks.
Figure 3.7: Screenshot of Nissan Leaf
Android App
CONTENTS: Snapshot Introduction My Car Battery Solar PV Costs Sustainable ACT Appendix Author
29
My Solar System
4.1 Introduction
You don’t need a solar system to run an EV but for me this is a key part of my project. As noted
earlier, you’ll commonly find that EV owners deliberately aim to have carbon neutral transport and
will often buy green energy to achieve this goal if the solar route is not open to them. However, as
I also noted before, the ACT Government is planning to source 90% of the Territory’s electricity from
renewables by 2020 so Canberra EV owners will no longer need to take any independent action in
this area.
When I decided to go EV I did this on
the basis that my transport would be
carbon neutral and that I would aim
to do this by generating more solar
energy from panels on the roof of
our house than we use in total both
in the car and the house. In fact for
us this is not a really big ask as we
use gas for heating, hot water and
cooking. You can see from
Figure 4.1 that we have achieved
this over the life of the project - our
electricity generation and
consumption are more or less in
balance.
The data for the solar energy in the
first column in the Table contains
simulated figures for January and
most of February to take account of
the fact that we installed an additional 2kW solar PV system at our house in late February. The
simulated figures show the electricity generation for the whole period assuming the new solar PV
system had been in place on 1 January 2014 (this is explained in Appendix A.4). The monthly EV
energy consumption shown in the second data column is similarly a simulated dataset since my
charger data logging only commenced in mid March (this is explained in Appendix A.3). This column
shows the simulated actual amount of electricity put into the car – not the energy used by the car as
derived from the instrument panel (discussed in the previous chapter).
The seven months from January to July was selected as the project period so that I could gather a
dataset that contained data from two months of summer, all of autumn and then two months of
winter. July is generally the coldest month in Canberra and is the month when we usually use the
most electricity in the house (this year we took a holiday in July and this of course reduced both our
EV and household energy use for the month).
Figure 4.1: Comparison between energy generated
and energy consumed over life of the
project
MONTH
Solar Energy
Production
(kWh)
EV Energy
Consumption
(kWh)
Total Energy
Consumption
(House + EV)
( kWh)
January 646 152 206
February 500 229 288
March 446 244 338
April 346 172 295
May 317 267 455
June 208 258 475
July 276 196 385
TOTAL 2,739 1,518 2,442
kWh/day 13.0 7.2 11.6
CONTENTS: Snapshot Introduction My Car Battery Solar PV Costs Sustainable ACT Appendix Author
30
I am very happy with my solar system since it has enabled me to meet my project carbon goal.
However, as things have turned out, my solar system effectively runs independently of my EV use,
due to mismatches between my solar output and my EV charging requirements. In the long run (or
possibly even the short run) I would like to use a home battery storage system which lets us export
less of the electricity we generate.
4.2 System Description
When we moved into our house in 2012 it already had a 2kW solar PV system which operated under
the old gross Feed in Tariff (FIT) regime. I added an additional 2kW system in early 2014 as part of
the EV project. A schematic description of our household energy flows, including the two solar
systems, is shown in Figure 4.2.
In the Figure ‘Solar 1’ represents the original FIT system – this feeds straight into the grid and
ActewAGL pays us for all the electricity generated.
‘Solar 2’ in the Figure represents the new ‘net metered’ solar system. Since September 2013 all new
solar PV systems installed in the ACT are required to operate under a net use tariff. Under this tariff
regime, at any given point in time any electricity generated by the panels is first used to meet
demand from electricity appliances in the house; if the demand from the house is less than the
amount of electricity generated the excess is exported to the grid. The key point here is the
instantaneous nature of the netting action – the time of maximum generation of electricity (around
noon) rarely matches peak demand in our house and hence about 80% of the electricity we have so
far generated with the net metered system has been exported to the grid (detailed data is shown in
Figure A.1).
The two systems sit side by side on a roof face of our house which is oriented more or less to the NW
and has no shading during the day. The systems are standard installations and broadly generate the
Figure 4.2: Schematic diagram of average daily electrical
energy flows in our house for the project period
CONTENTS: Snapshot Introduction My Car Battery Solar PV Costs Sustainable ACT Appendix Author
31
expected amount of kWh/year for a PV system of this size in the Canberra region.34
The weekly
electricity generation and consumption patterns for our house and the EV during the project period
are shown in Figure 4.3.
During the first four months of the project total generation exceeded total consumption (see also
Figure 4.1) – this reversed over the last three months as solar generation weakened and our
household electricity showed the expected winter increase in use. Until mid April (Week 16) the EV
used significantly more electricity than the rest of the house. As the colder weather arrived our
household electricity consumption increased to more or less match the EV use until the end of the
project period (Week 17 includes Anzac Day – the day when Canberrans usually say the home
heating season begins).
4.3 Solar PV Contribution to Car Energy Use
While we generate more energy from our solar system than we use in our house and EV combined,
as indicated in Section 4.1 we run the solar system quite independently of the EV. One of the key
aims of net metering PV systems is that, as far as possible, a householder uses the electricity that
they generate rather than exporting it (electricity retailers pay very little for any electricity exported
from new solar PV systems). It would be nice if we could use all the electricity we generate to
directly charge the EV but this doesn’t work in the current circumstances. As you can see from
Figure 4.2, the electrons that get excited in my solar panels do not end up directly delivering energy
to my EV; rather the solar energy is mainly exported to the grid and I charge my car from the grid
using the off-peak rate which, in the ACT, operates between 10pm and 7am.
34 A Performance Calculator for Grid-Connected PV Systems: http://rredc.nrel.gov/solar/calculators/PVWATTS/version1/
CONTENTS: Snapshot Introduction My Car Battery Solar PV Costs Sustainable ACT Appendix Author
Figure 4.3: Weekly solar PV electricity generation compared with EV and household
electricity consumption
0
20
40
60
80
100
120
140
160
180
WeeklyEnergyUse/Generation(kWh)
Project Week
Total Solar PV Generation (kWh) EV Energy Use (kWh)
House Electricity Use (kWh) Total Electricity Use (kWh)
32
I do this because of mismatches between the:
1) power output of my solar system and the power demand of my car charger; and
2) time when I want to use my car and the time when my solar system produces electricity.
Discussing these in turn:
1) When charging the battery my charger draws about 3.7kW. The maximum power output that
I have measured from my net metered system is about 1.8kW. This means that if I tried to use the
output of my net metered system to charge my car, the charger would have to draw at least about
2 kW from the grid in order to deliver 3.7 kW. On cloudy days the charger would have to draw more
power from the grid. This is illustrated in Figure 4.4.
The Figure shows the solar PV generation time profile for a typical day in the project period overlain
with a charging profile for a two hour charge between noon and 2pm – the ‘power gap’ is labelled.
This diagram is purely illustrative and does not represent an actual day – the example profiles are
based on information derived from my data logger (see Appendix A.4). I estimate that if, for
example, on a sunny day around noon I were putting 7 kWh into the EV battery (this takes about 2
hours), around 3 to 5 kWh would have to come from the grid (this would vary from summer to
winter).
By default, charging directly from the solar PV system during the day would take place at a time
when the shoulder period tariff applies (see Figure 3.5). On sunny days the cost to me of charging
during the day (which involves direct input from solar 2 plus the abovementioned supplementary
energy from the grid) would be broadly similar to the cost of charging at night using the off-peak
rate. On cloudy days almost all my electricity would be drawn from the grid at the shoulder tariff
rate (which costs about 20% more than off-peak).
0
0.5
1
1.5
2
2.5
3
3.5
4
7 8 9 10 11 12 13 14 15 16 17
PowerGenerated/drawn(kW)
Hour of Day
Figure 4.4: Illustrative data - power drawn by the EV charger overlaid on the
power generated by the net metered solar PV system
Power drawn by charger
Power generated by net
metered solar PV system
The power gap
CONTENTS: Snapshot Introduction My Car Battery Solar PV Costs Sustainable ACT Appendix Author
33
I could address this power mismatch to some extent by ‘trickle charging’ my car using the Level 1
charger that came with my Leaf, or by adding panels to the net metered part of my solar system,
but neither of these approaches would overcome the timing mismatches discussed in 2) below.
2) The peak output from my solar system is in the 12pm to 1pm hour. Given the NW orientation of
my solar systems it would be expected that they will deliver more energy in the early afternoon than
in the late morning. Figure 4.5 shows the time based energy output of my net PV system for a two
month sampling period during the project. About 60% of the energy generated by my net PV system
was between noon and 4pm – this is reflected in the asymmetric shape of the curve in the Figure.
Unfortunately at the time when my net PV system is most productive, my personal commitments
mean that the car is rarely at home. I am usually using the car between noon and 4pm every
weekday and most weekends. Therefore this means that even if the power mismatch issue
discussed in 1) could be overcome, in the absence of a storage battery, I would not be able to charge
my car from my net metered system to any great extent since I am almost always using my car
during the period when my solar PV is generating a major part of its electricity.
Given these constraints, the best charging option for me during the project period was to set up the
automatic charging interface in the car so that it charged at night from the grid using the off-peak
tariff.
4.4 Discussion
It can be seen from Figure 4 .1 that over the project period our combined 4kW solar PV system
generated about twice as much energy as I put into the EV. Therefore, given that during this period
I travelled about 40km/day (the equivalent of 15,000km/year), in broad terms I expect that my EV
will travel about 15,000km/year on the output of our 2kW net metered solar PV system.
While I have effectively achieved my carbon neutrality goal, I have not achieved any direct
integration between my EV and my solar system. The extent to which the solar system can be
integrated with an EV (ie the extent to which a solar system can practically be used to directly charge
an EV) is determined by how well the EV charging and solar generating power match and how closely
the timing of the PV output and the availability of the car can be aligned. My car and PV systems
only indirectly complement each other – I achieve my carbon neutrality by time shifting my energy
Figure 4.5: Time of day profile of the total energy output of
the net solar PV system for the sample period
0
5
10
15
20
25
30
35
40
45
50
5 6 7 8 9 10 11 12 13 14 15 16 17 18
SolarEnergyGenerated(kWh)
Hour of day
Energy Generated in Sample
Period = 265kWh
CONTENTS: Snapshot Introduction My Car Battery Solar PV Costs Sustainable ACT Appendix Author
34
generation and consumption via the grid. To rectify this situation I will need to incorporate battery
storage into my solar PV system.
Battery Storage
I have no problems with using the electricity grid and recognise that it needs to be paid for
equitably. However, the current tariff structures are now driving the owners of net metered solar
PV systems to seriously consider the installation of home battery storage and energy management
systems.
Domestic battery storage systems are now appearing on the Australian market but as yet are
relatively expensive. In some regional areas of Australia electricity providers are mandating battery
storage for small (and larger) solar systems under some circumstances for ‘energy smoothing’
purposes.35
In the United States pundits seem to be surprised at the rate of reduction in battery
prices.36
It is not difficult to envisage that in a year or so it will be financially beneficial to add a
battery storage system to domestic net metered solar PV systems in Canberra.
Without going into any great detail, during the project period my ‘solar 2’ system generated
840 kWh of electricity and we exported about 80% of this (ie we were not able to use this electricity
at the time it was generated). We received 7.5c/kWh from our electricity retailer (ActewAGL) for
exported electricity and then bought back electricity for 24.86c/kWh at peak times and for
14.08c/kWh at off-peak times. Clearly the bigger the gap between the sell and buy prices the more
attractive battery storage becomes. In simple terms the aim of the battery storage will be to store
electricity generated by the solar PV system during the day so that it can be used at peak times
(when the sun is not shining). In addition, at times when the solar system is not generating sufficient
energy (a cloudy day) some systems enable the battery to be replenished at off-peak times (and
tariffs) to make electricity available for use during peak periods.
For some people acquiring battery storage is likely to be a prelude to going ‘off-grid’. However, for
most people (including my household) it will simply be a way to minimise the amount of external
electricity they buy. Either way battery storage does threaten the status quo for long established
electricity generators who are now seeing a progressive fall in demand for their product – electricity
consumption in Australia’s National Electricity Market has fallen every year over the past five years
(about 6% in total).37
There are important synergies between EVs and solar PV with battery storage. Reductions in the
price of batteries will generate a positive feedback loop between the two technologies since the
batteries used in both applications are identical. Cheaper batteries will reduce the price, and
increase the uptake, for both EVs and domestic solar PV with battery storage. Tesla Motors has
announced it will build a ‘gigafactory’ to produce Li-ion batteries and expects that this will drive
down the costs of batteries by more 30% at the end of the first year of production.38
The batteries
are intended for use in both EVs and home solar systems.39
35 Horizon Power. WA: http://www.horizonpower.com.au/renewable_energy_technical_requirements.html
36 Are EV battery prices much lower than we think? Clean Technica. January 2014:
http://cleantechnica.com/2014/01/07/ev-battery-prices-much-lower-think/
37
National Electricity Market electricity consumption. Australian Energy Regulator: http://www.aer.gov.au/node/9765
38 Gigafactory. Tesla Motors. February 2014: http://www.teslamotors.com/blog/gigafactory
39
Home energy battery backup. SolarCity: https://www.solarcity.com/residential/energy-storage
CONTENTS: Snapshot Introduction My Car Battery Solar PV Costs Sustainable ACT Appendix Author
35
The Costs
5.1 Introduction
Computing and reporting costs is not a straightforward issue – there are many ways to evaluate the
benefit of projects. In this chapter I describe the costs/benefits of my project from my perspective –
I will leave it to the reader to form a view of how legitimate the costing methodologies I’ve adopted
are.
To reinforce what I have said earlier, my ‘EV project’ involved the purchase of the EV, the battery
charging system and the new net metered solar PV system. I have therefore included all three of
these elements in my costings. However, you do not have to buy a charger or a solar system to
successfully buy and operate an EV – the inclusion of the latter two elements reflects my personal
choice.
In broad terms, EVs cost more to buy than conventional cars but cost significantly less to run.
I estimate that the costs of owning and running an EV will generally be level with the costs of owning
and running an ICE somewhere between 5-10 years after purchase (see Section 5.4).
Over the project period costs have changed – electricity prices in the ACT increased by about 4% on
1 July 2014. The Federal Government has announced its intention to index excise on petrol.
5.2 Upfront Costs
The Car
My costs – Nissan Leaf $40,000.
At the present time I estimate that an EV costs somewhere between $10,000 and $15,000 more
than an equivalent ICE. This is a rather subjective assessment of what is a dynamic situation. The
Nissan Leaf was costing more than $50,000 until mid-2013. I entered the market when the price was
dramatically reduced to about $40,000. When looking for an EV I was offered a brand new
Mitsubishi iMiev for $29,000 when the advertised price was around $52,000.
Unfortunately there is little competition in the EV market in Australia at the moment. The
established Nissan Leaf40
and Mitsubishi iMiev41
are still for sale in Canberra. Two new ‘high end’
EVs – the BMW i342
and the Tesla Model S ($100,000)43
- have arrived on the scene in recent months.
Some PHEVs can be bought in Canberra – the Holden Volt44
has been on sale in Canberra for some
time; this has recently been joined by the Mitsubishi Outlander ($50,000)45
; and there is also a PHEV
40 Nissan Leaf. 100% Electric. Zero Petrol. Nissan: http://www.nissan.com.au/Cars-Vehicles/LEAF/Overview
41 i-Miev. Plug into the Future. Mitsubishi Motors: http://www.mitsubishi-motors.com.au/vehicles/i-miev
42 BMWi3. Electric and Electrifying. BMW:
http://www.bmw.com.au/com/en/newvehicles/i/i3/2013/showroom/introduction.html
43 Model S. Zero Emissions. Zero Compromises. Tesla Motors: http://www.teslamotors.com/en_AU/
44 Long Range Electric Holden Volt. Holden: http://www.holden.com.au/cars/volt#/overview
45 Outlander PHEV. The world’s first plug-in hybrid SUV. Mitsubishi Motors: http://www.mitsubishi-
motors.com.au/vehicles/outlander-phev
CONTENTS: Snapshot Introduction My Car Battery Solar PV Costs Sustainable ACT Appendix Author
36
version of the BMW i3. [The prices in this paragraph are purely indicative and have been taken from
the manufacturers’ websites for what appear to be base models.]
There are Australian companies specialising in conversions of ICE vehicles to EV. In addition to the
cars cited in the previous paragraph, many major global car manufacturers are now either making,
or are on the point of making, EVs and/or PHEVs but are not yet marketing these in Australia. The
latest figures that I can find indicate that there are 18 EV and PHEV models for sale in the United
States at the present time.46
As more competition enters the market and production volumes
increase one would expect to see EV prices fall. Developments in battery production are indicating a
30% reduction in the price of batteries by 2017.47
The Charger
My costs – Origin Energy Charger $ 2,750
In Section 3.3 I briefly discussed costs for Level 2 EV charging systems – in broad terms an installed
hard wired charger is likely to cost somewhere between $1,000 and $3,000. You can certainly pay
more than $3,000 if you want a charger that is networked or that has security card access, etc but
not surprisingly most interest is in looking for chargers at the bottom end of the price range.
I haven’t researched this topic to any great extent but the search for inexpensive chargers generates
a fair bit of discussion on the EV websites.
If you don’t intend to purchase the recommended charger for your car it means spending some time
on the web looking at discussion forums and the sites of independent EV equipment providers. It
goes without saying that if you go down this route it is important that the equipment you buy meets
the relevant Australian electrical standards. As mentioned earlier, while probably somewhat
restrictive, the cheapest option is to simply use the charger that is included when you buy a new EV.
The Solar System
My costs – 2kW system $3,500
As far as I can tell the cost of my solar PV system was about the average, or a little below the
average, for a 2 kW domestic rooftop solar PV system installed in Canberra at the present time (this
works out at approx. $1.75 per Watt).
The price of PV systems has been dropping dramatically throughout the world for many years. This
trend is shown in Figure 5.1.48
There is now price uncertainty in the Australian market because of
the yet to be resolved debate surrounding the future of the Federal Government’s RET (Renewable
Energy Target). While this debate is holding up large renewable energy projects, the domestic solar
PV sector is still active.49
46 Electric vehicle sales growing fast, cross half million mark. RenewEconomy. July 2014:
http://reneweconomy.com.au/2014/electric-vehicle-sales-growing-fast-cross-half-million-mark-13784
47 Gigafactory. Tesla Motors. February 2014: http://www.teslamotors.com/blog/gigafactory
48 Solar PV module prices have fallen by 80% since 2008, Wind turbines 29%. Clean Technica. May 2014:
http://cleantechnica.com/2013/05/06/solar-pv-module-prices-have-fallen-80-since-2008-wind-turbines-29/
49
People power: Rooftop solar PV reaches 3 GW in Australia. Reneweconomy. Dec 2013:
http://reneweconomy.com.au/2013/people-power-rooftop-solar-pv-reaches-3gw-in-australia-99543
CONTENTS: Snapshot Introduction My Car Battery Solar PV Costs Sustainable ACT Appendix Author
37
5.3 Ongoing Costs
The Fuel - Electricity
My Costs - $1.16/day
Figure 3.5 shows that during the project
period I primarily charged the vehicle
using the ActewAGL off-peak rate of
14.08c/kWh which is a component of the
Home time-of-use plan. The tariff
schedule for the first six months of the
project period is shown in Figure 5.2.50
Figure 3.5 also shows I did on occasions
also give the car a top up charge which
was mainly at the shoulder tariff of
19.25c/kWh.
On 1 July ActewAGL increased its
electricity rates by around 4%. The daily
EV charging costs shown in Figure 5.3
incorporate the new tariffs.
ActewAGL also has a tariff called ‘off-peak night plan’ which it states is ‘…applicable to [amongst
other things] charging electric vehicles…’. This tariff was 10.23c/kWh. Naturally I explored this
option but I decided not to use it as it has strict limitations on the times of use - while I put about
90% of the energy into my EV at night (see Figure 3.5), I would not want to limit use of my home
charger to specific times. I find it difficult to imagine this ‘electric car’ tariff being attractive to any
private individual but it could be useful for a business that routinely charges a fleet of vehicles at
night and has alternative charging points for use during the day.
50 Residential Electricity Prices. ActewAGL: http://www.actewagl.com.au/Product-and-services/Offers-and-
prices/Prices/Residential/ACT/Electricity-prices.aspx [This link takes you to the current tariff (post I July)]
Figure 5.2: ActewAGL ‘Home time-of-use plan’
tariff on 1 January 2014
Figure 5.1: Price trajectory of solar PV
modules 1976-2012
CONTENTS: Snapshot Introduction My Car Battery Solar PV Costs Sustainable ACT Appendix Author
38
Figure 5.3 shows my daily expenditure on electricity for the EV during the project period (see
Appendix A.3 for the details of the computations). For the most part, the cost was between 50c and
$2.50/day while the average cost was about $1.15/day. By way of contrast, I estimate that I was
spending about $5/day to fuel my previous ICE vehicle.
The rate of increase in the price of electricity would very reasonably be a concern for someone
contemplating moving to an EV. After all, between June 2007 and June 2012, the retail price of
electricity in Canberra rose 45%.51
However, it appears that the outlook for electricity prices is now
more stable - the Australian Energy Market Commission has stated that electricity prices are
expected to decrease by 0.7 per cent a year over the three years from 2012/13 to 2015/16.52
[It is
interesting to place this advice in context – the prices of electricity have just risen by 4% in the ACT].
Putting this aside, many people are now installing solar PV systems as a way to cushion against
increases in the price of electricity.
Battery Degradation
As an EV progresses through its life the battery degrades along with the rest of the car – detractors
commonly cite this as a hidden cost of running an EV. I briefly discussed battery degradation in
Section 3.4 and as far as I can tell battery degradation should be of no greater importance than
degradation of other parts of the car (all cars degrade with age and distance travelled). This is
certainly an issue of interest on the Leaf owners’ sites but there don’t seem to be any great
problems emerging.53
The Nissan Warranty suggests that the battery may lose up to 25% of its
capacity after 100,000 km. If this is the case it would not have any great impact on my use of the car
51 Household energy use and costs. Australian Bureau of Statistics. September 2012:
http://www.abs.gov.au/AUSSTATS/abs@.nsf/Lookup/4102.0Main+Features10Sep+2012
52 2013 Residential Electricity Price Trends. Australian Energy Market Commission. December 2013:
www.aemc.gov.au/media/docs/2013-Residential-Electricity-Price-Trends-Final-Report-723596d1-fe66-43da-aeb6-
1ee16770391e-0.PDF
53 How to check battery capacity, degradation and range. US Nissan Leaf users discussion forum:
http://www.mynissanleaf.com/viewtopic.php?f=31&t=8342
Figure 5.3: Daily cost of electricity to fuel my EV
0
0.5
1
1.5
2
2.5
3
3.5
ElectricityCost(AUD)
Date
Average daily electricity cost = $1.16
CONTENTS: Snapshot Introduction My Car Battery Solar PV Costs Sustainable ACT Appendix Author
39
as a city vehicle since I would still have plenty of range for my normal day to day journeys (see
Figure 2.6). Nissan recently announced that the cost for a new battery for the Leaf in the US will be
about $5,500 USD.54
Maintenance
Electric vehicles are mechanically very simple compared to ICE vehicles. The EV contains no liquid
fuel or exhaust systems; has no clutch and one gear; the engine essentially has one moving part
compared to the hundreds of moving parts in an ICE. It would appear reasonable to assume that
this simplicity will result in lower maintenance costs. At the present time the total cost of the
‘capped price service’ for a Nissan Leaf (first six years of the car’s life) is about 40% less than for the
same ‘capped price service’ for the Nissan Pulsar, a similar sized car from the same manufacturer.55
Depreciation
This is an unknown since at the moment there are virtually no well-used EVs on the second hand
market in Canberra (or indeed in Australia). Since EVs have only been on sale in Australia for about
2 or 3 years there is no experience of what they will be worth when they reach what may be a
typical re-sale threshold of around 100,000 km.
If there are fears about the longevity of the battery, the value of EVs may depreciate more quickly
than ICE vehicles. On the other hand, the possibility to purchase a second hand car with very low
running costs could make EVs a very attractive proposition compared to the purchase of a similar
aged ICE vehicle.
I was fully aware of possible accelerated depreciation when I purchased my Leaf and any residual
value after say 10 years will be a bonus (the resale value of my last ICE car had more or less
evaporated by the time I sold it with around 100,000 km on the clock). In the US, which has a much
longer EV experience than Australia, media articles indicate that EVs do not do well in the resale
market. However, it is important to note that in the US the actual purchase price of new EVs is
commonly heavily discounted via government grants and incentives so any quoted % depreciation
may be somewhat misleading.56
5.4 Overall Costs
The fundamental question is how do the total costs of owning and using an EV compare to those of
owning and using an ICE? There is no straightforward answer to this question as there are many
cost variables which need to be taken into account on an individual by individual basis.
In an effort to demonstrate some indicative costs I have generated two example charts which show a
family of scenario payback times for a given variable. These charts are purely illustrative – there are
many possible variables that could be explored. I have chosen one variable which gives a broad
spread of payback times and another where the payback times are much more closely spaced. Both
examples are based on charging the car with off-peak electricity.
54 Update on Nissan Leaf Battery Replacement. My Nissan Leaf. June 2014:
http://www.mynissanleaf.com/viewtopic.php?f=4&t=17168#p374490
55 Capped price service. Nissan Motors Australia website: http://www.nissan.com.au/Owners/Owner-Information/Capped-
Price-Service
56 Depreciation hits electric cars hard. USA Today. December 2013:
http://www.usatoday.com/story/money/cars/2013/12/26/plug-in-cars-electric-cars-depreciation-resale-residual-
value/4194373/
CONTENTS: Snapshot Introduction My Car Battery Solar PV Costs Sustainable ACT Appendix Author
40
1) Variable distance travelled
Assumptions: EV efficiency: 17 kWh/100km. ICE efficiency 8 litres/100km (approx. average city
cycle efficiency for Australia). Electricity cost 16c/kWh. Petrol cost $1.55/litre.
The lines in Figure 5.4, for three distance scenarios, have been constructed by computing the annual
fuel cost for an EV and an ICE vehicle using the above assumptions and then plotting the
accumulated savings in fuel costs of an EV compared to an ICE vehicle over time.
As noted earlier, an EV has cheap running costs and high capital costs while the reverse is true for an
ICE vehicle. Figure 5.4 shows three lines which give the payback time relationship between distance
travelled and savings in fuel costs that are made when transitioning from ICE to EV. For any given
additional capital cost the payback time will be shorter the further the EV travels (this assumes that
an ICE would be used to travel this distance if an EV were not being used). For example, say a
person spent $10,000 more for an EV + charger than he/she would have paid for an ICE vehicle, the
payback time would be about 5 years if the vehicle were used for 20,000km/yr and about 10 years if
the vehicle were used for 10,000km/yr.
I have shown in Figure 2.6 that I use my car on average about 40 km each day which equates to
around 15,000km per year. I guess very roughly that I spent around $15,000 more for my EV plus
the charger than I would have done had I bought an equivalent new ICE vehicle (something I have
never done in my life) so I think that my payback time will be of the order of 10 years.
This is a very crude assessment which doesn’t, for example, take into account discount rates. It is
also one dimensional in that it doesn’t take into account the accelerated depreciation that will take
place if an EV travels 20,000km rather than 10,000km per year or the depreciation of an EV
compared to an ICE.
Figure 5.4: Indicative cumulative fuel cost savings for three
different distance travelled scenarios (EV v ICE)
-
5,000
10,000
15,000
20,000
1 2 3 4 5 6 7 8 9 10
TotalFuelCostSavings(AUD)
Years from Start
10,000 km/yr 15,000 km/yr 20,000 km/yr
CONTENTS: Snapshot Introduction My Car Battery Solar PV Costs Sustainable ACT Appendix Author
41
2) Variable driving efficiency
Assumptions: Distance travelled: 15,000km/yr. ICE efficiency 8 litres/100km (approx. average city
cycle efficiency for Australia). Electricity cost 16c/kWh. Petrol cost $1.55/litre.
In a similar manner to Figure 5.4, the lines in Figure 5.5 have been constructed by computing the
annual fuel cost for an EV and an ICE vehicle using the above assumptions and then plotting the
accumulated savings in fuel costs of an EV compared to an ICE vehicle over time for three driving
efficiency scenarios. I have chosen efficiencies which essentially cover my range of driving
efficiencies (see Figure 2.4) even though I barely registered any days at 12kWh/100km or
22kWh/100km.
I discussed driving efficiency in Section 2.4. When I’ve had a day where I’ve achieved 12kWh/100km
for the day’s driving I feel very proud of myself; when I only achieve about 18kWh/100km for a day
I feel like I have transgressed some unwritten law (the difference is often due to factors like having
to use the lights, heater, wiper, etc). In the Nissan Leaf the feelings of triumph or guilt are
compounded by a rather annoying female voice from the car’s computer system which ranks your
efficiency performance each day. Against that background the obvious question is does driving
efficiency significantly affect your payback time?
You can see from Figure 5.5 that differences in driver efficiency in fact make relatively little
difference to payback time. This outcome primarily arises due to the fact that while the differences
in energy use per year between the efficiency scenarios are relatively large, these do not translate
into significant monetary differences due to the low price of electricity compared to petrol. For
example, after 10 years the savings of an EV over an ICE are about $15,700 when driving at
12kWh/100km and about $14,500 when driving at 17kWh/100km.
This example also shows that the issue of charging inefficiency which was discussed in Section 3.4 is
not significant when considering impacts on payback time.
CONTENTS: Snapshot Introduction My Car Battery Solar PV Costs Sustainable ACT Appendix Author
Figure 5.5: Indicative cumulative fuel cost savings for three
different driving efficiency scenarios (EV v ICE)
-
5,000
10,000
15,000
20,000
1 2 3 4 5 6 7 8 9 10
TotalFuelCostSavings(AUD)
Years from Start
22 kWh/100km 17 kWh/100km 12 kWh/100km
Living with a plug-in electric car in Canberra

Contenu connexe

Tendances

Webinar 2 | Apr-16 | Learning from Failure in Social Entrepreurship
Webinar 2 | Apr-16 | Learning from Failure in Social EntrepreurshipWebinar 2 | Apr-16 | Learning from Failure in Social Entrepreurship
Webinar 2 | Apr-16 | Learning from Failure in Social EntrepreurshipSmart Villages
 
Webinar 2 | Apr-16 | Shell Foundation: Learning from Failure
Webinar 2 | Apr-16 | Shell Foundation: Learning from FailureWebinar 2 | Apr-16 | Shell Foundation: Learning from Failure
Webinar 2 | Apr-16 | Shell Foundation: Learning from FailureSmart Villages
 
Going electric
Going electricGoing electric
Going electricigvision
 
Electric Vehicles: Fun Saving Our Planet
Electric Vehicles: Fun Saving Our PlanetElectric Vehicles: Fun Saving Our Planet
Electric Vehicles: Fun Saving Our PlanetPaul H. Carr
 
SemaConnect and Earth Day: Kick Gas!
SemaConnect and Earth Day: Kick Gas!SemaConnect and Earth Day: Kick Gas!
SemaConnect and Earth Day: Kick Gas!Kayla Branch
 
Global issues ppt on Gas cars and advantages of using Electrical cars
Global issues ppt on Gas cars and advantages of using Electrical carsGlobal issues ppt on Gas cars and advantages of using Electrical cars
Global issues ppt on Gas cars and advantages of using Electrical carsmbandaru
 
Electric Cars in Pakistan
Electric Cars in PakistanElectric Cars in Pakistan
Electric Cars in PakistanWisalHasnain
 
Cars of the future
Cars of the futureCars of the future
Cars of the futureRyanVince
 
Next Generation Vehicles: Electric Cars, Emissions, Commuting, and Parking
Next Generation Vehicles: Electric Cars, Emissions, Commuting, and ParkingNext Generation Vehicles: Electric Cars, Emissions, Commuting, and Parking
Next Generation Vehicles: Electric Cars, Emissions, Commuting, and ParkingMarcus Bowman
 
Perspectives on the Future of Transportation and Sustainability: The Importa...
Perspectives on the Future of Transportation and Sustainability:  The Importa...Perspectives on the Future of Transportation and Sustainability:  The Importa...
Perspectives on the Future of Transportation and Sustainability: The Importa...John Thornton
 
Joule, a spearhead for the south African Electric Vehicle and Battery industr...
Joule, a spearhead for the south African Electric Vehicle and Battery industr...Joule, a spearhead for the south African Electric Vehicle and Battery industr...
Joule, a spearhead for the south African Electric Vehicle and Battery industr...RAMP Group
 
Electric Car Quotes: The Best Quotes about Electric Vehicle
Electric Car Quotes: The Best Quotes about Electric VehicleElectric Car Quotes: The Best Quotes about Electric Vehicle
Electric Car Quotes: The Best Quotes about Electric VehicleSibiKrishnan
 
Interesting facts about Electric Vehicles
Interesting facts about Electric VehiclesInteresting facts about Electric Vehicles
Interesting facts about Electric VehiclesSibiKrishnan
 
Common Questions about Electric Vehicles
Common Questions about Electric VehiclesCommon Questions about Electric Vehicles
Common Questions about Electric VehiclesSibiKrishnan
 

Tendances (20)

Webinar 2 | Apr-16 | Learning from Failure in Social Entrepreurship
Webinar 2 | Apr-16 | Learning from Failure in Social EntrepreurshipWebinar 2 | Apr-16 | Learning from Failure in Social Entrepreurship
Webinar 2 | Apr-16 | Learning from Failure in Social Entrepreurship
 
Webinar 2 | Apr-16 | Shell Foundation: Learning from Failure
Webinar 2 | Apr-16 | Shell Foundation: Learning from FailureWebinar 2 | Apr-16 | Shell Foundation: Learning from Failure
Webinar 2 | Apr-16 | Shell Foundation: Learning from Failure
 
Going electric
Going electricGoing electric
Going electric
 
Electric Vehicles: Fun Saving Our Planet
Electric Vehicles: Fun Saving Our PlanetElectric Vehicles: Fun Saving Our Planet
Electric Vehicles: Fun Saving Our Planet
 
Living Smart 9 Dec08
Living Smart 9 Dec08Living Smart 9 Dec08
Living Smart 9 Dec08
 
SemaConnect and Earth Day: Kick Gas!
SemaConnect and Earth Day: Kick Gas!SemaConnect and Earth Day: Kick Gas!
SemaConnect and Earth Day: Kick Gas!
 
Electric cars
Electric carsElectric cars
Electric cars
 
Global issues ppt on Gas cars and advantages of using Electrical cars
Global issues ppt on Gas cars and advantages of using Electrical carsGlobal issues ppt on Gas cars and advantages of using Electrical cars
Global issues ppt on Gas cars and advantages of using Electrical cars
 
Electric Cars in Pakistan
Electric Cars in PakistanElectric Cars in Pakistan
Electric Cars in Pakistan
 
Cars of the future
Cars of the futureCars of the future
Cars of the future
 
Next Generation Vehicles: Electric Cars, Emissions, Commuting, and Parking
Next Generation Vehicles: Electric Cars, Emissions, Commuting, and ParkingNext Generation Vehicles: Electric Cars, Emissions, Commuting, and Parking
Next Generation Vehicles: Electric Cars, Emissions, Commuting, and Parking
 
Perspectives on the Future of Transportation and Sustainability: The Importa...
Perspectives on the Future of Transportation and Sustainability:  The Importa...Perspectives on the Future of Transportation and Sustainability:  The Importa...
Perspectives on the Future of Transportation and Sustainability: The Importa...
 
Joule, a spearhead for the south African Electric Vehicle and Battery industr...
Joule, a spearhead for the south African Electric Vehicle and Battery industr...Joule, a spearhead for the south African Electric Vehicle and Battery industr...
Joule, a spearhead for the south African Electric Vehicle and Battery industr...
 
Electric cars
Electric carsElectric cars
Electric cars
 
Hamza hzc
Hamza hzcHamza hzc
Hamza hzc
 
Electric Car Quotes: The Best Quotes about Electric Vehicle
Electric Car Quotes: The Best Quotes about Electric VehicleElectric Car Quotes: The Best Quotes about Electric Vehicle
Electric Car Quotes: The Best Quotes about Electric Vehicle
 
Interesting facts about Electric Vehicles
Interesting facts about Electric VehiclesInteresting facts about Electric Vehicles
Interesting facts about Electric Vehicles
 
NZC - Le Clerc
NZC - Le ClercNZC - Le Clerc
NZC - Le Clerc
 
Common Questions about Electric Vehicles
Common Questions about Electric VehiclesCommon Questions about Electric Vehicles
Common Questions about Electric Vehicles
 
Buildings and Electric Vehicles
Buildings and Electric VehiclesBuildings and Electric Vehicles
Buildings and Electric Vehicles
 

Similaire à Living with a plug-in electric car in Canberra

e-Vehicles (2).pdf
e-Vehicles (2).pdfe-Vehicles (2).pdf
e-Vehicles (2).pdfCristie1
 
plug in hybrid vehicles in electric vehicles
plug in hybrid vehicles in electric vehiclesplug in hybrid vehicles in electric vehicles
plug in hybrid vehicles in electric vehiclesshivrampatilscoemech
 
Current status of the electric car
Current status of the electric carCurrent status of the electric car
Current status of the electric carvladtempest5
 
Electric Cars- The 'Plug and Drive' Future is Here
Electric Cars- The 'Plug and Drive' Future is HereElectric Cars- The 'Plug and Drive' Future is Here
Electric Cars- The 'Plug and Drive' Future is HereTest Equipment Expert
 
EV - Environmental impact
EV - Environmental impactEV - Environmental impact
EV - Environmental impactGajalakshmiK4
 
Electric scooter report
Electric scooter reportElectric scooter report
Electric scooter reportAdinath Londhe
 
Abb canada ev final
Abb canada ev finalAbb canada ev final
Abb canada ev finalFabMob
 
A conspectus on electric vehicle in india
A conspectus on electric vehicle in indiaA conspectus on electric vehicle in india
A conspectus on electric vehicle in indiaParth Pandya
 
Dr Matani- Latest Advancements in electric vehicles (2) (1)[P-copy.ppt
Dr Matani- Latest Advancements in electric vehicles (2) (1)[P-copy.pptDr Matani- Latest Advancements in electric vehicles (2) (1)[P-copy.ppt
Dr Matani- Latest Advancements in electric vehicles (2) (1)[P-copy.pptRk Sharma
 
Electric vehicle trends
Electric vehicle trendsElectric vehicle trends
Electric vehicle trendsPranav Dorle
 
How Promising Will be the Future of EV?
How Promising Will be the Future of EV?How Promising Will be the Future of EV?
How Promising Will be the Future of EV?SibiKrishnan
 
Electric vehicles - DecarbEurope
Electric vehicles - DecarbEuropeElectric vehicles - DecarbEurope
Electric vehicles - DecarbEuropeLeonardo ENERGY
 
City of Hillsboro EV 101 by Connor Herman and Manuel Morales
City of Hillsboro EV 101 by Connor Herman and Manuel Morales City of Hillsboro EV 101 by Connor Herman and Manuel Morales
City of Hillsboro EV 101 by Connor Herman and Manuel Morales Forth
 
EV / AV AutoBook 2019 Preview
EV / AV AutoBook 2019 PreviewEV / AV AutoBook 2019 Preview
EV / AV AutoBook 2019 PreviewUli Kaiser
 
The Electric Two Wheeler Market - UK
The Electric Two Wheeler Market - UKThe Electric Two Wheeler Market - UK
The Electric Two Wheeler Market - UKvixstermae
 
Presentation e rickshaw
Presentation e rickshawPresentation e rickshaw
Presentation e rickshawNAUMAN NAEEM
 
E Scooters in Scandinavia and Sustainability
E Scooters in Scandinavia and SustainabilityE Scooters in Scandinavia and Sustainability
E Scooters in Scandinavia and SustainabilityAqib Syed
 

Similaire à Living with a plug-in electric car in Canberra (20)

e-Vehicles (2).pdf
e-Vehicles (2).pdfe-Vehicles (2).pdf
e-Vehicles (2).pdf
 
plug in hybrid vehicles in electric vehicles
plug in hybrid vehicles in electric vehiclesplug in hybrid vehicles in electric vehicles
plug in hybrid vehicles in electric vehicles
 
Current status of the electric car
Current status of the electric carCurrent status of the electric car
Current status of the electric car
 
Cab-e
Cab-eCab-e
Cab-e
 
Electric Cars- The 'Plug and Drive' Future is Here
Electric Cars- The 'Plug and Drive' Future is HereElectric Cars- The 'Plug and Drive' Future is Here
Electric Cars- The 'Plug and Drive' Future is Here
 
EV - Environmental impact
EV - Environmental impactEV - Environmental impact
EV - Environmental impact
 
Electric scooter report
Electric scooter reportElectric scooter report
Electric scooter report
 
Abb canada ev final
Abb canada ev finalAbb canada ev final
Abb canada ev final
 
A conspectus on electric vehicle in india
A conspectus on electric vehicle in indiaA conspectus on electric vehicle in india
A conspectus on electric vehicle in india
 
Dr Matani- Latest Advancements in electric vehicles (2) (1)[P-copy.ppt
Dr Matani- Latest Advancements in electric vehicles (2) (1)[P-copy.pptDr Matani- Latest Advancements in electric vehicles (2) (1)[P-copy.ppt
Dr Matani- Latest Advancements in electric vehicles (2) (1)[P-copy.ppt
 
Electric vehicle trends
Electric vehicle trendsElectric vehicle trends
Electric vehicle trends
 
How Promising Will be the Future of EV?
How Promising Will be the Future of EV?How Promising Will be the Future of EV?
How Promising Will be the Future of EV?
 
Electric vehicles - DecarbEurope
Electric vehicles - DecarbEuropeElectric vehicles - DecarbEurope
Electric vehicles - DecarbEurope
 
Driving Change
Driving ChangeDriving Change
Driving Change
 
City of Hillsboro EV 101 by Connor Herman and Manuel Morales
City of Hillsboro EV 101 by Connor Herman and Manuel Morales City of Hillsboro EV 101 by Connor Herman and Manuel Morales
City of Hillsboro EV 101 by Connor Herman and Manuel Morales
 
EV / AV AutoBook 2019 Preview
EV / AV AutoBook 2019 PreviewEV / AV AutoBook 2019 Preview
EV / AV AutoBook 2019 Preview
 
Electric Vehicles Ppt.pptx
Electric Vehicles Ppt.pptxElectric Vehicles Ppt.pptx
Electric Vehicles Ppt.pptx
 
The Electric Two Wheeler Market - UK
The Electric Two Wheeler Market - UKThe Electric Two Wheeler Market - UK
The Electric Two Wheeler Market - UK
 
Presentation e rickshaw
Presentation e rickshawPresentation e rickshaw
Presentation e rickshaw
 
E Scooters in Scandinavia and Sustainability
E Scooters in Scandinavia and SustainabilityE Scooters in Scandinavia and Sustainability
E Scooters in Scandinavia and Sustainability
 

Plus de Dave Southgate

2021 carbon footprint report
2021 carbon footprint report2021 carbon footprint report
2021 carbon footprint reportDave Southgate
 
2020 carbon footprint report
2020 carbon footprint report2020 carbon footprint report
2020 carbon footprint reportDave Southgate
 
2019 Household Carbon Footprint Report
2019 Household Carbon Footprint Report2019 Household Carbon Footprint Report
2019 Household Carbon Footprint ReportDave Southgate
 
2019 Annual Report: Household Energy Transition
2019 Annual Report: Household Energy Transition2019 Annual Report: Household Energy Transition
2019 Annual Report: Household Energy TransitionDave Southgate
 
Heat yourself: Not Your House
Heat yourself: Not Your House Heat yourself: Not Your House
Heat yourself: Not Your House Dave Southgate
 
Aviation carbon footprint of global scheduled domestic passenger flights - 2012
Aviation carbon footprint of global scheduled domestic passenger flights - 2012Aviation carbon footprint of global scheduled domestic passenger flights - 2012
Aviation carbon footprint of global scheduled domestic passenger flights - 2012Dave Southgate
 
Aviation carbon footprint of global scheduled international passenger flights...
Aviation carbon footprint of global scheduled international passenger flights...Aviation carbon footprint of global scheduled international passenger flights...
Aviation carbon footprint of global scheduled international passenger flights...Dave Southgate
 
The carbon footprint of aircraft operations in Australia - 2011
The carbon footprint of aircraft operations in Australia - 2011The carbon footprint of aircraft operations in Australia - 2011
The carbon footprint of aircraft operations in Australia - 2011Dave Southgate
 
2016 Annual Report - Household energy transition
2016 Annual Report - Household energy transition2016 Annual Report - Household energy transition
2016 Annual Report - Household energy transitionDave Southgate
 
Becoming a Fossil Fuel Free Family
Becoming a Fossil Fuel Free FamilyBecoming a Fossil Fuel Free Family
Becoming a Fossil Fuel Free FamilyDave Southgate
 

Plus de Dave Southgate (13)

2021 carbon footprint report
2021 carbon footprint report2021 carbon footprint report
2021 carbon footprint report
 
Annual report 2021
Annual report 2021Annual report 2021
Annual report 2021
 
2020 carbon footprint report
2020 carbon footprint report2020 carbon footprint report
2020 carbon footprint report
 
Annual Report 2020
Annual Report 2020Annual Report 2020
Annual Report 2020
 
2019 Household Carbon Footprint Report
2019 Household Carbon Footprint Report2019 Household Carbon Footprint Report
2019 Household Carbon Footprint Report
 
2019 Annual Report: Household Energy Transition
2019 Annual Report: Household Energy Transition2019 Annual Report: Household Energy Transition
2019 Annual Report: Household Energy Transition
 
Annual Report 2018
Annual Report 2018 Annual Report 2018
Annual Report 2018
 
Heat yourself: Not Your House
Heat yourself: Not Your House Heat yourself: Not Your House
Heat yourself: Not Your House
 
Aviation carbon footprint of global scheduled domestic passenger flights - 2012
Aviation carbon footprint of global scheduled domestic passenger flights - 2012Aviation carbon footprint of global scheduled domestic passenger flights - 2012
Aviation carbon footprint of global scheduled domestic passenger flights - 2012
 
Aviation carbon footprint of global scheduled international passenger flights...
Aviation carbon footprint of global scheduled international passenger flights...Aviation carbon footprint of global scheduled international passenger flights...
Aviation carbon footprint of global scheduled international passenger flights...
 
The carbon footprint of aircraft operations in Australia - 2011
The carbon footprint of aircraft operations in Australia - 2011The carbon footprint of aircraft operations in Australia - 2011
The carbon footprint of aircraft operations in Australia - 2011
 
2016 Annual Report - Household energy transition
2016 Annual Report - Household energy transition2016 Annual Report - Household energy transition
2016 Annual Report - Household energy transition
 
Becoming a Fossil Fuel Free Family
Becoming a Fossil Fuel Free FamilyBecoming a Fossil Fuel Free Family
Becoming a Fossil Fuel Free Family
 

Dernier

Call Girls Ramtek Call Me 7737669865 Budget Friendly No Advance Booking
Call Girls Ramtek Call Me 7737669865 Budget Friendly No Advance BookingCall Girls Ramtek Call Me 7737669865 Budget Friendly No Advance Booking
Call Girls Ramtek Call Me 7737669865 Budget Friendly No Advance Bookingroncy bisnoi
 
Alandi Road ( Call Girls ) Pune 6297143586 Hot Model With Sexy Bhabi Ready ...
Alandi Road ( Call Girls ) Pune  6297143586  Hot Model With Sexy Bhabi Ready ...Alandi Road ( Call Girls ) Pune  6297143586  Hot Model With Sexy Bhabi Ready ...
Alandi Road ( Call Girls ) Pune 6297143586 Hot Model With Sexy Bhabi Ready ...tanu pandey
 
Kondhwa ( Call Girls ) Pune 6297143586 Hot Model With Sexy Bhabi Ready For ...
Kondhwa ( Call Girls ) Pune  6297143586  Hot Model With Sexy Bhabi Ready For ...Kondhwa ( Call Girls ) Pune  6297143586  Hot Model With Sexy Bhabi Ready For ...
Kondhwa ( Call Girls ) Pune 6297143586 Hot Model With Sexy Bhabi Ready For ...tanu pandey
 
DENR EPR Law Compliance Updates April 2024
DENR EPR Law Compliance Updates April 2024DENR EPR Law Compliance Updates April 2024
DENR EPR Law Compliance Updates April 2024itadmin50
 
Book Sex Workers Available Pune Call Girls Kondhwa 6297143586 Call Hot India...
Book Sex Workers Available Pune Call Girls Kondhwa  6297143586 Call Hot India...Book Sex Workers Available Pune Call Girls Kondhwa  6297143586 Call Hot India...
Book Sex Workers Available Pune Call Girls Kondhwa 6297143586 Call Hot India...Call Girls in Nagpur High Profile
 
Call Now ☎️🔝 9332606886 🔝 Call Girls ❤ Service In Muzaffarpur Female Escorts ...
Call Now ☎️🔝 9332606886 🔝 Call Girls ❤ Service In Muzaffarpur Female Escorts ...Call Now ☎️🔝 9332606886 🔝 Call Girls ❤ Service In Muzaffarpur Female Escorts ...
Call Now ☎️🔝 9332606886 🔝 Call Girls ❤ Service In Muzaffarpur Female Escorts ...Anamikakaur10
 
Call Girls Moshi Call Me 7737669865 Budget Friendly No Advance Booking
Call Girls Moshi Call Me 7737669865 Budget Friendly No Advance BookingCall Girls Moshi Call Me 7737669865 Budget Friendly No Advance Booking
Call Girls Moshi Call Me 7737669865 Budget Friendly No Advance Bookingroncy bisnoi
 
CSR_Module5_Green Earth Initiative, Tree Planting Day
CSR_Module5_Green Earth Initiative, Tree Planting DayCSR_Module5_Green Earth Initiative, Tree Planting Day
CSR_Module5_Green Earth Initiative, Tree Planting DayGeorgeDiamandis11
 
Cyclone Case Study Odisha 1999 Super Cyclone in India.
Cyclone Case Study Odisha 1999 Super Cyclone in India.Cyclone Case Study Odisha 1999 Super Cyclone in India.
Cyclone Case Study Odisha 1999 Super Cyclone in India.cojitesh
 
RATING SYSTEMS- IGBC, GRIHA, LEED--.pptx
RATING  SYSTEMS- IGBC, GRIHA, LEED--.pptxRATING  SYSTEMS- IGBC, GRIHA, LEED--.pptx
RATING SYSTEMS- IGBC, GRIHA, LEED--.pptxJIT KUMAR GUPTA
 
Call Girls In Bloom Boutique | GK-1 ☎ 9990224454 High Class Delhi NCR 24 Hour...
Call Girls In Bloom Boutique | GK-1 ☎ 9990224454 High Class Delhi NCR 24 Hour...Call Girls In Bloom Boutique | GK-1 ☎ 9990224454 High Class Delhi NCR 24 Hour...
Call Girls In Bloom Boutique | GK-1 ☎ 9990224454 High Class Delhi NCR 24 Hour...rajputriyana310
 
VVIP Pune Call Girls Vishal Nagar WhatSapp Number 8005736733 With Elite Staff...
VVIP Pune Call Girls Vishal Nagar WhatSapp Number 8005736733 With Elite Staff...VVIP Pune Call Girls Vishal Nagar WhatSapp Number 8005736733 With Elite Staff...
VVIP Pune Call Girls Vishal Nagar WhatSapp Number 8005736733 With Elite Staff...SUHANI PANDEY
 
Call Girls In Okhla DELHI ~9654467111~ Short 1500 Night 6000
Call Girls In Okhla DELHI ~9654467111~ Short 1500 Night 6000Call Girls In Okhla DELHI ~9654467111~ Short 1500 Night 6000
Call Girls In Okhla DELHI ~9654467111~ Short 1500 Night 6000Sapana Sha
 
Get Premium Hoskote Call Girls (8005736733) 24x7 Rate 15999 with A/c Room Cas...
Get Premium Hoskote Call Girls (8005736733) 24x7 Rate 15999 with A/c Room Cas...Get Premium Hoskote Call Girls (8005736733) 24x7 Rate 15999 with A/c Room Cas...
Get Premium Hoskote Call Girls (8005736733) 24x7 Rate 15999 with A/c Room Cas...MOHANI PANDEY
 
Book Sex Workers Available Pune Call Girls Khadki 6297143586 Call Hot Indian...
Book Sex Workers Available Pune Call Girls Khadki  6297143586 Call Hot Indian...Book Sex Workers Available Pune Call Girls Khadki  6297143586 Call Hot Indian...
Book Sex Workers Available Pune Call Girls Khadki 6297143586 Call Hot Indian...Call Girls in Nagpur High Profile
 
Contact Number Call Girls Service In Goa 9316020077 Goa Call Girls Service
Contact Number Call Girls Service In Goa  9316020077 Goa  Call Girls ServiceContact Number Call Girls Service In Goa  9316020077 Goa  Call Girls Service
Contact Number Call Girls Service In Goa 9316020077 Goa Call Girls Servicesexy call girls service in goa
 
Call On 6297143586 Pimpri Chinchwad Call Girls In All Pune 24/7 Provide Call...
Call On 6297143586  Pimpri Chinchwad Call Girls In All Pune 24/7 Provide Call...Call On 6297143586  Pimpri Chinchwad Call Girls In All Pune 24/7 Provide Call...
Call On 6297143586 Pimpri Chinchwad Call Girls In All Pune 24/7 Provide Call...tanu pandey
 
NO1 Verified kala jadu karne wale ka contact number kala jadu karne wale baba...
NO1 Verified kala jadu karne wale ka contact number kala jadu karne wale baba...NO1 Verified kala jadu karne wale ka contact number kala jadu karne wale baba...
NO1 Verified kala jadu karne wale ka contact number kala jadu karne wale baba...Amil baba
 

Dernier (20)

Call Girls Ramtek Call Me 7737669865 Budget Friendly No Advance Booking
Call Girls Ramtek Call Me 7737669865 Budget Friendly No Advance BookingCall Girls Ramtek Call Me 7737669865 Budget Friendly No Advance Booking
Call Girls Ramtek Call Me 7737669865 Budget Friendly No Advance Booking
 
Alandi Road ( Call Girls ) Pune 6297143586 Hot Model With Sexy Bhabi Ready ...
Alandi Road ( Call Girls ) Pune  6297143586  Hot Model With Sexy Bhabi Ready ...Alandi Road ( Call Girls ) Pune  6297143586  Hot Model With Sexy Bhabi Ready ...
Alandi Road ( Call Girls ) Pune 6297143586 Hot Model With Sexy Bhabi Ready ...
 
Kondhwa ( Call Girls ) Pune 6297143586 Hot Model With Sexy Bhabi Ready For ...
Kondhwa ( Call Girls ) Pune  6297143586  Hot Model With Sexy Bhabi Ready For ...Kondhwa ( Call Girls ) Pune  6297143586  Hot Model With Sexy Bhabi Ready For ...
Kondhwa ( Call Girls ) Pune 6297143586 Hot Model With Sexy Bhabi Ready For ...
 
DENR EPR Law Compliance Updates April 2024
DENR EPR Law Compliance Updates April 2024DENR EPR Law Compliance Updates April 2024
DENR EPR Law Compliance Updates April 2024
 
Book Sex Workers Available Pune Call Girls Kondhwa 6297143586 Call Hot India...
Book Sex Workers Available Pune Call Girls Kondhwa  6297143586 Call Hot India...Book Sex Workers Available Pune Call Girls Kondhwa  6297143586 Call Hot India...
Book Sex Workers Available Pune Call Girls Kondhwa 6297143586 Call Hot India...
 
Call Now ☎️🔝 9332606886 🔝 Call Girls ❤ Service In Muzaffarpur Female Escorts ...
Call Now ☎️🔝 9332606886 🔝 Call Girls ❤ Service In Muzaffarpur Female Escorts ...Call Now ☎️🔝 9332606886 🔝 Call Girls ❤ Service In Muzaffarpur Female Escorts ...
Call Now ☎️🔝 9332606886 🔝 Call Girls ❤ Service In Muzaffarpur Female Escorts ...
 
Call Girls Moshi Call Me 7737669865 Budget Friendly No Advance Booking
Call Girls Moshi Call Me 7737669865 Budget Friendly No Advance BookingCall Girls Moshi Call Me 7737669865 Budget Friendly No Advance Booking
Call Girls Moshi Call Me 7737669865 Budget Friendly No Advance Booking
 
CSR_Module5_Green Earth Initiative, Tree Planting Day
CSR_Module5_Green Earth Initiative, Tree Planting DayCSR_Module5_Green Earth Initiative, Tree Planting Day
CSR_Module5_Green Earth Initiative, Tree Planting Day
 
(NEHA) Call Girls Navi Mumbai Call Now 8250077686 Navi Mumbai Escorts 24x7
(NEHA) Call Girls Navi Mumbai Call Now 8250077686 Navi Mumbai Escorts 24x7(NEHA) Call Girls Navi Mumbai Call Now 8250077686 Navi Mumbai Escorts 24x7
(NEHA) Call Girls Navi Mumbai Call Now 8250077686 Navi Mumbai Escorts 24x7
 
Cyclone Case Study Odisha 1999 Super Cyclone in India.
Cyclone Case Study Odisha 1999 Super Cyclone in India.Cyclone Case Study Odisha 1999 Super Cyclone in India.
Cyclone Case Study Odisha 1999 Super Cyclone in India.
 
RATING SYSTEMS- IGBC, GRIHA, LEED--.pptx
RATING  SYSTEMS- IGBC, GRIHA, LEED--.pptxRATING  SYSTEMS- IGBC, GRIHA, LEED--.pptx
RATING SYSTEMS- IGBC, GRIHA, LEED--.pptx
 
Call Girls In Bloom Boutique | GK-1 ☎ 9990224454 High Class Delhi NCR 24 Hour...
Call Girls In Bloom Boutique | GK-1 ☎ 9990224454 High Class Delhi NCR 24 Hour...Call Girls In Bloom Boutique | GK-1 ☎ 9990224454 High Class Delhi NCR 24 Hour...
Call Girls In Bloom Boutique | GK-1 ☎ 9990224454 High Class Delhi NCR 24 Hour...
 
Green Marketing
Green MarketingGreen Marketing
Green Marketing
 
VVIP Pune Call Girls Vishal Nagar WhatSapp Number 8005736733 With Elite Staff...
VVIP Pune Call Girls Vishal Nagar WhatSapp Number 8005736733 With Elite Staff...VVIP Pune Call Girls Vishal Nagar WhatSapp Number 8005736733 With Elite Staff...
VVIP Pune Call Girls Vishal Nagar WhatSapp Number 8005736733 With Elite Staff...
 
Call Girls In Okhla DELHI ~9654467111~ Short 1500 Night 6000
Call Girls In Okhla DELHI ~9654467111~ Short 1500 Night 6000Call Girls In Okhla DELHI ~9654467111~ Short 1500 Night 6000
Call Girls In Okhla DELHI ~9654467111~ Short 1500 Night 6000
 
Get Premium Hoskote Call Girls (8005736733) 24x7 Rate 15999 with A/c Room Cas...
Get Premium Hoskote Call Girls (8005736733) 24x7 Rate 15999 with A/c Room Cas...Get Premium Hoskote Call Girls (8005736733) 24x7 Rate 15999 with A/c Room Cas...
Get Premium Hoskote Call Girls (8005736733) 24x7 Rate 15999 with A/c Room Cas...
 
Book Sex Workers Available Pune Call Girls Khadki 6297143586 Call Hot Indian...
Book Sex Workers Available Pune Call Girls Khadki  6297143586 Call Hot Indian...Book Sex Workers Available Pune Call Girls Khadki  6297143586 Call Hot Indian...
Book Sex Workers Available Pune Call Girls Khadki 6297143586 Call Hot Indian...
 
Contact Number Call Girls Service In Goa 9316020077 Goa Call Girls Service
Contact Number Call Girls Service In Goa  9316020077 Goa  Call Girls ServiceContact Number Call Girls Service In Goa  9316020077 Goa  Call Girls Service
Contact Number Call Girls Service In Goa 9316020077 Goa Call Girls Service
 
Call On 6297143586 Pimpri Chinchwad Call Girls In All Pune 24/7 Provide Call...
Call On 6297143586  Pimpri Chinchwad Call Girls In All Pune 24/7 Provide Call...Call On 6297143586  Pimpri Chinchwad Call Girls In All Pune 24/7 Provide Call...
Call On 6297143586 Pimpri Chinchwad Call Girls In All Pune 24/7 Provide Call...
 
NO1 Verified kala jadu karne wale ka contact number kala jadu karne wale baba...
NO1 Verified kala jadu karne wale ka contact number kala jadu karne wale baba...NO1 Verified kala jadu karne wale ka contact number kala jadu karne wale baba...
NO1 Verified kala jadu karne wale ka contact number kala jadu karne wale baba...
 

Living with a plug-in electric car in Canberra

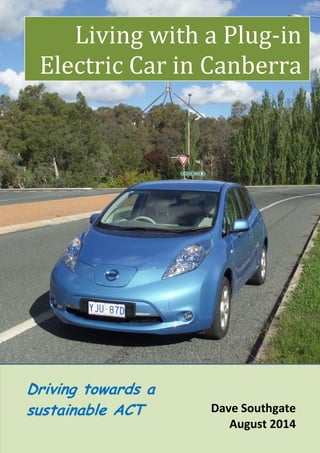
  • 1. 1 Living with a Plug-in Electric Car in Canberra Dave Southgate August 2014 Driving towards a sustainable ACT
  • 2. 2 FOREWORD The electric car has arrived! After decades of false starts, production models of plug-in electric vehicles (EVs) are now globally available from major car manufacturers. They are beautiful to drive and cost very little to run. However, at the moment they cost more to buy and generally have a shorter range than conventional cars. The sales of EVs are growing rapidly around the world – more than 500,000 plug-in EVs have been sold globally over the past three years. To date this revolution has largely passed Australia by. It is exceptional to see a plug-in electric car on the streets in Canberra and the mainstream media in Australia rarely reports on this fundamental transition in the fuelling of the world’s land transport. I have therefore produced this book in an attempt to both raise awareness of the practicalities of owning an EV in Canberra and, probably more importantly, to draw attention to how the advent of the EV provides the ACT with opportunities to establish a sustainable future. The introduction of EVs into Canberra is particularly important given the wonderful strides that the ACT Government has made in introducing renewable energy into the Territory. By 2020 90% of our electricity consumption should be derived from renewables. An electricity sector based on renewables opens up a vision of carbon free urban transport. At the present time the electricity and transport sectors make up about 85% of the ACT carbon footprint – the path to almost total elimination of carbon from these two sectors is now in sight. While this book is focussed on action within the ACT I think much of the material has wider applicability. Many cities and regions around the world are now moving towards carbon neutrality - I imagine the EV has a place in all of these. Dave Southgate Canberra Australian Capital Territory (ACT) August 2014 ________________________________________________ Disclaimer The author has no commercial interests in the electric vehicle or renewable energy industries. He is self-funded and has produced this document purely in pursuit of a personal wish to see society adopt more sustainable transport options. Cover Photo: A Leaf among leaves – Parliament House, Canberra ©dsouthgate 2014 Any material in this document may be freely reproduced and distributed without acknowledgement.
  • 3. 3 SNAPSHOT Is Canberra a Good Place to Own an Electric Vehicle? Absolutely! I don’t think I’ll ever go back to owning a conventional petrol car. An electric car makes an ideal city car for the Canberra resident. Electric cars are great to drive and ‘filling up’ at home is extremely convenient. Why Electric Vehicles? Electric vehicles are rapidly being introduced around the world. There are three key drivers:  climate change  air quality  energy security Advances in battery technology mean electric vehicles are now economic and practical. Key Information  For many motorists the life cycle costs of owning an electric car (EV) are now likely to be less than for owning a petrol car. An EV costs more to buy than a conventional car but the fuel costs are less.  I estimate that after about 10 years the total costs for my EV will be the same as if I’d bought a petrol car.  On average I travel about 40km/day in my EV which is about 15,000km/year. Two hours of charging for my car provides about 50km range.  My electric car uses about 7kWh/day. The annual fuel cost to run my electric car will be around $400 compared to $2,000 for my previous petrol car.  The day-to-day minimum range of my car is about 100km – more than enough for a city car in Canberra.  I have a 2kW solar PV system which generates around the same amount of energy in a year as my car uses to travel about 15,000km. Sustainable Canberra The ACT Government has adopted a goal of 90% of the Territory’s electricity consumption being sourced from renewables by 2020. By 2018 the transport sector will become the largest component of the ACT’s carbon footprint. The 90% renewables goal underpins climate change action in the electricity sector. The development of a parallel goal for the uptake of electric vehicles could provide a vital stimulus for CO2 management in the transport sector.
  • 4. 4 CHAPTER 1 INTRODUCTION Page 5 Page 3CHAPTER 2 Buying and Using My Car Page 14 CHAPTER 3 Charging the Battery Page 22 CHAPTER 5 The Costs Page 35 CHAPTER 4 My Solar System Page 29 CHAPTER 7 Action Options Page 53 CHAPTER 6 Role of the EV Page 44 Author Page 73 APPENDIX Page 62 Part I MY ELECTRIC CAR PROJECT Part 2 SUSTAINABLE CANBERRA CONTENTS [These are live tiles – click to select]
  • 5. 5 Introduction 1.1 The Rebirth of the Electric Vehicle The electric vehicle (EV) has been with us for a long time. In the late 1800s and early 1900s electric powered cars outsold petrol cars but as motoring developed liquid fuelled cars became established due to their greater range and speed of re-fuelling. While petrol and diesel fuels have dominated road vehicles for over a century, during that time electricity has been widely used to power public transport (for example trams and trolley buses) and many attempts have been made to produce workable electric cars.1 Small groups of enthusiasts have continued to use and promote electric cars. In recent years there have been a number of electric vehicle festivals in Canberra which have showcased the latest EV developments. Until recently most electric cars on the road have been conversions of commercial petrol cars. However, in the past three years there has been a dramatic EV renaissance. Advances in battery technology have led to EVs now becoming both technically feasible and affordable. Around 2010, the major car manufacturers began producing, and selling globally, plug-in electric cars. Figure 1.1 shows the trends in global sales of plug-in electric passenger cars since 2009 (this dramatic increase is off a very low base).2 Production electric vehicles are now readily available in many countries and it appears that the EV is transitioning from an enthusiasts’ niche to the mainstream. Global EV sales are currently doubling every year and if these trends continue there will be more than 1,000,000 EVs on world roads by 2016.3 While sales around the world have surged, Australia has not contributed significantly to this trend. Only about 100 EVs were sold to private individuals in Australia in 2013.4 1 Electric cars and history. Edison Tech Center: http://www.edisontechcenter.org/ElectricCars.html 2 Driving electrification: A global comparison of fiscal policy for electric vehicles. Figure 1. ICCT. May 2014: http://theicct.org/driving-electrification-global-comparison-fiscal-policy-electric-vehicles 3 Electric car sales have doubled every year for three years. Transport Evolved. April 2014: http://transportevolved.com/2014/04/16/number-electric-cars-world-doubled-past-year-say-academics/ 4 2013 Plug-in EV sales in Australia. InsideEVs: http://insideevs.com/2013-plug-in-electric-vehicle-sales-in-australia/ Figure 1.1: Global sales of plug-in electric passenger cars, 2009-2013 CONTENTS: Snapshot Introduction My Car Battery Solar PV Costs Sustainable ACT Appendix Author
  • 6. 6 1.2 The Pressures for Change There are many reasons why electric vehicles are now starting to make a comeback. The Box on the next page summarises the key reasons why governments are promoting the transition to EVs. The pressures are varied and different governments clearly place different emphasis on the reasons for wanting to electrify their transport systems. Many individuals, and governments, see the need to address climate change as the main imperative to adopt EVs. However, EV detractors commonly express the view that if an EV is charged from an electricity network based on coal fired generation there may be no, or very small, climate change advantages to using EVs.5 Figure 1.2 captures the essence of this issue.6 The information in this diagram suggests that a petrol car with a fuel efficiency of 8l/100km has the same life cycle carbon footprint as an electric car which is powered by electricity sourced from coal. This is a complex area which is worthy of examination but in the context of the ACT, where the Territory is rapidly moving toward 90% of its electricity being sourced from renewables, this does not appear to be a significant issue. While air quality may not be a major driver for the ACT government or residents to opt for EVs, it is a top priority in countries with urban air quality problems. The modern EV has its origins in California where in 1990 the State government mandated that from 2003 10% of all vehicle sales must be zero emissions in order to address air quality issues.7 In China air quality is one of the key political issues of the day (see Figure 1.3)8 . In March this year, restrictions were placed on petrol/diesel cars in Paris for some days due to a persistent fog.9 In London Mayor Boris Johnson has recently announced requirements for all London taxis to be zero emission capable from 2018 primarily for air quality reasons.10 5 Electric cars’ benefit to environment not as great as claimed. April 2014: http://www.climatechangedispatch.com/electric-cars-benefit-to-environment-not-as-great-as-claimed.html 6 What’s the greenest car? An extremely short guide to vehicle emissions. Shrink That Footprint. April 2014: http://shrinkthatfootprint.com/greenest-car-vehicle-emissions 7 Air Resources Board. California State Government: http://www.arb.ca.gov/knowzone/history.htm 8 Photo source: http://en.wikipedia.org/wiki/File:HarbinChinaSmog_121226.jpg#file 9 France curbs Paris car drivers to combat dangerous smog. Reuters UK. March 2014: http://uk.reuters.com/article/2014/03/16/uk-france-pollution-idUKBREA2F0BF20140316 10 Transport for London. Press release. January 2014: http://www.noodls.com/view/FE88B1370D96FC544154D510865EEC50D48F7F9D?3285xxx1389878269 Figure 1.2: EV carbon footprint – electricity sourced from renewables compared to coal Figure 1.3: Smog over Harbin, China CONTENTS: Snapshot Introduction My Car Battery Solar PV Costs Sustainable ACT Appendix Author
  • 7. 7 Global Pressures to Go Electric Around the globe there are strong pressures to move toward a carbon free road transport system. In some regions of the world significant changes are occurring. These changes involve not only a move to electric cars but also to electric buses, taxis, motorcycles and bicycles. There appear to be three key drivers for the transition to electric vehicles: In many countries transport contributes around 20% of the carbon footprint. In Australia road transport makes up about 85% of the transport carbon footprint. Electrifying road transport will make significant reductions in global CO2 levels. Urban air quality is poor in many cities of the world. For example, the problems being encountered in China, and earlier this year in France, have been highly publicised. Adoption of electric vehicles with zero emissions in the urban area can lead to significant improvements in the health and quality of life of city dwellers. If a country is heavily dependent on imported fuels for its transport systems its economy is open to disruption. In Australia oil refineries are progressively being shut down and we are becoming increasingly dependent on imported liquid fuels. Electric vehicles offer fuel diversity and are particularly suited to integration with renewable energy. There are many factors, both positive and negative, which are influencing the rate of uptake of electric vehicles. These include: Cost – at the present time the purchase price of an electric vehicle is generally significantly more than an equivalent conventionally fuelled vehicle. By the same token the running costs are significantly less. The breakeven point for cost appears to be in the area of 5 to 10 years. Range – electric vehicles generally have markedly less range than their petrol/diesel equivalent. Nevertheless the current generation of electric vehicles have a range which more than adequately meets the day-to-day needs of a ‘city vehicle’. Limited choice – only a limited number of models and makes of electric vehicles are currently available on the market. The ones available tend to be at the luxury end of the market. Given their very recent introduction there is effectively no market in used electric cars at the moment. Comfort/performance – people who test drive an electric car generally report a very positive response particularly about the smooth/rapid acceleration and the lack of noise and vibration. CONTENTS: Snapshot Introduction My Car Battery Solar PV Costs Sustainable ACT Appendix Author Climate Change Air Quality Energy Security Uptake Factors
  • 8. 8 Fuel security is a major driver to go EV in many economies. Electric vehicles offer the potential for liquid fuels to be substituted by other energy sources – coal; natural gas; and renewables are the obvious substitute energy sources when using electricity. Fuel security is particularly relevant to Australia where our capacity to produce petroleum and other liquid fuels is being progressively eroded - we are moving toward a transport regime based very heavily on imported liquid fuels. Many people have raised concerns about what it would mean for our transport systems if there were major interruptions to shipping (strikes; weather; terrorism, etc). Following announcements in 2011 and 2012 of the closure of the Clyde and Kurnell refineries, the NRMA commissioned a report looking into Australia’s fuel security.11,12 Subsequent to the release of that report, in April of this year BP announced the closing of its Brisbane refinery.13 Rising petrol prices are an ongoing reason for individuals and governments to look for alternative transport fuels. Electric vehicles are very efficient compared to internal combustion engine (ICE) vehicles. At present EVs cost significantly more to buy than ICE vehicles but have substantially lower fuel costs. Electric vehicles are also mechanically much simpler than ICE vehicles and therefore have lower maintenance costs.14 For an average driver in the ACT it appears that the current payback period if buying an EV instead of an ICE vehicle will be around 7-10 years (see Chapter 5). Electric vehicles represent new technology and integrate well with the emerging renewable energy sources. They also offer an ideal platform for autonomous vehicles which are now being trialled as a way, amongst other things, to improve road safety. In September 2013 a Nissan Leaf was the first vehicle in Japan to receive approval to operate in a driverless mode on Japan’s public roads.15 Noise from road traffic has been an ongoing problem for many decades. At slow speeds EVs are exceptionally quiet. In fact concerns about the lack of noise has led to requirements for slow moving EVs to emit an audible warning signal to alert pedestrians.16 At high speeds the noise difference between an EV and an ICE vehicle for a person living next to a road is not likely to be great since most of the noise generated by a modern car travelling at speed arises from tyre/road and aerodynamic interactions rather than from the engine. 1.3 Author’s Motivation for Going EV After some years working on climate change issues as a Federal bureaucrat I came to the conclusion that agreement on effective strategies to address climate change is unlikely to be achieved at the international level, or indeed at the national level in Australia, within a reasonable time frame. The issues are just too complex and wide ranging. By the same token I was very aware that much was being achieved at the individual and local/regional government level around the world through focussed programs and action. Climate change is an issue that is well suited to ‘bottom-up’ solutions. On my retirement in 2012 I began to search for a climate change project where I, as an individual, could make a difference. 11 Australia’s Liquid Fuel Security. NRMA. 2013: http://www.mynrma.com.au/media/Fuel_Security_Report.pdf 12 Australia’s Liquid Fuel Security. NRMA. 2013: http://www.mynrma.com.au/images/About-PDF/Fuel-Security-Report- Pt2.pdf 13 Jobs to go as BP closes Brisbane refinery. Sydney Morning Herald. April 2014: http://www.smh.com.au/business/mining- and-resources/jobs-to-go-as-bp-closes-brisbane-refinery-20140402-35xkr.html 14 Electric Vehicles: Myths v Reality. Sierra Club: http://content.sierraclub.org/evguide/myths-vs-reality 15 Caradvice website. September 2013: http://www.caradvice.com.au/253761/nissan-leaf-becomes-japans-first-road- legal-autonomous-vehicle/ 16 EU Parliament mandates audible warnings for hybrid and electric vehicles. EV Fleetworld. May 2014: http://evfleetworld.co.uk/news/2014/Apr/European-Parliament-mandates-audible-warnings-for-electric-and-hybrid- vehicles/0438013782 CONTENTS: Snapshot Introduction My Car Battery Solar PV Costs Sustainable ACT Appendix Author
  • 9. 9 Two key happenings led me to choose the transition to EVs as a very worthwhile climate change project. To begin with, in 2012 the ACT Government released a visionary and far reaching plan to address the Territory’s carbon footprint.17 In the plan it adopted a target that 90% of Canberra’s electricity consumption would be sourced from renewables by 2020 – this approach immediately opened up the way for the transition to fossil fuel free transport in the ACT. The chance to turn this opportunity into personal action came in mid-2013 when production EVs became affordable for me – the price for a mainstream electric car dropped below $40,000. The ACT’s adoption of the 90% renewables target demonstrated that at the local level, where there is a fairly homogenous community, it is possible to take strong action on climate change. Globally much of the progress on climate change action is now taking place at the city and regional level – C40 and Regions 20 (R20) are two organisations which are arguably achieving a greater level of international cooperation on climate change than has been possible through the UNFCCC (United Nations Framework Convention on Climate Change) process.18,19 The adoption of carbon neutral electricity leads inexorably to the electrification of transport systems. More than 80% of the ACT’s carbon footprint is derived from either the electricity or transport sectors – electrifying our transport would lead Canberra well down the road to becoming a carbon neutral city. 1.4 Will an EV Work for You? It is important to recognise that the current generation of EVs will not be suitable for all users. Due to the range limitations of current EVs, an individual or family needs to fully understand their travel patterns before making a decision to transition to an EV. The current generation of commercially available EVs (except the very special and highly priced Tesla20 ) have a range which is ideal for a ‘city car’ (charged at home) but which is unlikely to be satisfactory for an all-purpose car given the effective absence of public charging infrastructure in Australia. For the most part this means that a current EV will likely make an excellent second car and be very capable of replacing a family car that is essentially dedicated to ‘running around town’. The nominal range of a current generation EV is typically 150km-200km when fully charged. However, in practice for many people the workable comfortable range of an EV is not likely to be much greater than 100km (just like a petrol car the range depends on the driver and the conditions). Against this background, the first step in working out whether an EV will be suitable is to keep a daily log of distances you currently travel each day in your ‘city car’. The average distance travelled per day by cars in the ACT is about 40km21 – a distance well within the capability of the current EV. However, decisions on choice of vehicle are very often based on the possible occasional use, rather than the day-to-day use (eg buying a four wheel drive vehicle which in practice is very rarely taken off-road), and this needs to be taken into account when determining the suitability of an EV. The author’s personal ‘range experience’ around Canberra is discussed in detail in Chapter 2. In the case of two car families, the range limitation of the city car can often be overcome by the family owning one electric and one internal combustion engine (ICE) vehicle. When a family or individual owns only one car, owning an EV may be feasible if the need to take ‘out of city’ trips is 17 AP2 – A new climate change strategy and action plan for the Australian Capital Territory. ACT Government 2012: http://www.environment.act.gov.au/__data/assets/pdf_file/0006/581136/AP2_Sept12_PRINT_NO_CROPS_SML.pdf 18 Global Leadership on Climate Change. C40Cities: http://www.c40.org/ 19 R20-Regions of Climate Action: http://regions20.org/ 20 Tesla Motors website: http://www.teslamotors.com/en_AU/models 21 Australian motorists drive an average of 15,530km per year. Roy Morgan research. May 2013: http://www.roymorgan.com/findings/australian-moterists-drive-average-15530km-201305090702 CONTENTS: Snapshot Introduction My Car Battery Solar PV Costs Sustainable ACT Appendix Author
  • 10. 10 only occasional. For example, using public transport or hiring an ICE vehicle to undertake longer trips may be an option. Having said that, this is likely to be inconvenient in many cases and a good compromise solution may be to purchase a plug-in hybrid electric vehicle (PHEV). These cars, which are not yet common in Australia, have a battery which can generally power day-to-day trips around the city (say a range up to 60km). When undertaking a longer journey the PHEV seamlessly switches over to a petrol engine when the battery is depleted. Unfortunately at the present time there is not a wide range of EVs on the market in Australia. In fact at the time of writing there are only two choices in Australia for production EVs under $40,000 – the Nissan Leaf and the Mitsubishi iMiev. This paucity of EV choice may well mean that while an individual may decide that they would like to own an EV, the models on sale may not meet certain personal requirements or preferences. Globally many of the major car manufacturers are now making and selling either EVs or PHEVs. Against this background it is interesting to read the 2013 report on a longitudinal survey that was carried out in California to test the views of EV owners (the survey was started in early 2012) - over 90% of more than 2,000 EV users surveyed were satisfied with their vehicle.22 1.5 Renewable Energy Using renewable energy is not a requirement for running an EV. However, to date EV use and renewable energy have often been closely linked. The ‘early adopter’ EV owners are commonly technology enthusiasts who have an interest in achieving carbon neutral transport – either by buying green energy from their electricity retailer or through installing solar PV systems. This has been an effective way of responding to EV detractors who have been very ready to point out weaknesses in the environmental credentials of EVs which use coal based electricity (see Figure 1.2). About 10% of Canberra houses have solar panels.23 However, all EV users in the ACT will effectively have carbon neutral road transport in the near future, with or without solar panels on their roofs, given the fact that 90% of our electricity will be sourced from renewables by 2020. The nexus between renewable energy and EVs is now coming more into focus with the ongoing improvements in battery technology. Battery advances are driving both the uptake of EVs and the increasing interest in residential solar PV systems which include battery storage. In effect solar PV and EV technologies are converging courtesy of advanced batteries. 1.6 Report Focus and Structure I have deliberately given this book a local Canberra focus for a number of reasons. In recent years there has been no shortage of EV discussion papers and project reports examining the potential for introducing EVs across Australia. These have typically been prepared by well-funded bodies from government, industry and academia (see for example ESAA report24 ) - as an individual I am not in a position to develop such comprehensive documents and I also do not want to simply go over old ground. In Section 1.3 I indicated that following several frustrating years working on global solutions to climate change I am now at the point where I believe greater headway may well be made by using bottom-up approaches to CO2 management – focussing a book on one city/Territory allows me to test the reaction to local approaches. Finally, a point I deliberately make many times in this book, 22 California Plug-in Electric Vehicle Driver Survey Results. Air Resources Board. California State Government. May 2013: http://www.electricdrive.org/index.php?ht=a/GetDocumentAction/id/40805 23 Solar Power in the ACT – April 2014 Update. Canberra Green Energy: http://canberragreenenergy.com.au/solar-power- in-the-a-c-t-april-2014-update/ 24 Sparking an Electric Vehicle Debate in Australia. Electricity Supply Association of Australia. November 2013: http://www.esaa.com.au/policy/sparking_an_electric_vehicle_debate_in_australia CONTENTS: Snapshot Introduction My Car Battery Solar PV Costs Sustainable ACT Appendix Author
  • 11. 11 the ACT is now in a unique situation where it is likely to have an electricity sector based almost exclusively on renewable energy within the next five years – in my view it is imperative that studies are carried out to identify ways to build on this important achievement. I hope this simple overview book will stimulate thinking on the way ahead. Part 1 of the report describes the different elements of what I call my ‘EV Project’. The key elements of the project: buying the car; charging the batteries; and the installation and operation of a PV solar system on the roof of our house – are examined in turn in Chapters 2, 3 & 4. These separate elements are brought together in Chapter 5 which discusses the costs associated with the project. I have attempted to make clear that there are a number of optional routes for ‘going EV’ – I describe what I have done but I have also attempted to point out alternative routes for each project stage. In Part 2 (Chapters 6 & 7) I have endeavoured to examine how the EV can play a role in the ACT achieving the outcomes set out in the ACT Government’s climate change action plan. Chapter 6 looks at the carbon footprint of the ACT and examines to what extent the adoption of EVs could potentially reduce the Territory’s carbon footprint. Transport is currently the second largest component of the Territory’s carbon footprint (after electricity) and, according to AP2, the ACT Government’s Climate Change Action Plan, it will become the largest component of the footprint by 2018 (due to the significant reductions now being made in the ACT’s electricity carbon footprint).25 In the final Chapter I explore strategies for encouraging EV uptake with a view to accelerating the Territory towards its long term goal of carbon neutrality. While the book has a Canberra focus I think that much of the information has broader applicability, at least throughout Australia. My experience with the project has led me to become very enthusiastic about EV adoption and the book is unashamedly focussed on discussing what can be achieved with EVs. Nevertheless an honest attempt has been made throughout the book to highlight the limitations and weaknesses of EVs – I am very conscious that overhyping EVs will only generate expectations that cannot be met. Throughout the book there is ongoing reference to the Nissan Leaf. This is not intended to be a promotion of the Leaf – this just happens to be the car I bought and for which I have gathered data. I expect that lessons learnt from my Leaf experience will be broadly applicable to other electric vehicles of a similar capacity used as city cars in Canberra. The reader will have already noticed that I have used a number of abbreviations to describe different vehicle types. Throughout the book when I use the term ‘EV’ I am referring to pure electric (battery only) vehicles – these are sometimes referred to as BEVs in other documents. The term ‘ICE’ (internal combustion engine) vehicles covers vehicles using fuels such as petrol, diesel, CNG and LPG. I believe it is important to differentiate between plug-in hybrid vehicles – ‘PHEVs’ – and conventional hybrid vehicles such as the Toyota Prius (commonly termed HEVs) which have been on the market in Australia for some years. While HEVs have been very important transition vehicles they do not have any facility for inputting electricity from an external source and hence they are not part of the discussion in this book. [Toyota is now marketing a PHEV version of the Prius in Japan and the US.] 25 AP2, Figure 11. ACT Government 2012: http://www.environment.act.gov.au/__data/assets/pdf_file/0006/581136/AP2_Sept12_PRINT_NO_CROPS_SML.pdf CONTENTS: Snapshot Introduction My Car Battery Solar PV Costs Sustainable ACT Appendix Author
  • 12. 12 I envisage that, at least in the near term, PHEVs will be the main cars used in the transition from ICE to EV. To date these have not proven too popular in Australia but the concept of using the car in EV mode when around town (very low fuel costs, no pollution) and then using the ICE mode when on extended trips is likely to be attractive to many people if the purchase price of the car is right. This is not intended to be an academic treatise. I have tried to avoid using technical terms but do use some common technical terminology associated with electricity. I have used ‘grey literature’ for many of the references (newspaper articles, websites, etc) – if some of the references appear to give odd information I would recommend that the reader cross check that information with other sources. I have endeavoured to cross check ‘the facts’ wherever possible but inevitably there will be inconsistencies between information drawn from different sources whether in the formal or the grey literature. CONTENTS: Snapshot Introduction My Car Battery Solar PV Costs Sustainable ACT Appendix Author
  • 13. 13 PART 1 MY ELECTRIC CAR PROJECT
  • 14. 14 Buying & Using my Car 2.1 Introduction This Part of the book is my own personal experience and contains many totally subjective comments. The data I present depends on a wide range of personal factors – for example, the siting of my home and where and how I drive – and therefore, while I do not believe any of these are particularly unusual, I cannot guarantee that another person’s EV experience will be the same, or even similar, to mine. In particular, the range of an EV can vary quite markedly from person to person. In parallel with buying the car, I purchased and had installed at our house a charger for the car and an additional solar PV system on the roof. These two elements of the project are discussed in the next two chapters. The period covered by ‘the project’ is the first 7 months of 2014. I have chosen this time window as it covers the last two months of summer and also the first two months of winter. The data shown in most of the figures relates to the project period. 2.2 Getting Set Up I began the project by monitoring my daily travel distance in my old ICE car for three months in late 2013. Figure 2.1 shows the distribution of the daily travel distances for the trips I carried out around Canberra during that period. I have only shown the ‘around town’ days since I live in a two car family and my wife’s ICE car is available for when we go away on longer trips. The Figure shows that the travel distance for my most common day in that period was in the range 40-50km. I travelled less than 70km on about 85% of the days. There were no days during the period where the distance exceeded 100km. This simple preparatory work gave me confidence that Figure 2.1: Frequency distribution of my daily travel distances in my old ICE car – Q4 2013 0 2 4 6 8 10 12 14 NoofDays Daily Distance (km) Average Daily Distance = 41.3 km CONTENTS: Snapshot Introduction My Car Battery Solar PV Costs Sustainable ACT Appendix Author
  • 15. 15 an EV with a range of at least 100km would very easily meet my ‘around town’ car needs. (This distribution equates to about 15,000km/year which is around the average for a car in Australia.26 ) Once I had gathered a reasonable amount of range data I looked at the available EV options. At the time I was in the market for an EV (the end of 2013) I could only find two choices – the Mitsubishi iMiev and the Nissan Leaf. Both of these cars easily met my range requirements. I decided to buy the Leaf, even though it was approximately $10,000 more than the iMiev, mainly because it looks and feels much more like a ‘normal’ car and also because I think it provides the driver with superior information on energy use and other aspects of car performance. I understand I was the 9th private purchaser of a Leaf in Canberra – a photo of my car is on the front cover. 2.3 Living with the Car I should say upfront that this project has worked out far better than I ever imagined – I love my EV and now cannot envisage ever going back to owning a pure ICE vehicle. Over the past seven months I’ve tried to closely observe the reaction of other people when I tell them I have an EV. If they haven’t seen the car, the first question I invariably get is ‘What colour is it?’ Once we get over that hurdle the questions are generally along the expected lines: ‘How far does it go without charging?’; ‘How do you charge it up?’; ‘What does it cost to run?’ When people see the car for the first time they tend to be surprised as they are expecting to see something that looks like a 1970s bubble car. When I take them for a ride they are surprised at the comfort and performance. Not infrequently I have to assure people that it is a pure electric car – NO PETROL! One of the nicest things has been the driving experience. It is extremely quiet inside, the ride is very smooth since there are no gear changes and the responsiveness is amazing compared to all the other (admittedly rather ‘normal’) cars I’ve previously owned. When you’re driving it feels a bit like sitting in front of a computer rather than driving a car. Figure 2.2 is a photo of the instrument panel immediately in front of the driver in a Leaf. When driving I find myself keeping quite a close eye on the distance the car has left to run before the battery runs out (km figure at bottom right of the panel). I’m also usually aware of how efficiently I am driving (the kWh/km figure in the middle of the panel). The convenience of refuelling the car at home has been an unexpected bonus (see Chapter 3). The very low running costs have induced a feeling that it is costing me nothing to run around town (which is clearly not true). While not ideal, given the fact I am in solar surplus (see Chapter 4) I now tend to not worry too much about how much energy I use in total in my car as long as I can get home. 26 Roy Morgan research. May 2013: http://www.roymorgan.com/findings/australian-moterists-drive-average-15530km- 201305090702 Figure 2.2: The main instrument panel in my EV CONTENTS: Snapshot Introduction My Car Battery Solar PV Costs Sustainable ACT Appendix Author
  • 16. 16 2.4 Energy Use Patterns Examining energy use for an electric vehicle is not straightforward. In this section all the data I am reporting relates to the amount of energy used by the vehicle. This is not the same as the energy put into the vehicle (and the energy you pay for) since my monitoring indicates there is an approximate 20% loss of energy when charging my car. I discuss this issue in detail in Section 3.4. The data behind all the figures in this section can be found in my project core datasheet which is shown in Appendix A.2. Daily Energy Use The driver’s instrument panel in the Leaf has a display which shows the efficiency of travel in units of kWh/km (See Figure 2.2). At the end of each day over the period of the project I noted down both the distance travelled and the value of the kWh/km reading before re-setting the values to zero. This gave me information on how much energy the car was using each day. You can see from Figure 2.3 that the average daily energy use, when derived from the information provided by the car, was 6 kWh/day. It can be seen that the most common level of energy use/day is in the 4-5 kWh band. The car used more than 10 kWh of electricity on about 15% of the days. The days with high energy use generally involved giving the car a top up charge sometime during the day. The days with zero energy represent days where we used the family’s ICE car to go on a trip beyond the range of the EV; or days where we simply used the bikes and/or walked; and holiday breaks. Energy Efficiency When discussing energy efficiency in this book I have converted the units ‘kWh/km’ shown on my EV’s instrument panel to ‘kWh/100km’ in order to allow easier comparisons with fuel use in ICE vehicles (the common unit for fuel consumption used in Australia is ‘litres of fuel/100km’). As indicated in the previous Section, when I am driving I find myself automatically tracking how efficiently I am driving by looking at the car’s instrument panel (Figure 2.2). For me this figure generally tends to stay in a range between 12 and 17 kWh/100km. Figure 2.3: Frequency distribution of the EV daily energy use (car instrument panel) 0 5 10 15 20 25 30 35 NoofDays Energy Range (kWh) Average Energy Use = 6.0 kWh/day CONTENTS: Snapshot Introduction My Car Battery Solar PV Costs Sustainable ACT Appendix Author
  • 17. 17 While driving I can see the quite dramatic increase in instantaneous energy use of say going up a hill or accelerating quickly. I have tried to not let this unduly affect the way I drive – I have tried to be a normal driver and go with the flow of the traffic. When I peruse the web I can see that many EV drivers are much more efficient than I am and tend to get greater range out of their vehicles than I do. By the same token there are no doubt those who perform less efficiently. This seems to be very much an individual issue and is heavily influenced by prevailing conditions – weather, terrain, desired temperature inside the car, etc. Figure 2.4 shows a breakdown of the total energy I used in the car over the project period by daily energy efficiency band (this is based on the energy efficiency figure shown on the driver’s instrument panel at the end of each driving day). It can be seen that more than 50% of the car’s energy use during the project period was on days in the 13 and 14 kWh/100km efficiency bands. I did some very informal monitoring of the effect of having the climate control on – in summer this seemed to degrade performance by up to around 10% but this figure rose to over 15% on those cold Canberra winter days when I needed to use the lights and the wipers in addition to keeping warm. Figure 2.5 pulls these observations together. You can see from this Figure that the driving efficiency was relatively constant at just under 15kWh/100km from January to early June and then it began to deteriorate quite markedly when the cold weather hit (the line shows a 7 day moving average of the daily efficiency). It usually starts to become noticeably cold in Canberra at the end of April but this year it was unseasonally warm during May – the onset of the cold seemed to be delayed until the start of June. Warmer weather reappeared at the end of July and this is reflected in the improvement in the efficiency at the end of the project period. I am confident that this loss of efficiency due to cold weather is a real effect – I don’t believe I made any changes in my driving patterns in June/July. 4% 27% 26% 13% 10% 6% 8% 3% 1% 1% 1% 12 13 14 15 16 17 18 19 20 21 24 Energy Efficiency Band (kWh/100km) Figure 2.4: Proportion of EV energy use by daily efficiency band Overall Efficiency = 14.6 kWh/100km Charge/session ≈ ??kWh kk15,000km/year CONTENTS: Snapshot Introduction My Car Battery Solar PV Costs Sustainable ACT Appendix Author
  • 18. 18 Placing this energy efficiency information in context, in my previous petrol car (a Nissan Pulsar) I was achieving an efficiency of around 8l/100km when driving around Canberra. On an energy basis this is equivalent to about 75 kWh/100km.27 Comparing this with my EV which has a running efficiency of about 15 kWh/100km it can be seen that, at the point of energy use, the EV is about 5 times more efficient than the ICE – this difference in energy efficiency is reflected in the fuel costs of running the two different types of vehicle (see Chapter 5). 2.5 Range Anxiety All cars, both EV and ICE, have a limited range but the differences are very stark. The ICE typically has a range of 500km+ and it is virtually always within range of a service station where it can fill up with fuel within a few minutes. The current generation EV vehicles typically have an effective range which is somewhere in the 100km-150km region and public charging stations are very few and far between in Australia. Even if there is a charging station in range, ‘filling up’ may take 2 or more hours (see Chapter 3). Running out of petrol in an ICE car can usually be rectified with a small can of fuel; running out of charge in an EV probably means your car being put on the back of a recovery truck. It is hardly surprising that ‘range anxiety’ is one of the most talked about topics amongst EV owners! My car has a nominal range of ‘up to 170km’. In practice, based on my experience, I start to get anxious when I travel anything over 100km. I think my car would go about 130km on a full battery in the Canberra area but psychologically I find I want to leave around 20-30km as a ‘reserve in the tank’ just in case there is some unusual event (road accident, diversion, etc) that might leave me electrically embarrassed. I understand that this is quite a normal reaction.28 27 What are the units to submit energy data? What are the conversion factors? Sustainable Energy Authority of Ireland: http://www.seai.ie/Your_Business/Public_Sector/FAQ/Energy_Reporting_Overview/What_units_do_we_use_to_submit_e nergy_data_What_are_the_conversion_factors_used_.html 28 EV range drops by 25% due to psychological safety buffer. Inside EVs. March 2014: http://insideevs.com/study-ev-range- drops-by-25-due-to-psychological-safety-buffer/ Figure 2.5: Daily EV energy efficiency (7 day moving average) showing impacts of cold weather 0 5 10 15 20 25 01-Jan-14 10-Feb-14 22-Mar-14 01-May-14 10-Jun-14 20-Jul-14 Efficency(kWh/100km) Date CONTENTS: Snapshot Introduction My Car Battery Solar PV Costs Sustainable ACT Appendix Author
  • 19. 19 Having said that I think most EV drivers like to push their cars towards the end of the range every now and then just to test out the capabilities. At this point I should say that my car has two charging levels - 80% and 100%. The car handbook advises to charge to 80% full for normal day-to-day operations to preserve the life of the battery and to go to 100% charge when you are trying to maximise the range for a particular trip. Daily Use I imagine my day-to-day around town travel patterns are very similar to those of many families in the ACT – going shopping; picking up kids from school; visits to museums; short trips around the ACT; driving to the start of walks, etc. Over the time I’ve owned the car I’ve deliberately tried to use and drive it as I would my previous cars when travelling around Canberra. I’ve always used the climate control to maintain a comfortable temperature inside the car. I have found no need to creep along or to fry/freeze in order to save the battery. The range of the car has worked out fine for normal day-to-day driving around Canberra. Figure 2.6 shows the distribution of daily travel distances I recorded in the EV over the project period. Comparing this with Figure 2.1, the distance distribution in my old ICE car, the shape is very similar in the frequency bands around the most common days but I have possibly done a few more over 60km trips in the EV. This suggests that the range limitation of my EV is not having any material impact on my ‘around town’ travel behaviour compared to my previous petrol engine car. Overall the EV gets the family from A to B in much the same as my previous ICE car – but with so much more comfort and excitement. On average I travelled 41.0 km/day in the EV during the project period compared to the 41.3 km/day I did in my ICE vehicle in the last three months of 2013. I normally take the handbook advice and charge my car to 80% full (I usually charge the car overnight) – this typically gives a nominal range of about 120km (more on charging the battery in the next Chapter). As you can see from Figure 2.6 this very easily lets me do my normal day-to-day running around. On some days I’ve found myself going more places than usual during the day followed by commitments in the evening – on these days I’ve given the car an approx. 2 hour ‘top up’ in the late afternoon. When I know I’m going to have a big day around town I charge up to 100%. Figure 2.6: Distribution of daily travel distances in my EV 0 5 10 15 20 25 30 35 NoofDays Daily Distance (km) Average daily distance = 41.0 km CONTENTS: Snapshot Introduction My Car Battery Solar PV Costs Sustainable ACT Appendix Author
  • 20. 20 The Sunday Afternoon Drive Canberra, I guess like most Australian cities and towns, has a number of places within say 1 hour’s drive where families go on weekends for picnics, afternoon tea, craft shops, bush walks, river swimming, etc. It’s on these sorts of trips that range anxiety starts to appear. Figure 2.7 shows five locations (roughly north, south, east and west of Canberra) where as a family we have ventured to ‘range test’ the EV. Taking on board what I have said earlier about the effective range of the car being around 100km for my driving in the Canberra region we have restricted ourselves to visiting places within about 50km from home (Belconnen). You can see from the map that these places are all a similar distance from Belconnen – I think I would say that I had some mild ‘range concern’ but not anxiety when we undertook these trips. If you live in Tuggeranong some of these trips (eg Tidbinbilla) will be trivial, others will probably not be possible without a great deal of anxiety (and/or a recovery vehicle). Figure 2.7 is also useful in that it also gives a good visualisation of the size of the urban area of Canberra relative to places that I consider to be at about the end of the car’s range. From north to south Canberra now extends for approximately 50km so I always charge my car up to 100% if I am venturing to the southern part of Tuggeranong. Further Afield I don’t see trips going much further than 50km being practical at the present time in current generation EVs (Teslas aside) since there is no en route charging infrastructure in place in our region. Nevertheless it’s nice to think that this will be a short term constraint and regional and long distance EV trips will be feasible in the not too distant future for Canberran EV owners. I discuss this in Chapter 7. CONTENTS: Snapshot Introduction My Car Battery Solar PV Costs Sustainable ACT Appendix Author
  • 21. 21 2 Gundaroo Murrumbateman Royalla Tidbinbilla Figure 2.7: Map showing comfortable range of my EV (for trips to/from Belconnen) compared to the size of urban Canberra Source: Bing MapsScale: 1 cm ≈ 10 km CONTENTS: Snapshot Introduction My Car Battery Solar PV Costs Sustainable ACT Appendix Author
  • 22. 22 Charging the Battery 3.1 Introduction Refuelling your car at home rather than visiting a service station is probably the only lifestyle change you’ll notice if you transition from an ICE vehicle to an EV. For me this has been one of most pleasant surprises of owning an EV - charging at home is absolutely brilliant! Having said that, since there is no practical public charging infrastructure in place in Canberra at the present time, charging at home is the only real option for refuelling your car if you have an EV. The lack of public charging infrastructure is often cited as a key reason for the slow uptake of EVs around the world. I can see that certain out of town EV users would need to use public chargers in Canberra (eg people visiting Canberra in EVs from surrounding towns and villages) but for Canberra residents who use their EV as a city car I don’t think this is an issue. I’ve never had the need to use a public charger and I don’t think I would change my city driving behaviour even if Canberra were to suddenly become dotted with public chargers. On the other hand, if there were a network of public chargers in regional towns around the ACT I would almost certainly venture further afield in my car (see discussion in Chapter 7). Such a network would enable me to convert my EV from a ‘city car’ to a ‘regional car’. There are three broad categories of EV charger29 in use around the world: Level 1 – the ‘slow charger’; these typically draw about 10 amps and will charge an average car in 8+ hours. A Level 1 charger is usually included with most new EVs as a standard accessory. I have never used the one that came with my car. Level 2 – the standard home use charger; these are typically hard wired into a 32 amp circuit and are fixed on a wall. These will typically charge an average car from ‘flat to full’ in about 4-6 hours. I have one of these and (drawing about 16 amps) on an average night it takes about 2 hours to charge my car (providing around 50km range). Level 3 – these are the ‘fast’ public chargers; they typically draw over 60 amps and will charge a car battery to 80% full in about 30 minutes. While I just love the home battery charging part of owning my EV, this is the one area where I think I would consider doing things differently if I were to start my electric car project over again. 3.2 The Charging Experience This is one of the most raised topics when I talk to people about the EV owning experience. I’ve been surprised by the number of people who have told me they hate going to service stations and would love to be able to re-fuel their car at home. Looking back I had no problems with going to service stations to fill my car but I must say the experience of arriving home; just plugging in the 29 Strictly speaking the EV charger is on board the vehicle and what is commonly termed ‘the charger’ is simply a device to safely provide electricity to the charger. Within the EV family this device is commonly called the EVSE (Electric Vehicle Supply Equipment). In this book I use the term ‘charger’ as this is the most widely used terminology. CONTENTS: Snapshot Introduction My Car Battery Solar PV Costs Sustainable ACT Appendix Author
  • 23. 23 charger, then walking away and coming back the next day to a car with a ‘full tank’ sure beats going to ‘the servo’. I can only speak about my Leaf, but I’m sure it is similar for other EVS - charging is a trivial routine. You take the plug out of some form of holster and insert it in a socket in the front of the car (see Figure 3.1) - the car then automatically fills up the battery to a user selected level at a time also chosen by the user. The car has a very simple interface on the interior computer screen which lets the user set up times for charging. I use an off-peak tariff and usually charge my car overnight (see Figure 3.5). However, on occasions I press an over-ride button and charge the car immediately (usually a top up charge during the day). 3.3 Which Charger? Charging at Home I understand from reading the EV blogs that when charging at home many people solely use the Level 1 charger that comes with the car they bought. This is the cheapest option but it does mean that it will not be possible to do ‘quickish’ battery top ups. The Level 1 charger that comes with the Leaf has a 15 amp plug which means that, unless you do a workaround, you will need to have a 15 amp circuit/socket installed in your garage if you don’t already have one. This is generally not a major job for an electrician. I decided against the Level 1 charger option since I figured that it would be nice to be able to do top up charges whenever I wanted to (this has turned out to be a good decision!). However, deciding to go down the Level 2 charger path does involve decisions and this is the area where I would look harder if for some reason I had to install a new charger. When it came to choosing a Level 2 charger I took the straightforward option. I bought the unit recommended by Nissan. This unit is sold by Origin Energy (see Figure 3.2) – you can see an example of one of these at the Lennock Nissan Philip showroom in Woden. It seems that many Leaf owners are Figure 3.2: The EV charger installed on the wall of my garage at home Figure 3.1: Charging my car at home CONTENTS: Snapshot Introduction My Car Battery Solar PV Costs Sustainable ACT Appendix Author
  • 24. 24 resisting buying this unit because of price. It costs $2,750 fully installed – well over 5% of the price of the car! If you scour around the internet it is possible to find a wide range of alternative chargers and picking one of these could, on the face of it, save you more than $1,000 but of course there are inherent risks in choosing to be independent. If you research the charger issue on the web you get the sense that in the US people are looking to pay around $500 for a charger. It is not too hard to find Level 2 chargers on the web in the $750 – $1,500 range. These have to be installed by an electrician so it is important if buying from overseas to make sure that the unit meets Australian electrical standards. For me the main concern with buying a non-standard unit would be what happens if the charger fails. There is probably not a lot of expertise in Australia at the moment to fix these units and dismantling and sending a unit somewhere to be repaired could be a real hassle. Having said I believe that these devices are comparatively simple so the chances of failure are probably low. I should say that I find the Origin unit technically very solid. I am confident that it is not going to break down; electrocute me or the family; burn the house down; damage my car if there is a massive electrical storm, etc. It is extremely easy to use. If something does go wrong I am confident that it will be fixed very rapidly – this is important since if the charger fails I will effectively have no independent car transport (given the lack of public fast chargers in Canberra). If things came to a push I think I could do a workaround and charge the car from a standard 10 amp socket in my house using the Level 1 charger that came with the car. Putting aside the cost, my main misgiving with the Origin unit is that it does not provide an indication of the energy used during a charging session (the display simply shows instantaneous power). I felt disempowered when I first got the EV. As an ICE owner I knew to the last cent what the fuel for my car was costing; with the EV I could only gain a broad indication of what it was costing (by reading my electricity meter and making assumptions about the energy use of other devices in the house). I overcame this problem by purchasing data logging equipment which I used to gather key parts of the information used in this book (see Appendix A.2). If I were looking for a new charger I would look for one that is capable of providing a datalog on energy use and, ideally, one that gives visual feedback on the total cost of electricity used (it would need to be capable of letting the user input local electricity tariffs by time of use). Public Charging Public charging has yet to take off in the ACT. As I indicated earlier Canberra residents who charge their EVs at home are not likely to need to charge their cars at public places in Canberra. Nevertheless, public charging will presumably be essential if residents from surrounding areas are going to use EVs to come into Canberra to use the city as a regional centre (shopping trips; medical appointments; sporting/cultural events, etc). Figure 3.3: EV charger on the University of Canberra campus CONTENTS: Snapshot Introduction My Car Battery Solar PV Costs Sustainable ACT Appendix Author
  • 25. 25 As far as I can ascertain there are only two operational public charging stations in the ACT at the present time – one on the University of Canberra campus in Belconnen (Figure 3.3) and one at the Abode Hotel in Woden (Figure 3.4). I was unable to find a charging station sign at either site and both seem to be tucked away in rather ‘interesting’ places. The situation in Australia is in marked contrast to that overseas where major EV charging infrastructure is being installed.30 Another interesting move overseas is the setting up of ‘electric highways’.31 The establishment of ‘electric highways’ in Southern NSW would probably be of more interest and potential use to Canberra residents than installing chargers in Canberra itself – this is discussed in Chapter 7. A proposal for this concept has been put forward for Western Australia.32 The issue of where and when to build EV charging infrastructure, and the design and rules of its use, is a complex topic. I have included some preliminary discussion on this in Section 7.6. 3.4 Other Charging Issues Homes without Garages In Canberra most dwellings provide some form of off-street parking for the residents. This contrasts with many of the inner suburbs of our major cities where only on-street parking is available. However, apartment living is becoming more popular in Canberra and residents often only have access to an allocated parking space rather than a private garage. This can make charging at home difficult or indeed impossible. There are issues around, for example, the security of charging equipment in open parking spaces; getting approval from Body Corporates to install chargers; metering and paying for electricity in communal parking areas. These are not trivial issues and these types of constraints may effectively prohibit many people in Canberra from owning an EV. In these circumstances the installation of public charging stations at sites close to apartments may be the only avenue to EV ownership for some Canberra residents. 30 Charging Station. Wikipedia: http://en.wikipedia.org/wiki/Charging_station 31 Supercharger. Tesla Motors website: http://www.teslamotors.com/supercharger 32 The REV project. University of Western Australia: http://www.therevproject.com/ Figure 3.4: EV charger at the Abode Hotel Woden CONTENTS: Snapshot Introduction My Car Battery Solar PV Costs Sustainable ACT Appendix Author
  • 26. 26 Time of Charging Our house uses a time-of-use tariff and as I have said earlier I generally charge the car at night using the off peak rate but do occasionally top the battery during the day which of course involves more expensive electricity. Figure 3.5 shows the time distribution of energy put into the battery by one hour time bands for the part of the period when my data logger was in place (see Appendix A.3). It can be seen that over the logged period the greatest amount of energy input was in the hour 23.00 to midnight – this is because I set the automatic charging to commence at 11pm. About 90% of the energy I put into my EV during the project period was off-peak electricity. The cost outcomes of this pattern of charging are discussed in Chapter 5. Figure 3.6 shows the frequency distribution of the amount of energy put into the car per day during the datalogged period. It can be seen that the most common daily charge input was between 10 and 11kWh. The charger delivers about 20-25km of range per hour – given that my average daily travel is around 40km, this suggests that my car needs to charged, on average, for about two hours each day. The data on minutes of charging per day shown in Figure A.1 indicates that on average the daily charge time is 122.5 minutes. Figure 3.5: Total energy delivered to the EV by hourly time slots. The coloured labels show the electricity provider’s ‘time of use’ periods 0 50 100 150 200 250 300 350 400 450 EnergyDelivered(kWh) Time Period Off-Peak Peak Peak ShoulderShoulder Off-Peak 90% of energy used was off-peak kk15,000km/year CONTENTS: Snapshot Introduction My Car Battery Solar PV Costs Sustainable ACT Appendix Author
  • 27. 27 Charging Inefficiency The charging of any battery has inefficiencies – when a battery is discharged it delivers less energy than was put in during the charging process (energy is primarily lost as heat). For Li-ion batteries the charging efficiency is typically around 80-90%.33 I have attempted to compute this efficiency for my car/charger set up by comparing the energy used by my charger with the energy use reported by the car’s data system. This involves some derived data and I have only been able to compute an approximate efficiency figure: my calculations indicate the charging efficiency to be about 80%. This derivation is shown in Appendix A.3. That is, by my calculations my car uses around 20% more energy than is indicated by the energy efficiency reading shown in the car. This charging inefficiency figure is consistent with the 80-90% efficiency range cited above. This means that in practice, while the EV driving efficiency for the project period was about 15kWh/100km, the overall efficiency of the car was about 17kWh/100km when the charging inefficiency is taken into account. As the user who pays for the fuel I consider this latter figure to be the best indicator of the efficiency of my EV (which of course is still very significantly better than my previous ICE vehicle). Battery Degradation EV detractors often like to suggest that the life of the battery in an EV is short and the cost of replacing the battery is high so the cost advantages of running an EV are much less than first appears. EVs are relatively new but they have been around for a few years now and, as far as I can tell, much of the commentary on EV battery short life and expensive replacement does not hold true. The batteries will slowly degrade over time, but I have not been able to find any reports on the internet of dramatic battery failure in a Nissan Leaf even from people who have had the car for a few years and who have chalked up big kilometres. I guess the life of a modern family car is around 10yrs (say 100,000km -150,000km) and I’m not envisaging any problems getting that sort of life out of my EV. This assessment is essentially consistent with the Nissan Leaf warranty which states the ‘…Lithium-ion battery is warranted against any capacity loss below nine bars of capacity as indicated on the vehicle’s battery level gauge for a period of 60 months or 100,000 kilometres…’. [At full capacity the Nissan Leaf battery has twelve bars so on the face of it the warranty is guaranteeing the battery capacity will remain at 75% or better.] 33 Car Battery Efficiencies. J Sun. October 2010:http://large.stanford.edu/courses/2010/ph240/sun1/ Figure 3.6: Frequency distribution of energy delivered to the EV battery per day (datalogged period) 0 5 10 15 20 25 NoofDays Energy Band (kWh) Average Charge/day = 7.3kWh kk15,000km/year CONTENTS: Snapshot Introduction My Car Battery Solar PV Costs Sustainable ACT Appendix Author
  • 28. 28 Remote Charging In common with many new cars, EVs let the user remotely access and control some facilities in the car using an app on your smartphone. These apps let you do things such as check the charge status of your car; start or stop the charging of your car’s battery if it is hooked up to a charger; send you a message if your current charging session fails; and lets you turn on the climate control before you get in your car. Figure 3.7 shows a sample screen shot from the official Nissan Leaf Android app (there are quite a few independent apps which essentially do the same thing). I occassionally use my phone to check the car battery’s state of charge; I’ve never used it to do any of the other fancy tricks. Figure 3.7: Screenshot of Nissan Leaf Android App CONTENTS: Snapshot Introduction My Car Battery Solar PV Costs Sustainable ACT Appendix Author
  • 29. 29 My Solar System 4.1 Introduction You don’t need a solar system to run an EV but for me this is a key part of my project. As noted earlier, you’ll commonly find that EV owners deliberately aim to have carbon neutral transport and will often buy green energy to achieve this goal if the solar route is not open to them. However, as I also noted before, the ACT Government is planning to source 90% of the Territory’s electricity from renewables by 2020 so Canberra EV owners will no longer need to take any independent action in this area. When I decided to go EV I did this on the basis that my transport would be carbon neutral and that I would aim to do this by generating more solar energy from panels on the roof of our house than we use in total both in the car and the house. In fact for us this is not a really big ask as we use gas for heating, hot water and cooking. You can see from Figure 4.1 that we have achieved this over the life of the project - our electricity generation and consumption are more or less in balance. The data for the solar energy in the first column in the Table contains simulated figures for January and most of February to take account of the fact that we installed an additional 2kW solar PV system at our house in late February. The simulated figures show the electricity generation for the whole period assuming the new solar PV system had been in place on 1 January 2014 (this is explained in Appendix A.4). The monthly EV energy consumption shown in the second data column is similarly a simulated dataset since my charger data logging only commenced in mid March (this is explained in Appendix A.3). This column shows the simulated actual amount of electricity put into the car – not the energy used by the car as derived from the instrument panel (discussed in the previous chapter). The seven months from January to July was selected as the project period so that I could gather a dataset that contained data from two months of summer, all of autumn and then two months of winter. July is generally the coldest month in Canberra and is the month when we usually use the most electricity in the house (this year we took a holiday in July and this of course reduced both our EV and household energy use for the month). Figure 4.1: Comparison between energy generated and energy consumed over life of the project MONTH Solar Energy Production (kWh) EV Energy Consumption (kWh) Total Energy Consumption (House + EV) ( kWh) January 646 152 206 February 500 229 288 March 446 244 338 April 346 172 295 May 317 267 455 June 208 258 475 July 276 196 385 TOTAL 2,739 1,518 2,442 kWh/day 13.0 7.2 11.6 CONTENTS: Snapshot Introduction My Car Battery Solar PV Costs Sustainable ACT Appendix Author
  • 30. 30 I am very happy with my solar system since it has enabled me to meet my project carbon goal. However, as things have turned out, my solar system effectively runs independently of my EV use, due to mismatches between my solar output and my EV charging requirements. In the long run (or possibly even the short run) I would like to use a home battery storage system which lets us export less of the electricity we generate. 4.2 System Description When we moved into our house in 2012 it already had a 2kW solar PV system which operated under the old gross Feed in Tariff (FIT) regime. I added an additional 2kW system in early 2014 as part of the EV project. A schematic description of our household energy flows, including the two solar systems, is shown in Figure 4.2. In the Figure ‘Solar 1’ represents the original FIT system – this feeds straight into the grid and ActewAGL pays us for all the electricity generated. ‘Solar 2’ in the Figure represents the new ‘net metered’ solar system. Since September 2013 all new solar PV systems installed in the ACT are required to operate under a net use tariff. Under this tariff regime, at any given point in time any electricity generated by the panels is first used to meet demand from electricity appliances in the house; if the demand from the house is less than the amount of electricity generated the excess is exported to the grid. The key point here is the instantaneous nature of the netting action – the time of maximum generation of electricity (around noon) rarely matches peak demand in our house and hence about 80% of the electricity we have so far generated with the net metered system has been exported to the grid (detailed data is shown in Figure A.1). The two systems sit side by side on a roof face of our house which is oriented more or less to the NW and has no shading during the day. The systems are standard installations and broadly generate the Figure 4.2: Schematic diagram of average daily electrical energy flows in our house for the project period CONTENTS: Snapshot Introduction My Car Battery Solar PV Costs Sustainable ACT Appendix Author
  • 31. 31 expected amount of kWh/year for a PV system of this size in the Canberra region.34 The weekly electricity generation and consumption patterns for our house and the EV during the project period are shown in Figure 4.3. During the first four months of the project total generation exceeded total consumption (see also Figure 4.1) – this reversed over the last three months as solar generation weakened and our household electricity showed the expected winter increase in use. Until mid April (Week 16) the EV used significantly more electricity than the rest of the house. As the colder weather arrived our household electricity consumption increased to more or less match the EV use until the end of the project period (Week 17 includes Anzac Day – the day when Canberrans usually say the home heating season begins). 4.3 Solar PV Contribution to Car Energy Use While we generate more energy from our solar system than we use in our house and EV combined, as indicated in Section 4.1 we run the solar system quite independently of the EV. One of the key aims of net metering PV systems is that, as far as possible, a householder uses the electricity that they generate rather than exporting it (electricity retailers pay very little for any electricity exported from new solar PV systems). It would be nice if we could use all the electricity we generate to directly charge the EV but this doesn’t work in the current circumstances. As you can see from Figure 4.2, the electrons that get excited in my solar panels do not end up directly delivering energy to my EV; rather the solar energy is mainly exported to the grid and I charge my car from the grid using the off-peak rate which, in the ACT, operates between 10pm and 7am. 34 A Performance Calculator for Grid-Connected PV Systems: http://rredc.nrel.gov/solar/calculators/PVWATTS/version1/ CONTENTS: Snapshot Introduction My Car Battery Solar PV Costs Sustainable ACT Appendix Author Figure 4.3: Weekly solar PV electricity generation compared with EV and household electricity consumption 0 20 40 60 80 100 120 140 160 180 WeeklyEnergyUse/Generation(kWh) Project Week Total Solar PV Generation (kWh) EV Energy Use (kWh) House Electricity Use (kWh) Total Electricity Use (kWh)
  • 32. 32 I do this because of mismatches between the: 1) power output of my solar system and the power demand of my car charger; and 2) time when I want to use my car and the time when my solar system produces electricity. Discussing these in turn: 1) When charging the battery my charger draws about 3.7kW. The maximum power output that I have measured from my net metered system is about 1.8kW. This means that if I tried to use the output of my net metered system to charge my car, the charger would have to draw at least about 2 kW from the grid in order to deliver 3.7 kW. On cloudy days the charger would have to draw more power from the grid. This is illustrated in Figure 4.4. The Figure shows the solar PV generation time profile for a typical day in the project period overlain with a charging profile for a two hour charge between noon and 2pm – the ‘power gap’ is labelled. This diagram is purely illustrative and does not represent an actual day – the example profiles are based on information derived from my data logger (see Appendix A.4). I estimate that if, for example, on a sunny day around noon I were putting 7 kWh into the EV battery (this takes about 2 hours), around 3 to 5 kWh would have to come from the grid (this would vary from summer to winter). By default, charging directly from the solar PV system during the day would take place at a time when the shoulder period tariff applies (see Figure 3.5). On sunny days the cost to me of charging during the day (which involves direct input from solar 2 plus the abovementioned supplementary energy from the grid) would be broadly similar to the cost of charging at night using the off-peak rate. On cloudy days almost all my electricity would be drawn from the grid at the shoulder tariff rate (which costs about 20% more than off-peak). 0 0.5 1 1.5 2 2.5 3 3.5 4 7 8 9 10 11 12 13 14 15 16 17 PowerGenerated/drawn(kW) Hour of Day Figure 4.4: Illustrative data - power drawn by the EV charger overlaid on the power generated by the net metered solar PV system Power drawn by charger Power generated by net metered solar PV system The power gap CONTENTS: Snapshot Introduction My Car Battery Solar PV Costs Sustainable ACT Appendix Author
  • 33. 33 I could address this power mismatch to some extent by ‘trickle charging’ my car using the Level 1 charger that came with my Leaf, or by adding panels to the net metered part of my solar system, but neither of these approaches would overcome the timing mismatches discussed in 2) below. 2) The peak output from my solar system is in the 12pm to 1pm hour. Given the NW orientation of my solar systems it would be expected that they will deliver more energy in the early afternoon than in the late morning. Figure 4.5 shows the time based energy output of my net PV system for a two month sampling period during the project. About 60% of the energy generated by my net PV system was between noon and 4pm – this is reflected in the asymmetric shape of the curve in the Figure. Unfortunately at the time when my net PV system is most productive, my personal commitments mean that the car is rarely at home. I am usually using the car between noon and 4pm every weekday and most weekends. Therefore this means that even if the power mismatch issue discussed in 1) could be overcome, in the absence of a storage battery, I would not be able to charge my car from my net metered system to any great extent since I am almost always using my car during the period when my solar PV is generating a major part of its electricity. Given these constraints, the best charging option for me during the project period was to set up the automatic charging interface in the car so that it charged at night from the grid using the off-peak tariff. 4.4 Discussion It can be seen from Figure 4 .1 that over the project period our combined 4kW solar PV system generated about twice as much energy as I put into the EV. Therefore, given that during this period I travelled about 40km/day (the equivalent of 15,000km/year), in broad terms I expect that my EV will travel about 15,000km/year on the output of our 2kW net metered solar PV system. While I have effectively achieved my carbon neutrality goal, I have not achieved any direct integration between my EV and my solar system. The extent to which the solar system can be integrated with an EV (ie the extent to which a solar system can practically be used to directly charge an EV) is determined by how well the EV charging and solar generating power match and how closely the timing of the PV output and the availability of the car can be aligned. My car and PV systems only indirectly complement each other – I achieve my carbon neutrality by time shifting my energy Figure 4.5: Time of day profile of the total energy output of the net solar PV system for the sample period 0 5 10 15 20 25 30 35 40 45 50 5 6 7 8 9 10 11 12 13 14 15 16 17 18 SolarEnergyGenerated(kWh) Hour of day Energy Generated in Sample Period = 265kWh CONTENTS: Snapshot Introduction My Car Battery Solar PV Costs Sustainable ACT Appendix Author
  • 34. 34 generation and consumption via the grid. To rectify this situation I will need to incorporate battery storage into my solar PV system. Battery Storage I have no problems with using the electricity grid and recognise that it needs to be paid for equitably. However, the current tariff structures are now driving the owners of net metered solar PV systems to seriously consider the installation of home battery storage and energy management systems. Domestic battery storage systems are now appearing on the Australian market but as yet are relatively expensive. In some regional areas of Australia electricity providers are mandating battery storage for small (and larger) solar systems under some circumstances for ‘energy smoothing’ purposes.35 In the United States pundits seem to be surprised at the rate of reduction in battery prices.36 It is not difficult to envisage that in a year or so it will be financially beneficial to add a battery storage system to domestic net metered solar PV systems in Canberra. Without going into any great detail, during the project period my ‘solar 2’ system generated 840 kWh of electricity and we exported about 80% of this (ie we were not able to use this electricity at the time it was generated). We received 7.5c/kWh from our electricity retailer (ActewAGL) for exported electricity and then bought back electricity for 24.86c/kWh at peak times and for 14.08c/kWh at off-peak times. Clearly the bigger the gap between the sell and buy prices the more attractive battery storage becomes. In simple terms the aim of the battery storage will be to store electricity generated by the solar PV system during the day so that it can be used at peak times (when the sun is not shining). In addition, at times when the solar system is not generating sufficient energy (a cloudy day) some systems enable the battery to be replenished at off-peak times (and tariffs) to make electricity available for use during peak periods. For some people acquiring battery storage is likely to be a prelude to going ‘off-grid’. However, for most people (including my household) it will simply be a way to minimise the amount of external electricity they buy. Either way battery storage does threaten the status quo for long established electricity generators who are now seeing a progressive fall in demand for their product – electricity consumption in Australia’s National Electricity Market has fallen every year over the past five years (about 6% in total).37 There are important synergies between EVs and solar PV with battery storage. Reductions in the price of batteries will generate a positive feedback loop between the two technologies since the batteries used in both applications are identical. Cheaper batteries will reduce the price, and increase the uptake, for both EVs and domestic solar PV with battery storage. Tesla Motors has announced it will build a ‘gigafactory’ to produce Li-ion batteries and expects that this will drive down the costs of batteries by more 30% at the end of the first year of production.38 The batteries are intended for use in both EVs and home solar systems.39 35 Horizon Power. WA: http://www.horizonpower.com.au/renewable_energy_technical_requirements.html 36 Are EV battery prices much lower than we think? Clean Technica. January 2014: http://cleantechnica.com/2014/01/07/ev-battery-prices-much-lower-think/ 37 National Electricity Market electricity consumption. Australian Energy Regulator: http://www.aer.gov.au/node/9765 38 Gigafactory. Tesla Motors. February 2014: http://www.teslamotors.com/blog/gigafactory 39 Home energy battery backup. SolarCity: https://www.solarcity.com/residential/energy-storage CONTENTS: Snapshot Introduction My Car Battery Solar PV Costs Sustainable ACT Appendix Author
  • 35. 35 The Costs 5.1 Introduction Computing and reporting costs is not a straightforward issue – there are many ways to evaluate the benefit of projects. In this chapter I describe the costs/benefits of my project from my perspective – I will leave it to the reader to form a view of how legitimate the costing methodologies I’ve adopted are. To reinforce what I have said earlier, my ‘EV project’ involved the purchase of the EV, the battery charging system and the new net metered solar PV system. I have therefore included all three of these elements in my costings. However, you do not have to buy a charger or a solar system to successfully buy and operate an EV – the inclusion of the latter two elements reflects my personal choice. In broad terms, EVs cost more to buy than conventional cars but cost significantly less to run. I estimate that the costs of owning and running an EV will generally be level with the costs of owning and running an ICE somewhere between 5-10 years after purchase (see Section 5.4). Over the project period costs have changed – electricity prices in the ACT increased by about 4% on 1 July 2014. The Federal Government has announced its intention to index excise on petrol. 5.2 Upfront Costs The Car My costs – Nissan Leaf $40,000. At the present time I estimate that an EV costs somewhere between $10,000 and $15,000 more than an equivalent ICE. This is a rather subjective assessment of what is a dynamic situation. The Nissan Leaf was costing more than $50,000 until mid-2013. I entered the market when the price was dramatically reduced to about $40,000. When looking for an EV I was offered a brand new Mitsubishi iMiev for $29,000 when the advertised price was around $52,000. Unfortunately there is little competition in the EV market in Australia at the moment. The established Nissan Leaf40 and Mitsubishi iMiev41 are still for sale in Canberra. Two new ‘high end’ EVs – the BMW i342 and the Tesla Model S ($100,000)43 - have arrived on the scene in recent months. Some PHEVs can be bought in Canberra – the Holden Volt44 has been on sale in Canberra for some time; this has recently been joined by the Mitsubishi Outlander ($50,000)45 ; and there is also a PHEV 40 Nissan Leaf. 100% Electric. Zero Petrol. Nissan: http://www.nissan.com.au/Cars-Vehicles/LEAF/Overview 41 i-Miev. Plug into the Future. Mitsubishi Motors: http://www.mitsubishi-motors.com.au/vehicles/i-miev 42 BMWi3. Electric and Electrifying. BMW: http://www.bmw.com.au/com/en/newvehicles/i/i3/2013/showroom/introduction.html 43 Model S. Zero Emissions. Zero Compromises. Tesla Motors: http://www.teslamotors.com/en_AU/ 44 Long Range Electric Holden Volt. Holden: http://www.holden.com.au/cars/volt#/overview 45 Outlander PHEV. The world’s first plug-in hybrid SUV. Mitsubishi Motors: http://www.mitsubishi- motors.com.au/vehicles/outlander-phev CONTENTS: Snapshot Introduction My Car Battery Solar PV Costs Sustainable ACT Appendix Author
  • 36. 36 version of the BMW i3. [The prices in this paragraph are purely indicative and have been taken from the manufacturers’ websites for what appear to be base models.] There are Australian companies specialising in conversions of ICE vehicles to EV. In addition to the cars cited in the previous paragraph, many major global car manufacturers are now either making, or are on the point of making, EVs and/or PHEVs but are not yet marketing these in Australia. The latest figures that I can find indicate that there are 18 EV and PHEV models for sale in the United States at the present time.46 As more competition enters the market and production volumes increase one would expect to see EV prices fall. Developments in battery production are indicating a 30% reduction in the price of batteries by 2017.47 The Charger My costs – Origin Energy Charger $ 2,750 In Section 3.3 I briefly discussed costs for Level 2 EV charging systems – in broad terms an installed hard wired charger is likely to cost somewhere between $1,000 and $3,000. You can certainly pay more than $3,000 if you want a charger that is networked or that has security card access, etc but not surprisingly most interest is in looking for chargers at the bottom end of the price range. I haven’t researched this topic to any great extent but the search for inexpensive chargers generates a fair bit of discussion on the EV websites. If you don’t intend to purchase the recommended charger for your car it means spending some time on the web looking at discussion forums and the sites of independent EV equipment providers. It goes without saying that if you go down this route it is important that the equipment you buy meets the relevant Australian electrical standards. As mentioned earlier, while probably somewhat restrictive, the cheapest option is to simply use the charger that is included when you buy a new EV. The Solar System My costs – 2kW system $3,500 As far as I can tell the cost of my solar PV system was about the average, or a little below the average, for a 2 kW domestic rooftop solar PV system installed in Canberra at the present time (this works out at approx. $1.75 per Watt). The price of PV systems has been dropping dramatically throughout the world for many years. This trend is shown in Figure 5.1.48 There is now price uncertainty in the Australian market because of the yet to be resolved debate surrounding the future of the Federal Government’s RET (Renewable Energy Target). While this debate is holding up large renewable energy projects, the domestic solar PV sector is still active.49 46 Electric vehicle sales growing fast, cross half million mark. RenewEconomy. July 2014: http://reneweconomy.com.au/2014/electric-vehicle-sales-growing-fast-cross-half-million-mark-13784 47 Gigafactory. Tesla Motors. February 2014: http://www.teslamotors.com/blog/gigafactory 48 Solar PV module prices have fallen by 80% since 2008, Wind turbines 29%. Clean Technica. May 2014: http://cleantechnica.com/2013/05/06/solar-pv-module-prices-have-fallen-80-since-2008-wind-turbines-29/ 49 People power: Rooftop solar PV reaches 3 GW in Australia. Reneweconomy. Dec 2013: http://reneweconomy.com.au/2013/people-power-rooftop-solar-pv-reaches-3gw-in-australia-99543 CONTENTS: Snapshot Introduction My Car Battery Solar PV Costs Sustainable ACT Appendix Author
  • 37. 37 5.3 Ongoing Costs The Fuel - Electricity My Costs - $1.16/day Figure 3.5 shows that during the project period I primarily charged the vehicle using the ActewAGL off-peak rate of 14.08c/kWh which is a component of the Home time-of-use plan. The tariff schedule for the first six months of the project period is shown in Figure 5.2.50 Figure 3.5 also shows I did on occasions also give the car a top up charge which was mainly at the shoulder tariff of 19.25c/kWh. On 1 July ActewAGL increased its electricity rates by around 4%. The daily EV charging costs shown in Figure 5.3 incorporate the new tariffs. ActewAGL also has a tariff called ‘off-peak night plan’ which it states is ‘…applicable to [amongst other things] charging electric vehicles…’. This tariff was 10.23c/kWh. Naturally I explored this option but I decided not to use it as it has strict limitations on the times of use - while I put about 90% of the energy into my EV at night (see Figure 3.5), I would not want to limit use of my home charger to specific times. I find it difficult to imagine this ‘electric car’ tariff being attractive to any private individual but it could be useful for a business that routinely charges a fleet of vehicles at night and has alternative charging points for use during the day. 50 Residential Electricity Prices. ActewAGL: http://www.actewagl.com.au/Product-and-services/Offers-and- prices/Prices/Residential/ACT/Electricity-prices.aspx [This link takes you to the current tariff (post I July)] Figure 5.2: ActewAGL ‘Home time-of-use plan’ tariff on 1 January 2014 Figure 5.1: Price trajectory of solar PV modules 1976-2012 CONTENTS: Snapshot Introduction My Car Battery Solar PV Costs Sustainable ACT Appendix Author
  • 38. 38 Figure 5.3 shows my daily expenditure on electricity for the EV during the project period (see Appendix A.3 for the details of the computations). For the most part, the cost was between 50c and $2.50/day while the average cost was about $1.15/day. By way of contrast, I estimate that I was spending about $5/day to fuel my previous ICE vehicle. The rate of increase in the price of electricity would very reasonably be a concern for someone contemplating moving to an EV. After all, between June 2007 and June 2012, the retail price of electricity in Canberra rose 45%.51 However, it appears that the outlook for electricity prices is now more stable - the Australian Energy Market Commission has stated that electricity prices are expected to decrease by 0.7 per cent a year over the three years from 2012/13 to 2015/16.52 [It is interesting to place this advice in context – the prices of electricity have just risen by 4% in the ACT]. Putting this aside, many people are now installing solar PV systems as a way to cushion against increases in the price of electricity. Battery Degradation As an EV progresses through its life the battery degrades along with the rest of the car – detractors commonly cite this as a hidden cost of running an EV. I briefly discussed battery degradation in Section 3.4 and as far as I can tell battery degradation should be of no greater importance than degradation of other parts of the car (all cars degrade with age and distance travelled). This is certainly an issue of interest on the Leaf owners’ sites but there don’t seem to be any great problems emerging.53 The Nissan Warranty suggests that the battery may lose up to 25% of its capacity after 100,000 km. If this is the case it would not have any great impact on my use of the car 51 Household energy use and costs. Australian Bureau of Statistics. September 2012: http://www.abs.gov.au/AUSSTATS/abs@.nsf/Lookup/4102.0Main+Features10Sep+2012 52 2013 Residential Electricity Price Trends. Australian Energy Market Commission. December 2013: www.aemc.gov.au/media/docs/2013-Residential-Electricity-Price-Trends-Final-Report-723596d1-fe66-43da-aeb6- 1ee16770391e-0.PDF 53 How to check battery capacity, degradation and range. US Nissan Leaf users discussion forum: http://www.mynissanleaf.com/viewtopic.php?f=31&t=8342 Figure 5.3: Daily cost of electricity to fuel my EV 0 0.5 1 1.5 2 2.5 3 3.5 ElectricityCost(AUD) Date Average daily electricity cost = $1.16 CONTENTS: Snapshot Introduction My Car Battery Solar PV Costs Sustainable ACT Appendix Author
  • 39. 39 as a city vehicle since I would still have plenty of range for my normal day to day journeys (see Figure 2.6). Nissan recently announced that the cost for a new battery for the Leaf in the US will be about $5,500 USD.54 Maintenance Electric vehicles are mechanically very simple compared to ICE vehicles. The EV contains no liquid fuel or exhaust systems; has no clutch and one gear; the engine essentially has one moving part compared to the hundreds of moving parts in an ICE. It would appear reasonable to assume that this simplicity will result in lower maintenance costs. At the present time the total cost of the ‘capped price service’ for a Nissan Leaf (first six years of the car’s life) is about 40% less than for the same ‘capped price service’ for the Nissan Pulsar, a similar sized car from the same manufacturer.55 Depreciation This is an unknown since at the moment there are virtually no well-used EVs on the second hand market in Canberra (or indeed in Australia). Since EVs have only been on sale in Australia for about 2 or 3 years there is no experience of what they will be worth when they reach what may be a typical re-sale threshold of around 100,000 km. If there are fears about the longevity of the battery, the value of EVs may depreciate more quickly than ICE vehicles. On the other hand, the possibility to purchase a second hand car with very low running costs could make EVs a very attractive proposition compared to the purchase of a similar aged ICE vehicle. I was fully aware of possible accelerated depreciation when I purchased my Leaf and any residual value after say 10 years will be a bonus (the resale value of my last ICE car had more or less evaporated by the time I sold it with around 100,000 km on the clock). In the US, which has a much longer EV experience than Australia, media articles indicate that EVs do not do well in the resale market. However, it is important to note that in the US the actual purchase price of new EVs is commonly heavily discounted via government grants and incentives so any quoted % depreciation may be somewhat misleading.56 5.4 Overall Costs The fundamental question is how do the total costs of owning and using an EV compare to those of owning and using an ICE? There is no straightforward answer to this question as there are many cost variables which need to be taken into account on an individual by individual basis. In an effort to demonstrate some indicative costs I have generated two example charts which show a family of scenario payback times for a given variable. These charts are purely illustrative – there are many possible variables that could be explored. I have chosen one variable which gives a broad spread of payback times and another where the payback times are much more closely spaced. Both examples are based on charging the car with off-peak electricity. 54 Update on Nissan Leaf Battery Replacement. My Nissan Leaf. June 2014: http://www.mynissanleaf.com/viewtopic.php?f=4&t=17168#p374490 55 Capped price service. Nissan Motors Australia website: http://www.nissan.com.au/Owners/Owner-Information/Capped- Price-Service 56 Depreciation hits electric cars hard. USA Today. December 2013: http://www.usatoday.com/story/money/cars/2013/12/26/plug-in-cars-electric-cars-depreciation-resale-residual- value/4194373/ CONTENTS: Snapshot Introduction My Car Battery Solar PV Costs Sustainable ACT Appendix Author
  • 40. 40 1) Variable distance travelled Assumptions: EV efficiency: 17 kWh/100km. ICE efficiency 8 litres/100km (approx. average city cycle efficiency for Australia). Electricity cost 16c/kWh. Petrol cost $1.55/litre. The lines in Figure 5.4, for three distance scenarios, have been constructed by computing the annual fuel cost for an EV and an ICE vehicle using the above assumptions and then plotting the accumulated savings in fuel costs of an EV compared to an ICE vehicle over time. As noted earlier, an EV has cheap running costs and high capital costs while the reverse is true for an ICE vehicle. Figure 5.4 shows three lines which give the payback time relationship between distance travelled and savings in fuel costs that are made when transitioning from ICE to EV. For any given additional capital cost the payback time will be shorter the further the EV travels (this assumes that an ICE would be used to travel this distance if an EV were not being used). For example, say a person spent $10,000 more for an EV + charger than he/she would have paid for an ICE vehicle, the payback time would be about 5 years if the vehicle were used for 20,000km/yr and about 10 years if the vehicle were used for 10,000km/yr. I have shown in Figure 2.6 that I use my car on average about 40 km each day which equates to around 15,000km per year. I guess very roughly that I spent around $15,000 more for my EV plus the charger than I would have done had I bought an equivalent new ICE vehicle (something I have never done in my life) so I think that my payback time will be of the order of 10 years. This is a very crude assessment which doesn’t, for example, take into account discount rates. It is also one dimensional in that it doesn’t take into account the accelerated depreciation that will take place if an EV travels 20,000km rather than 10,000km per year or the depreciation of an EV compared to an ICE. Figure 5.4: Indicative cumulative fuel cost savings for three different distance travelled scenarios (EV v ICE) - 5,000 10,000 15,000 20,000 1 2 3 4 5 6 7 8 9 10 TotalFuelCostSavings(AUD) Years from Start 10,000 km/yr 15,000 km/yr 20,000 km/yr CONTENTS: Snapshot Introduction My Car Battery Solar PV Costs Sustainable ACT Appendix Author
  • 41. 41 2) Variable driving efficiency Assumptions: Distance travelled: 15,000km/yr. ICE efficiency 8 litres/100km (approx. average city cycle efficiency for Australia). Electricity cost 16c/kWh. Petrol cost $1.55/litre. In a similar manner to Figure 5.4, the lines in Figure 5.5 have been constructed by computing the annual fuel cost for an EV and an ICE vehicle using the above assumptions and then plotting the accumulated savings in fuel costs of an EV compared to an ICE vehicle over time for three driving efficiency scenarios. I have chosen efficiencies which essentially cover my range of driving efficiencies (see Figure 2.4) even though I barely registered any days at 12kWh/100km or 22kWh/100km. I discussed driving efficiency in Section 2.4. When I’ve had a day where I’ve achieved 12kWh/100km for the day’s driving I feel very proud of myself; when I only achieve about 18kWh/100km for a day I feel like I have transgressed some unwritten law (the difference is often due to factors like having to use the lights, heater, wiper, etc). In the Nissan Leaf the feelings of triumph or guilt are compounded by a rather annoying female voice from the car’s computer system which ranks your efficiency performance each day. Against that background the obvious question is does driving efficiency significantly affect your payback time? You can see from Figure 5.5 that differences in driver efficiency in fact make relatively little difference to payback time. This outcome primarily arises due to the fact that while the differences in energy use per year between the efficiency scenarios are relatively large, these do not translate into significant monetary differences due to the low price of electricity compared to petrol. For example, after 10 years the savings of an EV over an ICE are about $15,700 when driving at 12kWh/100km and about $14,500 when driving at 17kWh/100km. This example also shows that the issue of charging inefficiency which was discussed in Section 3.4 is not significant when considering impacts on payback time. CONTENTS: Snapshot Introduction My Car Battery Solar PV Costs Sustainable ACT Appendix Author Figure 5.5: Indicative cumulative fuel cost savings for three different driving efficiency scenarios (EV v ICE) - 5,000 10,000 15,000 20,000 1 2 3 4 5 6 7 8 9 10 TotalFuelCostSavings(AUD) Years from Start 22 kWh/100km 17 kWh/100km 12 kWh/100km