SlideShare une entreprise Scribd logo
1  sur  13
Télécharger pour lire hors ligne
0 0 M O N T H 2 0 1 6 | V O L 0 0 0 | N A T U R E | 1
LETTER doi:10.1038/nature17435
Restoring cortical control of functional movement
in a human with quadriplegia
Chad E. Bouton1
†, Ammar Shaikhouni2,3
, Nicholas V. Annetta1
, Marcia A. Bockbrader2,4
, David A. Friedenberg5
,
Dylan M. Nielson2,3
, Gaurav Sharma1
, Per B. Sederberg2,6
, Bradley C. Glenn7
, W. Jerry Mysiw2,4
, Austin G. Morgan1
,
Milind Deogaonkar2,3
& Ali R. Rezai2,3
Millions of people worldwide suffer from diseases that lead to
paralysis through disruption of signal pathways between the brain
and the muscles. Neuroprosthetic devices are designed to restore
lost function and could be used to form an electronic ‘neural bypass’
to circumvent disconnected pathways in the nervous system. It has
previously been shown that intracortically recorded signals can be
decoded to extract information related to motion, allowing non-
human primates and paralysed humans to control computers and
robotic arms through imagined movements1–11
. In non-human
primates, these types of signal have also been used to drive activation
of chemically paralysed arm muscles12,13
. Here we show that
intracortically recorded signals can be linked in real-time to muscle
activation to restore movement in a paralysed human. We used a
chronically implanted intracortical microelectrode array to record
multiunit activity from the motor cortex in a study participant with
quadriplegia from cervical spinal cord injury. We applied machine-
learning algorithms to decode the neuronal activity and control
activation of the participant’s forearm muscles through a custom-
built high-resolution neuromuscular electrical stimulation system.
The system provided isolated finger movements and the participant
achieved continuous cortical control of six different wrist and hand
motions. Furthermore, he was able to use the system to complete
functional tasks relevant to daily living. Clinical assessment showed
that, when using the system, his motor impairment improved from
the fifth to the sixth cervical (C5–C6) to the seventh cervical to first
thoracic (C7–T1) level unilaterally, conferring on him the critical
abilities to grasp, manipulate, and release objects. This is the first
demonstration to our knowledge of successful control of muscle
activation using intracortically recorded signals in a paralysed
human. These results have significant implications in advancing
neuroprosthetic technology for people worldwide living with the
effects of paralysis.
The study participant was a 24-year-old male with stable,
non-spastic C5/C6 quadriplegia from cervical spinal cord injury
(SCI) sustained in a diving accident 4 years previously. He under-
went implantation of a Utah microelectrode array (Blackrock
Microsystems) in his left primary motor cortex. As shown in Fig. 1a,
the hand area of the primary motor cortex was identified preopera-
tively by performing functional magnetic resonance imaging (fMRI)
while the participant attempted to mirror videos of hand movements.
The final array implantation location was chosen during surgery,
targeting the hand area while avoiding sulci and injury to large cor-
tical vessels. The implant location was confirmed by co-registration
of postoperative computed tomography imaging with preoperative
fMRI (Fig. 1a) and is consistent with the ‘knob’ region of the primary
motor cortex5,14
.
The participant attended up to three sessions weekly for 15 months
after implantation to use the neural bypass system (NBS). In each
session, he was trained to utilize his motor cortical neuronal activity to
control a custom-built high-resolution neuromuscular electrical stim-
ulator (NMES). The NMES delivered electrical stimulation to his para-
lysed right forearm muscles using an array of 130 electrodes embedded
in a custom-made flexible sleeve wrapped around the arm (Fig. 1b).
The participant was positioned in front of a computer monitor, and a
stereo camera was placed overhead to track and record hand move-
ments (Fig. 1c). During the study, up to 50 single units could be isolated
in a given session. Near the end of the study, 33 units could be isolated
with a mean signal-to-noise ratio of 3.05 ± 0.81 (mean ± s.d.) including
units that responded to imagined or performed wrist movements
(Fig. 1d). (See Extended Data Fig. 1 for additional unit activity.) Wavelet
decomposition of the multiunit activity recorded from 96 microelec-
trodes was used to produce mean wavelet power (MWP) features for
decoding (Fig. 1e) (see Methods).
To assess the ability of the NBS to restore individual movements, we
focused on six wrist and hand movements that were all impaired by the
participant’s injury and reactivated by stimulation of forearm muscles
(see Supplementary Video 1 showing the participant attempting the
six movements without the use of the NBS). Each session began with
recalibration of the NMES to map electrode stimulation patterns to
evoked movements (see Methods). Cortical activity was continuously
decoded as the participant attempted the six selected movements inter-
leaved with rest periods, as cued by an animated virtual hand on the
computer monitor. Changes in the MWP patterns for each movement
were captured during the test. These patterns were then processed by
multiple simultaneous neural decoders, one for each trained move-
ment, using a nonlinear kernel method with a non-smooth support
vector machine15
. The decoders were trained in successive blocks and,
once trained, their outputs were continuously compared using the
highest decoder output to control the corresponding NMES movement
stimulation pattern (see Methods). During movement, a large portion
of the stimulation artefact that occurred during a stimulation pulse was
removed, but stimulation effects still remained (see Methods).
To test the system’s performance, test blocks were performed con-
sisting of five trials of each of the six trained movements presented
in random order. At the beginning of each trial, the participant was
visually cued by the virtual hand demonstrating a target movement.
Representative data, including modulation of MWP (before and after
stimulation begins), decoder outputs, and corresponding movement
state are shown in Fig. 2. MWP increases by a factor of 2–8 after stim-
ulation begins because of residual stimulation artefact (see Methods
and Extended Data Fig. 2). However, since the neural decoders were
trained with MWP from before and during stimulation, they were able
1
Medical Devices and Neuromodulation, Battelle Memorial Institute, 505 King Avenue, Columbus, Ohio 43201, USA. 2
Center for Neuromodulation, The Ohio State University, Columbus,
Ohio 43210, USA. 3
Department of Neurological Surgery, The Ohio State University, Columbus, Ohio 43210, USA. 4
Department of Physical Medicine and Rehabilitation, The Ohio State University,
Columbus, Ohio 43210, USA. 5
Advanced Analytics and Health Research, Battelle Memorial Institute, 505 King Avenue, Columbus, Ohio 43201, USA. 6
Department of Psychology, The Ohio State
University, Columbus, Ohio 43210, USA. 7
Energy Systems, Battelle Memorial Institute, 505 King Avenue, Columbus, Ohio 43201, USA. †Present address: Feinstein Institute for Medical Research,
350 Community Drive, Manhasset, New York 11030, USA.
© 2016 Macmillan Publishers Limited. All rights reserved
2 | N A T U R E | V O L 0 0 0 | 0 0 M O N T H 2 0 1 6
LETTERRESEARCH
Time (s)
Trial
0
5
10
15
20 –2
0
2
Meanwavelet
power
–1
0
1
e
0
Firingrate
(spikess–1)
0
80
60
40
20
100
Trial
WF
5
10
15
20
WE WR WUd
Time (ms)
Voltage(μV)
Channel 37, unit 1
200
0
200
400
cb
Arm movement
Overlap
Array
a
1 2 3 4
0 1.5
Figure 1 | Experimental setup and neural modulation. a, Red regions
are brain areas active during attempts to mimic hand movements, where
the t-values for the move-rest T1-weighted fMRI contrast are greater
than 7; The implanted microelectrode array location from post-operation
computed tomography is shown in green; The overlap of the red and green
regions is shown in yellow. b, Neuromuscular electrical stimulation sleeve.
c, NBS in use with the participant in front a computer monitor.
d, Examples of rasters and peristimulus histograms from one discriminated
unit (channel 37 unit 1) with response to attempted wrist movements. The
participant was presented with cues to attempt wrist flexion (WF), wrist
extension (WE), wrist radial deviation (WR), and wrist ulnar deviation
(WU). Each cue was presented for a random duration of 3–4 s followed
by a random 3–4 s rest period. We presented 20 trials of each in random
order. The top part of each subpanel is a raster, each dot represents a
spike, and each row of spikes represents data from one trial. All trials were
aligned on cue presentation (time zero, red dashed line). At the right of
the panel is an example of 500 randomly selected waveforms from the
discriminated unit (blue) from channel 37 that responded to wrist, elbow,
and shoulder movements. The thick yellow line represents the average
waveform for this unit which showed increased firing rate for imagined
wrist flexion and wrist ulnar deviation (as well as elbow and shoulder
movements, see Extended Data Fig. 1). Because the participant was
asked to imagine and hold the movement throughout the cue period, the
increase of activity during the rest cue is probably due to the participant
imagining the antagonist movement to return to a neutral position.
e, Wavelet-processed neural data from channel 37 corresponding to the
same movements in d. The bottom part of each subpanel shows the mean
wavelet coefficients for each movement and each trial over time. Each row
represent data from a trial. The top part shows the MWP averaged over
the trials in dark red with a confidence interval of 1 s.d. around the mean
shown in light pink. The trials were centred on cue presentation (black
dashed line). (Photographs by A. Morgan and T. R. Massey.)
Wrist flexion Wrist extension Hand open Thumb flexion Thumb extension
Middle flexion Neural decoder Video classifier
0.2
–0.2
–0.4
–0.6
–0.8
–1
–1.2
–3
–2
–1
0
1
2
3
0
MWP(beforestimulation)
MWP(afterstartofstimulation)
155 156 157 158 159 160
Hand open
Cue stopCue
start
143 144 145 146 147
Thumb flexion
Time (s)
Cue stopCue
start
e
132 133 134 135 136
Middle flexion
Cue stopCue
start
d
Decoderoutputchannel
80 81 82 83 84 85
Wrist extension
Cue stopCue
start
c
69 70 71 72 73
Wrist flexion
b
Cue stopCue
start
52
0
0.5
1
1
96
0
0.5
1
1
96
53 54 55 56 57
Thumb extension
Cue stopCue
start
Stimulation
starts
Decoderoutputchannel
a
f
Figure 2 | MWP and system performance for individual hand
movements. a–f, Heat maps of MWP representing processed signals from
the microelectrode array, neural decoder output scores (dashed line),
and physical hand movements (solid line) as detected by a computer-based
video classification algorithm for each movement type: thumb extension
(a), wrist flexion (b), wrist extension (c), middle flexion (d), thumb flexion
(e), and hand open (f). Of the six simultaneously running decoders, the
output score from the one with the highest amplitude greater than zero
was used to turn on/off the stimulation. The vertical white line marks
when the decoder crosses zero and the stimulation is turned on. MWP
increases (by a factor of 2–8) during stimulation because of residual
stimulation artefact (see Methods). The MWP plot is split into two areas
with two different colour scales to facilitate visualization of MWP before
and during stimulation. Trial data shown range from 0.5 s before the cue
to 2.5 s after the cue ended. A 1 s wide boxcar filter is applied to the MWP
data causing a delay of ~0.5 s. Each subfigure represents one trial out of
the total five trials for each individual hand movement and the time scale
on the x axis shows the absolute time when the particular movement
occurred during the test block. The MWP is in units of standard deviations
away from a baseline non-movement period. Only decoder outputs greater
than zero are shown for visual clarity.
© 2016 Macmillan Publishers Limited. All rights reserved
0 0 M O N T H 2 0 1 6 | V O L 0 0 0 | N A T U R E | 3
LETTER RESEARCH
to recognize the correct imagined movement to initiate stimulation
and the participant’s desire to sustain and subsequently terminate the
target movement (see Supplementary Video 2 showing the participant
attempting the six movements using NBS). Accuracy (percentage of
video frames where observed movement matches the cue), sensitiv-
ity (percentage of video frames during cued movement where correct
movement was observed), and specificity (percentage of video frames
correctly identified during rest or non-target movement cues) for the
trained movements were measured by computer-based evaluation of
video frames of hand movements (see Methods and Extended Data
Fig. 3a). Using the system, the participant achieved an overall accu-
racy of 70.4 ± 1.0% (mean ± s.d., P < 0.01 by permutation test16
).
His accuracy for performing individual movements ranged from
93.1 ± 0.5% for wrist flexion (P < 0.01) to 97.3 ± 0.3% for thumb
flexion (P < 0.01). Sensitivity ranged between 32.9 ± 3.8% for thumb
extension and 81.9 ± 2.6% for wrist extension, and specificity ranged
between 94.8 ± 0.5% for wrist flexion and 99.8 ± 1.0% for thumb flex-
ion (Extended Data Fig. 3b). The participant was able to perform sim-
ilar basic movement tasks with text or verbal cues as well, suggesting
the mirror neuron system is not required for these tasks.
To characterize the recovery of upper limb function when using
the NBS, a physiatrist performed assessments of upper limb senso-
rimotor function using the Graded and Redefined Assessment of
Strength, Sensibility, and Prehension (GRASSP) test17
. The GRASSP
is a standardized test with excellent inter-rater and test–retest reliability
developed to assess sensorimotor impairment of patients with cervical
SCI across the following domains of the Manual Muscle Test (MMT):
strength, dorsal sensation, ventral sensation, gross grasping ability
(qualitative prehension), and prehensile skills (quantitative prehen-
sion). All five GRASSP domains were assessed without use of NBS to
generate a baseline score. As only motor, and not sensory, function was
expected to change with use of the NBS, MMT, gross grasping ability,
and prehensile skills subtests were repeated using the system. The NMES
was calibrated to map electrode stimulation patterns to desired evoked
movement patterns using an anatomically guided trial-and-error
approach and a new decoder was trained for each individual task, rather
than one for all tasks (see Methods). Figure 3 shows that when the par-
ticipant used the NBS, his MMT strength improved from C6 to C7–C8
level, his gross grasping ability improved from C7–C8 to C8–T1 level,
and his prehensile skills improved from C5 to C6 level. These findings
quantify the reduction in functional motor impairments possible with
NBS for patients with cervical SCI. Fatigue was sometimes observed
after multiple repetitions of sustained (3–4 s) stimulation.
To investigate the effectiveness of the NBS in assisting with daily
activities relevant to daily life, we asked the participant to perform a
complex functional movement that he was unable to complete without
the system. The task required him to grasp a bottle with a cylindrical
grasp, maintain the grasp while pouring its contents into a jar, open
his hand to release the bottle, and use a precision pinch to pick up and
hold a stir stick to stir the jar’s contents (Fig. 4 and Supplementary
Video 3). During the task, the participant used his residual shoulder
and elbow movements to guide his hand in space while he performed
the task; however, this presented a significant challenge in initial test-
ing. The participant had difficulty in maintaining his grasp of the
objects, particularly during transfer, and often dropped them. We
observed differences in the MWP associated with imagined grasping,
T1A
C8A
C7A
C6A
System off
System on
Strength (MMT)
Qualitative
prehension
Quantitative
prehension
20%
40%
60%
80%
100%
0%
Figure 3 | GRASSP clinical assessment. GRASSP performance on each
domain was scored by percentage of possible points earned, and normed to
benchmarks of the International Standards for Neurological Classification
of Spinal Cord Injury and the American Spinal Injury Association
Impairment Scale (greyscale regions in graph). The participant’s baseline
score (red), obtained 8 months after implantation, falls within the C5–C6
norms for strength on MMT and quantitative prehension (gross grasping
ability) and between C7–C8 for qualitative prehension (prehensile skills).
Using the NBS (green), between 8 and 9 months after implantation, his
motor function improved in all areas tested, with strength nearly achieving
C8–T1 level function, qualitative prehension similarly improving to
between C8–T1 level, and quantitative prehension improving to C6 level.
Qualitative prehension was limited by lack of stimulation electrodes
to facilitate thumb opposition. MMT strength was limited by lack of
stimulation electrodes over elbow extensors and hand intrinsics.
cba
fed
Figure 4 | Grasp-pour-and-stir functional movement task.
a–f, Sequential snapshots from the functional movement task showing the
participant opening his hand (a), grasping the glass bottle (b), pouring
its contents (dice) into a jar (c), grasping a stir stick from another jar (d),
transferring the stir stick without dropping it (e), and using it to stir the
dice in the jar (f). The task required the participant to evoke different
cortical modulation patterns to control the opening of his hand, perform
a cylindrical palmar grasp, and achieve a precision pinch grasp, while
simultaneously moving his arm. (Video by C. Majstorovic.)
© 2016 Macmillan Publishers Limited. All rights reserved
4 | N A T U R E | V O L 0 0 0 | 0 0 M O N T H 2 0 1 6
LETTERRESEARCH
stimulation-induced grasping, and grasp-and-transfer movements
(Extended Data Fig. 4). To improve the decoding performance during
these complex tasks, the MWP data from all three of these periods
were used to train a nonlinear support vector machine (see Methods).
Using this approach, the participant was able to successfully complete
the grasp-pour-and-stir task three out of five times in 10 min with a
completion time of 42 ± 10 s (mean ± s.d.) for successful trials, demon-
strating that he was able to utilize the NBS for a functional activity that
he could not perform otherwise (see Supplementary Video 4 showing
the participant attempting the task without the use of NBS).
In this study, for the first time, a human with quadriplegia regained
volitional, functional movement through the use of intracortically
recorded signals linked to neuromuscular stimulation in real-time.
With use of the investigational system, our C5/C6 participant gained
wrist and hand function consistent with a C7–T1 level of injury. This
improvement in function is meaningful for reducing the burden of care
in patients with SCI as most C5 and C6 patients require assistance for
activities of daily living, while C7–T1 level patients can live more
independently. Although invasive, the NBS provides an advantage
over existing functional electrical stimulation systems that utilize low
dimensional control signals such as EEG or EMG like the Freehand
system18–20
. These devices typically allow control over fewer move-
ments than those demonstrated in this study, because of the relatively
low information content of their control signal sources compared with
intracortically recorded signals.
Complexfunctionalmovementsthatinvolvebothstimulation-induced
and residual movements, such as those at the shoulder and elbow, pre-
sented an important challenge in this study. Residual limb movement
can activate motor cortical neurons21
and some motor cortical neurons
respond to movement from several joints22
. This may explain the neural
activity differences observed and the difficulties initially encountered
as the patient attempted movements involving paralysed and non-
paralysed joint movement simultaneously. The nonlinear algorithm
presented here is one possible solution to this problem. To allow transfer
of this work to other patients, further improvements will be required
on the microelectrode technology, algorithms, and NMES. However,
theelectronicneuralbypasspresentedheredemonstrateswhatispossible
in the future and can offer hope for movement restoration to people
living with paralysis worldwide.
Online Content Methods, along with any additional Extended Data display items and
Source Data, are available in the online version of the paper; references unique to
these sections appear only in the online paper.
Received 19 August 2015; accepted 15 February 2016.
Published online 13 April 2016.
1.	 Aflalo, T. et al. Decoding motor imagery from the posterior parietal cortex of a
tetraplegic human. Science 348, 906–910 (2015).
2.	 Bansal, A. K., Truccolo, W., Vargas-Irwin, C. E. & Donoghue, J. P. Decoding 3D
reach and grasp from hybrid signals in motor and premotor cortices: spikes,
multiunit activity, and local field potentials. J. Neurophysiol. 107, 1337–1355
(2012).
3.	 Chapin, J. K., Moxon, K. A., Markowitz, R. S. & Nicolelis, M. A. Real-time control
of a robot arm using simultaneously recorded neurons in the motor cortex.
Nature Neurosci. 2, 664–670 (1999).
4.	 Hochberg, L. R. et al. Reach and grasp by people with tetraplegia using a
neurally controlled robotic arm. Nature 485, 372–375 (2012).
5.	 Hochberg, L. R. et al. Neuronal ensemble control of prosthetic devices by
a human with tetraplegia. Nature 442, 164–171 (2006).
6.	 Kennedy, P. R. & Bakay, R. A. Restoration of neural output from a paralyzed
patient by a direct brain connection. Neuroreport 9, 1707–1711 (1998).
7.	 Santhanam, G., Ryu, S. I., Yu, B. M., Afshar, A. & Shenoy, K. V. A high-
performance brain-computer interface. Nature 442, 195–198 (2006).
8.	 Serruya, M. D., Hatsopoulos, N. G., Paninski, L., Fellows, M. R. & Donoghue,
J. P. Instant neural control of a movement signal. Nature 416, 141–142
(2002).
9.	 Taylor, D. M., Tillery, S. I. & Schwartz, A. B. Direct cortical control of 3D
neuroprosthetic devices. Science 296, 1829–1832 (2002).
10.	 Velliste, M., Perel, S., Spalding, M. C., Whitford, A. S. & Schwartz, A. B. Cortical
control of a prosthetic arm for self-feeding. Nature 453, 1098–1101
(2008).
11.	 Wessberg, J. et al. Real-time prediction of hand trajectory by ensembles of
cortical neurons in primates. Nature 408, 361–365 (2000).
12.	 Ethier, C., Oby, E. R., Bauman, M. J. & Miller, L. E. Restoration of grasp following
paralysis through brain-controlled stimulation of muscles. Nature 485,
368–371 (2012).
13.	 Moritz, C. T., Perlmutter, S. I. & Fetz, E. E. Direct control of paralysed muscles by
cortical neurons. Nature 456, 639–642 (2008).
14.	 Yousry, T. A. et al. Localization of the motor hand area to a knob on the
precentral gyrus. A new landmark. Brain 120, 141–157 (1997).
15.	 Humber, C., Ito, K. & Bouton, C. Nonsmooth formulation of the support vector
machine for a neural decoding problem. arXiv Preprint at http://arxiv.org/
abs/1012.0958v1 (2010).
16.	 Ojala, M. & Garriga, G. Permutation tests for studying classifier performance.
J. Mach. Learn. Res. 11, 1833–1863 (2010).
17.	 Kalsi-Ryan, S., Curt, A., Verrier, M. C. & Fehlings, M. G. Development of the
Graded Redefined Assessment of Strength, Sensibility and Prehension
(GRASSP): reviewing measurement specific to the upper limb in tetraplegia.
J. Neurosurg. Spine 17, 65–76 (2012).
18.	 Kilgore, K. L. et al. An implanted upper-extremity neuroprosthesis using
myoelectric control. J. Hand Surg. Am. 33, 539–550 (2008).
19.	 Peckham, P. H. et al. An advanced neuroprosthesis for restoration of hand and
upper arm control using an implantable controller. J. Hand Surg. Am. 27,
265–276 (2002).
20.	 Pfurtscheller, G., Muller, G. R., Pfurtscheller, J., Gerner, H. J. & Rupp, R.
‘Thought’–control of functional electrical stimulation to restore hand grasp in a
patient with tetraplegia. Neurosci. Lett. 351, 33–36 (2003).
21.	 Shaikhouni, A., Donoghue, J. P. & Hochberg, L. R. Somatosensory responses in
a human motor cortex. J. Neurophysiol. 109, 2192–2204 (2013).
22.	 Fetz, E. E., Finocchio, D. V., Baker, M. A. & Soso, M. J. Sensory and motor
responses of precentral cortex cells during comparable passive and active joint
movements. J. Neurophysiol. 43, 1070–1089 (1980).
Supplementary Information is available in the online version of the paper.
Acknowledgements We thank the study participant for his dedication and his
family for their support. We also thank the development team and management
at Battelle Memorial Institute for their support, the surgical support team,
C. Majstorovic for assistance with data analysis and equipment during
sessions, S. Preston for stereo camera coding and troubleshooting, the clinical
study support staff, W. Pease for performing the electromyogram and nerve
conduction studies, and M. Zhang for assistance with figure preparation.
Financial support for this study came from Battelle Memorial Institute and The
Ohio State University Center for Neuromodulation.
Author Contributions C.E.B., N.V.A., D.A.F., G.S., B.C.G., M.A.B., A.S., A.G.M.,
D.M.N., P.B.S., W.J.M., and A.R.R. conceived and designed the experiments and
fMRI procedure. N.V.A., D.A.F., G.S., B.C.G., M.A.B., and A.G.M. performed the
experiments. W.J.M. and M.A.B. were involved in participant recruitment.
A.R.R., M.D., and A.S. performed the surgery. All authors contributed to writing
the paper.
Author Information Reprints and permissions information is available at
www.nature.com/reprints. The authors declare competing financial interests:
details are available in the online version of the paper. Readers are welcome to
comment on the online version of the paper. Correspondence and requests for
materials should be addressed to C.E.B. (boutonce@gmail.com or
cbouton@northwell.edu) or G.S. (sharmag@battelle.org).
© 2016 Macmillan Publishers Limited. All rights reserved
LETTER RESEARCH
METHODS
No statistical methods were used to predetermine sample size. Cues within an
experiment were randomized, but experiments themselves were not randomized.
The investigators were not blinded to allocation during experiments and outcome
assessment.
Approval for this study was obtained from the US Food and Drug Administration
(Investigational Device Exemption) and The Ohio State University Medical Center
Institutional Review Board (Columbus, Ohio). The study met institutional require-
ments for the conduct of human subjects and was registered on the http://www.
ClinicalTrials.gov website (identifier NCT01997125). The participant referenced
in this work provided permission for photographs and videos and completed an
informed consent process before commencement of the study.
Study participant and surgical procedure. The study participant had complete,
non-spastic quadriplegia subsequent to traumatic cervical spine injury sustained
4 years previously while diving. He had full bilateral elbow flexion (grade 5/5),
active wrist extension with radial deviation through an incomplete range of motion
against gravity (grade 2/5), but no motor function below the level of C6. His sen-
sory level was C5 on the right (because of altered but present light touch on his
thumb) and C6 on the left. He had intact proprioception in the right upper limb
at the shoulder for internal rotation through external rotation, at the elbow for
flexion through extension, at the forearm for pronation through supination, and
at the wrist for flexion through extension. Proprioception for right digit flexion
through extension at the metacarpal-phalangeal joints was impaired for all digits.
His injury was complete, with an overall neurological level of C5 American Spinal
Injury Association Impairment Scale A with zone of partial preservation for motor
function to C6 bilaterally according to the International Standards for Neurological
Classification of Spinal Cord Injury23
. Electromyogram with nerve conduction
studies were performed by a board certified electromyographer to further pheno-
type the patient’s motor impairments, documenting presence of voluntary motor
units in the right deltoid (C56), biceps (C56), and extensor carpi radialis (C67), but
absence of motor units in triceps (C678), pronator teres (C67), extensor digitorum
(C78), extensor indicis (C78), flexor policis longus (C78), abductor policis brevis
(C8–T1), and first dorsal interosseus (C8–T1) muscles.
The patient underwent a left frontoparietal craniotomy. The hand area of motor
cortex was identified preoperatively by fusing fMRI activation maps obtained while
the patient attempted movements co-registered to the preoperative planning MRI.
An intraoperative navigation system was used to plan the craniotomy. The microe-
lectrode array was then implanted into the cortex using a pneumatic inserter. The
pedestal was tunnelled under the skin to a posterior exit point. Reference wires
were placed subdurally according to the manufacturer’s guidelines.
fMRI acquisition. A 3 T MRI system (Philips Achieva) equipped with an
eight-channel head coil was used to collect ten runs of functional images with a
blipped single-shot gradient-echo EPI imaging sequence with a spatial resolution of
2.2 mm × 2.2 mm × 2.3 mm. The acquisition parameters were repetition time/echo
time (TR/TE) 2,000/30 ms, 80° flip angle, 104 × 75 matrix size, 230 mm × 168 mm
field of view, 27 slices, and echo train of 75 ms. The number of dynamic acquisi-
tions was 165 and each run took 5.5 min. The field of view of the functional scans
did not cover the whole brain, but did cover the superior motor strip bilaterally.
A high-resolution T1-weighted image was also acquired with the following param-
eters: TR/TE 7.7/3.5 ms, 1 mm × 1 mm × 1 mm voxel resolution, three-dimensional
acquisition with 144 slices.
We asked the participant to visualize movements of his right hand while we
collected fMRI. We collected ten blocks, each with ten trials. Each trial consisted
of a fixation cross displayed for 1.4 s, followed by a 5 s video depicting a movement
beginning after a 0.1 s delay. Each movement video was repeated three times with
a 1.5 s interval between repetitions. The orientation cross for the next set of videos
was displayed after a jittered inter-trial interval of between 8 and 12 s, as well as
two sets of three repetitions of 5 s videos depicting a right hand at rest. Each video
began with a right hand in the resting position of his right hand. The hand in the
video then executed a specific motion and held that movement before returning
to the rest position. The videos depicted the following eight movements: clenching
hand into a fist, wrist flexion, wrist pronation and supination, drumming fingers by
sequentially touching the palm with the fifth to second fingers, splaying all fingers
to maximum extension, flexing the first finger, flexing the second finger, flexing
the third finger; and finally resting in which the hand did not move.
To obtain the final results, we contrasted all of the movement conditions against
the rest condition and found that the areas with the highest activation were in the
left motor and sensory cortex. The location of the microelectrode array implanta-
tion overlapped with an area in the motor strip where activity in response to motor
visualization was observed.
FunctionalMRIprocessing.FunctionalMRIprocessingwasperformedusingAFNI24
and FSL25
. We dropped the first three volumes of each run, then removed spikes
with 3ddespike and regressed out cardiac and respiratory signals with 3dretroicor.
Next, we temporally shifted all of the slices in each volume to the start of the
volume’s collection using 3dTshift with Fourier interpolation and registered all
of the functional volumes to the third volume of the first run. We fitted a general
linear model restricted maximum likelihood with regressors for each of the visu-
alization movement types and regressors for motion and the derivative of motion.
The regressor for each visualization movement was a 5 s block convolved with a
haemodynamic response function starting at the onset of each video presentation.
Regressions were fitted with 3dDeconvolve and 3dREMLfit. To identify activity
related to motor visualization, we contrasted all of the movements versus the rest
condition and applied a threshold of a t value of 7, then dilated these results so that
they were visible on the cortical surface. We co-registered the functional images
with the T1-weighted anatomical image with FSL’s grey-matter/white-matter
boundary-based linear registration. Postoperative computed tomography images
were linearly registered with the same anatomical image using the FSL image
registration tool with a mutual information cost function and 6 degrees of freedom.
The overlap between microelectrode array location and fMRI results was visualized
with MRIcroGL (http://www.cabiatl.com/mricrogl/). Researchers were not blinded
during pre-processing or subsequent analyses.
System architecture. The Neuroport neural data acquisition system and the Utah
microelectrode array with 1.5 mm electrodes (Blackrock Microsystems) were used
to acquire the neural data. A 0.3 Hz first-order high-pass and a 7.5 kHz third-order
low-pass Butterworth analogue hardware filter were applied to the data, and each
of the 96 channels of the microelectrode array were sampled at a rate of 30,000
samples per second. The digitized data were then transmitted to a personal com-
puter where they were decoded to determine which motion was being imagined
and then encoded to evoke the desired response from the muscles in the forearm.
The computer communicated with the custom high-definition NMES that drove
the electrode sleeve wrapped around the forearm.
Signal processing. The signal processing and decoding/control algorithms were
all run on a personal computer using MATLAB (version 2012a). The digitized
data from the Neuroport was processed every 100 ms. Stimulation artefact in the
data was detected by looking for a threshold crossing at 500 μV that occurred
simultaneously on at least 4 of 12 randomly selected channels. A 2.5 ms window of
data around each detected artefact was then removed and adjacent data segments
were rejoined. This approach removed a large portion of the artefact, but stimu-
lation effects still remained. Residual artefact, caused by the Neuroport amplifiers
recovering from a brief period of saturation after each stimulation pulse, led to
increased signal amplitude during stimulation (see wavelet processing description
below). The decoders were trained with data from the period before and during
stimulation to accommodate this residual artefact and allow the user to initiate
and sustain the correct movement.
Wavelet decomposition was then applied to the data, using the ‘db4’ wavelet and
11 wavelet scales26
. Wavelet decomposition has been shown to be an effective tool
in neural decoding applications and provides information encompassing single
unit, multiunit, and LFP, without requiring spike sorting27
.
In this study four wavelet scales (3–6) were used, corresponding to the multiunit
frequency band spanning approximately 234–3,750 Hz. The mean of the wavelet
coefficients for each scale of each channel was calculated every 100 ms and a 1 s
wide boxcar filter was applied to smooth the data. Baseline drift in the data was
estimated by using a 15 s boxcar filter and was subtracted from the smoothed mean
wavelet coefficients for the corresponding 100 ms window. This drift may be due
to multiple causes including changes in concentration/focus level and has been
observed previously28
. The mean coefficients of scales 3–6 were then standard-
ized per channel, per scale, by subtracting the mean and dividing by the standard
deviation of those scales and channels during the training blocks. The four scales
were then combined by averaging the standardized coefficients for each channel,
resulting in 96 values for every 100 ms of data. When present, residual artefact in
a portion of this 100 ms segment can cause a local increase in wavelet coefficients
leading to a twofold to eightfold increase in the reported mean for the segment. The
resulting values were then used as features, termed mean wavelet power (MWP),
as input into the decoders. Example decoder output scores are shown in Extended
Data Fig. 5.
To look at MWP signal quality over the study period, data for all channels were
collected over 60 s at the beginning of each test session where the participant was
instructed to close his eyes and rest. MWP features with no mean subtraction were
calculated to approximate the power in the multiunit frequency bands. After an
initial decline, the MWP stabilized after 150 days after implantation (Extended
Data Fig. 6).
Stimulation. The participant received intermittent stimulation during sessions
(with a maximum of three sessions per week, typically lasting 3–4 h including setup
time). The continuous, variable output score of each decoder was used to drive
the stimulation level during all tasks. Stimulation hydrogel material (Axelgaard)
cut into disks, 12 mm in diameter, were applied to the stimulation electrodes. The
© 2016 Macmillan Publishers Limited. All rights reserved
LETTERRESEARCH
centre-to-centre spacing of the electrodes was 22 mm along the long axis of the
forearm and 15 mm in the transverse direction. Electrical stimulation was pro-
vided intermittently in the form of current-controlled, monophasic (biphasic
recommended for long-term, continuous use) rectangular pulses of a 50 Hz pulse
rate and 500 μs pulse width. Pulse amplitudes ranged from 0 to 20 mA and were
updated every 100 ms.
For each motion, the stimulation intensity and spatial pattern were determined
by using a trial-and-error method. The output score of a given decoder was in the
−1 to 1 range and when exceeding zero, the system enabled stimulation for that
movement. If the output scores of multiple decoders exceeded zero simultaneously,
then the system enabled the movement with the highest decoder score. If ‘graded
stimulation intensity’ was not being used, then the stimulator would use the full
(calibrated) stimulation intensity for the desired motion.
In some cases, graded stimulation intensity was used, which required three
stimulation intensity levels to be captured. The stimulation intensity levels were
set so that they produced a low, medium, and high amount of joint deflection
(visually determined by the operator). The decoder output score, r, was then used
to set the stimulation intensity level, f(r), during real-time decoding. A piecewise
linear function was used to interpolate between the three calibrated stimulation
intensities as follows:
( ) =





≤ /
( − )/ . + < ≤ .
( − )/ . + − . < ≤ .
> .
f r
r
r m l l r
r h m m h r
h r
0, 0
0 2 , 0 0 2
0 2 2 , 0 2 0 4
, 0 4
where l, m, and h, correspond to the three stimulation intensities. The thresholds of
0.2 and 0.4 were derived empirically and were used to compensate for the nonlinear
response of the muscles to surface stimulation.
Stimulation spatial patterns and intensity levels were saved in a database. In sub-
sequent sessions with the participant, the previous calibrations could be recalled.
See Supplementary Table 1 for electrode labels and total number of stimulation
electrodes used to evoke each movement during the individual movement task
and Extended Data Fig. 7 for a representative stimulation pattern used to evoke
‘hand open’ movement.
Task methods and algorithm training. The decoders were trained in blocks, each
consisting of repetitions of desired motions with short rest periods between. The
participant was cued by a small graphical hand displayed on a monitor. After each
block, the decoders were adapted (created or updated) using data from the most
recent three blocks. During the first block (before a decoder had been built), the
system provided ‘scripted’ stimulation (stimulation corresponding to the cue) while
the participant imagined/attempted the cued movements. After the first block, a
decoder was built and the study participant received real-time, cortically controlled
stimulation. Every 100 ms, the system updated the stimulation with the electrode
pattern for the motion with the highest decoder output score. For a short amount
of time during each cue, referred to as ‘no-feedback time,’ no stimulation was given
which provided training data from both the period before motion and during
stimulation/motion. For tasks that included residual shoulder and elbow move-
ment, longer movement cues were used to also capture training data for the grasp
alone and subsequently the grasp with arm movement in space. This training data
(cues and MWP features) were used to train a nonlinear support vector machine
algorithm, resulting in more robust decoders. A decoder for each motion (against
all other motions/rest) was built using a nonlinear Gaussian radial basis function
kernel29
to process the features. The processed features were then input into a
non-smooth support vector machine algorithm that used sparsity optimization
to improve decoder accuracy by zeroing out the least valuable MWP features15
.
During decoding, all decoders ran simultaneously and the decoder with the highest
output score above zero was used to drive the stimulator.
Individual movement task. During the individual movement task training, the
participant was cued by the graphical hand for all six wrist and finger motions. The
decoders were trained in seven successive blocks, each consisting of three trials
of each movement. Each cue lasted 2.5 s and was always followed by a rest period
of random length (2.5–4.0 s); the movement cues were randomly shuffled. The
‘no-feedback time’ was set to 1.2 s in the first block and 0.8 s in subsequent blocks.
The test portion of the ‘individual movement task’ used the same cueing param-
eters as during training, except each movement cue was repeated five times and
the ‘no-feedback time’ was disabled. For this task, graded stimulation intensity was
not used. Overall accuracy for the neural decoder was calculated by the fraction of
100 ms segments where the neural decoder agreed with the cue.
To quantify finger and hand movements in the individual movement task,
coloured finger cots (coverings) were placed on the participant’s fingers. For detect-
ing movements involving the wrist, an additional cot was placed on a plastic cylin-
der extending out past the participant’s thumb. A Bumblebee2 stereo camera was
positioned above the participant’s hand to track movement in three dimensions.
The colour of the cots was used to identify individual fingers and locate them in
three-dimensional space using a combination of custom code and OpenCV30
. The
location of the fingers was then fed into the same decoding algorithm used for
neural decoding to determine the position of the hand, termed the video classifier.
This classifier was trained using video data collected at 12 frames per second using
scripted stimulation for the moves of interest. As previously described, accuracy,
sensitivity, and specificity were computed. A permutation test was performed by
comparing the observed data to data with shuffled labels16
. To account for reaction
and system lag time, the video decoder data were shifted by 1.2 s.
GRASSP assessment. Independent decoders were trained separately for each
GRASSP test that required stimulation. During the GRASSP training, the par-
ticipant was cued by the graphical hand for the motion needed for that particular
task. The duration of the cue and rest periods were randomly selected from a
uniform distribution across the ranges specified in Supplementary Table 2, which
also specified the number of repetitions of each cue. Each cue was always followed
by a rest period. The ‘no-feedback time’ was set to 0.8 s for all blocks. The test
portion of the task used the same cueing parameters as those used during training,
except each movement cue was repeated five times and the ‘no-feedback time’
was disabled. The GRASSP tests were conducted without any cues. Since decoder
sets were trained for each individual GRASSP test (versus training one decoder
set for all tests), the user could not switch between GRASSP tests at will without
reloading or training the appropriate decoders. Some GRASSP tests required two
movements to be trained for one test to open the hand around the object and then
grip the object. In some GRASSP tests, graded stimulation intensity was used to
make the gripping action smoother.
Functional movement task. While performing training for the functional move-
ment task, the participant was cued by the graphical hand for all three of the
motions requiring stimulation. Each cue lasted 5.5 s and was always followed by a
5 s rest period. Each movement cue was repeated four times. The movement cues
were sequenced so that the participant could perform the complete functional
movement task during training. The ‘no-feedback time’ was set to 1.2 s in the first
block and 0.8 s in subsequent blocks. For the hand open and bottle grip movements,
the stimulation intensity was not graded; however, graded stimulation intensity
was used for the stir bar grip to enable a smooth grasp.
The test portion of the functional movement task was conducted without any
cues. The participant was verbally instructed when to start upon which a timer
was initiated. To be considered a successful trial, the participant had to grip the
bottle, pour at least ten dice into the jar, set the bottle down, pick up a stir stick with
a pinch grasp, stir the contents with at least two (circular) stirs, and leave the stir
stick in the jar (at which time the timer was stopped). No objects could be dropped
or knocked over during the task and the trial had to be completed within 60 s. He
was given a total of 10 min to complete as many trials as possible (with a mandatory
60 s rest period between each trial). Sixty seconds of rest was chosen to give the
researcher time to reset the props of the task and to give the participant time to rest
physically and mentally. Because of his injury, the participant had limited ability
to lift his arm, and repetitive tasks such as this requiring him to do so could cause
his shoulder to fatigue and become uncomfortable.
23.	 Kirshblum, S. C. et al. International Standards for Neurological Classification of
Spinal Cord Injury: cases with classification challenges. J. Spinal Cord Med.
37, 120–127 (2014).
24.	 Cox, R. W. AFNI: software for analysis and visualization of functional magnetic
resonance neuroimages. Comput. Biomed. Res. 29, 162–173 (1996).
25.	 Smith, S. M. et al. Advances in functional and structural MR image analysis
and implementation as FSL. Neuroimage 23 (Suppl. 1), S208–S219
(2004).
26.	 Mallat, S. A Wavelet Tour of Signal Processing (Academic, 1998).
27.	 Sharma, G. et al. Time stability of multi-unit, single-unit and LFP neuronal
signals in chronically implanted brain electrodes. Bioelectron. Med. 2,
63–71 (2015).
28.	 Kennedy, P. Changes in emotional state modulate neuronal firing rates of
human speech motor cortex: a case study in long-term recording. Neurocase
17, 381–393 (2011).
29.	 Scholkopf, B. et al. Comparing support vector machines with Gaussian kernels
to radial basis function classifiers. IEEE Trans. Signal Process. 45, 2758–2765
(1997).
30.	 Bradski, G. The OpenCV library. Doctor Dobbs J. 25, 120–126 (2000).
© 2016 Macmillan Publishers Limited. All rights reserved
LETTER RESEARCH
Extended Data Figure 1 | Neural modulation. a, b, Examples of rasters
and peristimulus histograms from simultaneously recorded units
with response to attempted or performed wrist, elbow, and shoulder
movements are shown in (a) for channel 68, unit 1 and in (b) for channel
37, unit 1. The participant was presented with cues to attempt wrist flexion
(WF), wrist extension (WE), wrist radial deviation (WR), wrist ulnar
deviation (WU), elbow extension (EE), or to perform elbow flexion (EF),
shoulder flexion (SF), or shoulder abduction (SA). Each cue was presented
for a duration of 3 s with a random jitter of 0–2 s followed by a 3 s period
with a jitter of 0–2 s. We presented 20 trials of each in random order. The
top part of each subpanel is a raster, the black dots represent spikes, each
row of spikes represents data from one trial. All trials were aligned on cue
presentation (time zero, red dashed line). On the right of each set of panels
is an example of 500 randomly selected waveforms from the discriminated
unit (blue). The thick yellow line represents the average waveform for
the unit. The top panel shows unit 1 on channel 68. This unit responded
well to movement around the shoulder and elbow. The bottom panel
shows activity from unit 1 on channel 37 that responded to wrist, elbow,
and shoulder movements. Because the participant was asked to imagine
and hold the movement throughout the cue period, the latent increase of
activity after the cue ended (during the rest period) was probably due to
the participant imagining the antagonist movement to return to a neutral
position.
© 2016 Macmillan Publishers Limited. All rights reserved
LETTERRESEARCH
Extended Data Figure 2 | Stimulation artefact removal. Stimulation
artefact was removed from the signal associated with each electrode before
further processing (see Methods). a, Example of the voltage data during
stimulation for a single electrode shows a period before stimulation and
a period during stimulation containing three stimulation artefacts (large
amplitude pulses). b, Large artefacts were detected and removed to reduce
their effects; however, residual artefacts could remain (causing a twofold
to eightfold increase in MWP during stimulation). c, The period before
stimulation is shown for reference. d, The period with three stimulation
artefacts (after removal) is shown after concatenation/rejoining of the
signal segments, and wavelet decomposition is then performed on these
shorter, concatenated data (see Methods).
© 2016 Macmillan Publishers Limited. All rights reserved
LETTER RESEARCH
Extended Data Figure 3 | Individual movement task performance. The
participant was visually cued to attempt each of the six trained movements.
a, Snapshot of each movement. b, The performance (sensitivity, specificity,
and accuracy) was measured by automatic evaluation of video frames of
hand movements for each of the six moves. The overall accuracy of the
NBS was 70.4 ± 1.0% (P < 0.01). Statistics for individual movements are
calculated against a movement specific cue vector with two classes: one
class for the movement of interest and one class for all other moves plus
rest, which we refer to as the non-target class. Sensitivity is the percentage
of video frames during cued movement where the correct movement was
observed. It captures the ability of the participant to initiate the specific
movement in response to the cue and his ability to sustain the movement
for the duration of the two second cue. Specificity is the percentage of video
frames during non-target cues that were correctly identified. Accuracy is the
percentage of video frames where the observed hand position matched the
cue vector for that specific movement. It can also be calculated as a weighted
average of sensitivity and specificity, with the weights corresponding
to the relative frequency of the two classes. As such, the sensitivity and
specificity give additional performance information which can be especially
useful when the relative frequency of the classes is skewed towards one
class. Overall accuracy measures the performance of all six decoders
simultaneously by calculating the percentage of video frames where the
observed hand position matches the position the participant was asked
to achieve. Thus, errors on any of the six movements are incorporated in
the overall accuracy, so it is expected to be lower than the accuracy of any
individual movement. Error bars, ±2 s.d. (Video taken by D. Friedenberg.)
© 2016 Macmillan Publishers Limited. All rights reserved
LETTERRESEARCH
Extended Data Figure 4 | MWP during a combination movement
task. MWP as calculated by the NBS algorithm during a task combining
imagined movement, stimulation-induced movement, and non-paralysed
muscle movement is shown. The participant’s reaction time and a 1 s
boxcar filter used to smooth the neural data creates the delay observed
after the cues are presented. The participant’s hand was placed on top of
a spoon set on a table and he was cued by the graphical hand to imagine
gripping a spoon (solid black line), provided stimulation to evoke the
actual gripping of the spoon (red line), and cued by an audible beep to
transfer the spoon using the residual movement in his shoulder and elbow
(black dashed line). The spoon transfer distance was approximately 45 cm
to the left/right, alternating between each trial. Differences in MWP
can be seen for each of the three portions of each trial. The increase in
MWP between imagined movement and stimulation-induced movement
is caused by residual stimulation artefact. During the transfer cue, the
utilization of residual (shoulder) movement was associated with a different
and consistent MWP pattern, requiring the development of a more robust
decoding strategy which combined data from imagined, stimulation-
induced, and transfer movements for decoder training (see Methods).
© 2016 Macmillan Publishers Limited. All rights reserved
LETTER RESEARCH
Extended Data Figure 5 | Neural decoder outputs for each movement in
the individual movement task. The blue line represents the cue that the
participant was trying to match. For a particular movement, when the blue
line was at one, the user was prompted to imagine that movement. The
black line is the decoder output for that move. The decoded movement is
rest if none of the decoder outputs are above zero (dotted line); otherwise,
it is determined by the maximum of all the decoder outputs. Green
stars are placed above the 29 out of 30 cues in which the neural decoder
correctly matched the cue. In this plot the cues have been shifted by 0.8 s to
account for reaction and system lag time. Decoder output below −0.5 has
been set to −0.5 for visual clarity.
© 2016 Macmillan Publishers Limited. All rights reserved
LETTERRESEARCH
Extended Data Figure 6 | Evolution of MWP over time. At the beginning
of each test session, data for all channels were collected over 60 s where
the participant was instructed to close his eyes and rest. No stimulation
was provided during this period. MWP features with no mean subtraction
were calculated to approximate the power in the multiunit wavelet bands
corresponding to scales 3–6. After an initial decline the MWP stabilized
at 150 days after implantation. Dashed line represents a polynomial fit of
order 4.
© 2016 Macmillan Publishers Limited. All rights reserved
LETTER RESEARCH
Extended Data Figure 7 | Stimulation electrode pattern. The
stimulator was calibrated to evoke movements in the hand and wrist.
a, Representative map of the anode (red) and cathode (black) electrodes
in the lower (L) and upper (U) stimulation cuffs used to evoke the ‘hand
open’ movement during the individual movement task. b, Stimulation
cuffs on the participant’s arm, with the stimulation pattern highlighted.
See Supplementary Table 1 for a complete list of electrode patterns used for
the individual hand movement task. (Photographs taken by N. Annetta.)
© 2016 Macmillan Publishers Limited. All rights reserved

Contenu connexe

Tendances

Review on Feature Extraction and Classification of Neuromuscular Disorders
Review on Feature Extraction and Classification of Neuromuscular DisordersReview on Feature Extraction and Classification of Neuromuscular Disorders
Review on Feature Extraction and Classification of Neuromuscular DisordersIJMTST Journal
 
Seated Human Spine Response Prediction to Vertical Vibration via Artificial...
Seated Human Spine Response Prediction to Vertical Vibration via   Artificial...Seated Human Spine Response Prediction to Vertical Vibration via   Artificial...
Seated Human Spine Response Prediction to Vertical Vibration via Artificial...abdulaziznaser2012
 
International Journal on Cybernetics & Informatics (IJCI) Vol. 4, No. 2, Apr...
International Journal on Cybernetics & Informatics  (IJCI) Vol. 4, No. 2, Apr...International Journal on Cybernetics & Informatics  (IJCI) Vol. 4, No. 2, Apr...
International Journal on Cybernetics & Informatics (IJCI) Vol. 4, No. 2, Apr...IJCI JOURNAL
 
Electromyographic activity of selected trunk muscles in subjects
Electromyographic activity of selected trunk muscles in subjectsElectromyographic activity of selected trunk muscles in subjects
Electromyographic activity of selected trunk muscles in subjectsJuan Aguirre Vargas
 
Reduced Short- and Long-Latency Afferent Inhibition Following Acute Muscle Pa...
Reduced Short- and Long-Latency Afferent Inhibition Following Acute Muscle Pa...Reduced Short- and Long-Latency Afferent Inhibition Following Acute Muscle Pa...
Reduced Short- and Long-Latency Afferent Inhibition Following Acute Muscle Pa...Antonio Martinez
 
ZMPCZM017000.11.03 Carey Experimentation on brain research
ZMPCZM017000.11.03 Carey Experimentation on brain researchZMPCZM017000.11.03 Carey Experimentation on brain research
ZMPCZM017000.11.03 Carey Experimentation on brain researchPainezee Specialist
 
Hip muscle exercise JOSPT 2013
Hip muscle exercise  JOSPT 2013Hip muscle exercise  JOSPT 2013
Hip muscle exercise JOSPT 2013Victor Olivares
 
Bioimpedance harwareembc20
Bioimpedance harwareembc20Bioimpedance harwareembc20
Bioimpedance harwareembc20Hoopeer Hoopeer
 
Three Techniques, One System: How to Effectively Characterize Complete Muscle...
Three Techniques, One System: How to Effectively Characterize Complete Muscle...Three Techniques, One System: How to Effectively Characterize Complete Muscle...
Three Techniques, One System: How to Effectively Characterize Complete Muscle...InsideScientific
 
2004 anterior cruciate ligament assisi
2004 anterior cruciate ligament assisi2004 anterior cruciate ligament assisi
2004 anterior cruciate ligament assisiGUIDO MARIA FILIPPI
 
Exploring obesity and feeding behavior using functional MRI
Exploring obesity and feeding behavior using functional MRIExploring obesity and feeding behavior using functional MRI
Exploring obesity and feeding behavior using functional MRIHyung Jin Choi
 

Tendances (17)

LASERTHERAPY2013
LASERTHERAPY2013LASERTHERAPY2013
LASERTHERAPY2013
 
MEMEA2015
MEMEA2015MEMEA2015
MEMEA2015
 
Review on Feature Extraction and Classification of Neuromuscular Disorders
Review on Feature Extraction and Classification of Neuromuscular DisordersReview on Feature Extraction and Classification of Neuromuscular Disorders
Review on Feature Extraction and Classification of Neuromuscular Disorders
 
Seated Human Spine Response Prediction to Vertical Vibration via Artificial...
Seated Human Spine Response Prediction to Vertical Vibration via   Artificial...Seated Human Spine Response Prediction to Vertical Vibration via   Artificial...
Seated Human Spine Response Prediction to Vertical Vibration via Artificial...
 
International Journal on Cybernetics & Informatics (IJCI) Vol. 4, No. 2, Apr...
International Journal on Cybernetics & Informatics  (IJCI) Vol. 4, No. 2, Apr...International Journal on Cybernetics & Informatics  (IJCI) Vol. 4, No. 2, Apr...
International Journal on Cybernetics & Informatics (IJCI) Vol. 4, No. 2, Apr...
 
Pain in the neck - Bernard Martin
Pain in the neck - Bernard MartinPain in the neck - Bernard Martin
Pain in the neck - Bernard Martin
 
Kendell et al
Kendell et alKendell et al
Kendell et al
 
Electromyographic activity of selected trunk muscles in subjects
Electromyographic activity of selected trunk muscles in subjectsElectromyographic activity of selected trunk muscles in subjects
Electromyographic activity of selected trunk muscles in subjects
 
Reduced Short- and Long-Latency Afferent Inhibition Following Acute Muscle Pa...
Reduced Short- and Long-Latency Afferent Inhibition Following Acute Muscle Pa...Reduced Short- and Long-Latency Afferent Inhibition Following Acute Muscle Pa...
Reduced Short- and Long-Latency Afferent Inhibition Following Acute Muscle Pa...
 
Begovic et al.2016
Begovic et al.2016Begovic et al.2016
Begovic et al.2016
 
ZMPCZM017000.11.03 Carey Experimentation on brain research
ZMPCZM017000.11.03 Carey Experimentation on brain researchZMPCZM017000.11.03 Carey Experimentation on brain research
ZMPCZM017000.11.03 Carey Experimentation on brain research
 
bro_ER_140702_en
bro_ER_140702_enbro_ER_140702_en
bro_ER_140702_en
 
Hip muscle exercise JOSPT 2013
Hip muscle exercise  JOSPT 2013Hip muscle exercise  JOSPT 2013
Hip muscle exercise JOSPT 2013
 
Bioimpedance harwareembc20
Bioimpedance harwareembc20Bioimpedance harwareembc20
Bioimpedance harwareembc20
 
Three Techniques, One System: How to Effectively Characterize Complete Muscle...
Three Techniques, One System: How to Effectively Characterize Complete Muscle...Three Techniques, One System: How to Effectively Characterize Complete Muscle...
Three Techniques, One System: How to Effectively Characterize Complete Muscle...
 
2004 anterior cruciate ligament assisi
2004 anterior cruciate ligament assisi2004 anterior cruciate ligament assisi
2004 anterior cruciate ligament assisi
 
Exploring obesity and feeding behavior using functional MRI
Exploring obesity and feeding behavior using functional MRIExploring obesity and feeding behavior using functional MRI
Exploring obesity and feeding behavior using functional MRI
 

En vedette

Introduction to zc.buildout
Introduction to zc.buildoutIntroduction to zc.buildout
Introduction to zc.buildoutRicardo Newbery
 
ERPCX whitepaper virtual consulting 2011 1
ERPCX whitepaper virtual consulting 2011 1ERPCX whitepaper virtual consulting 2011 1
ERPCX whitepaper virtual consulting 2011 1Herbert Goertz
 
Final - dec. 11 hkl4 presentation (1)
Final - dec. 11 hkl4 presentation (1)Final - dec. 11 hkl4 presentation (1)
Final - dec. 11 hkl4 presentation (1)Hack the Hood
 
02 - Le Rôle des Grappes dans la Stratégie de Spécialisation Intelligente
02 - Le Rôle des Grappes dans la Stratégie de Spécialisation Intelligente02 - Le Rôle des Grappes dans la Stratégie de Spécialisation Intelligente
02 - Le Rôle des Grappes dans la Stratégie de Spécialisation IntelligenteMohamed Larbi BEN YOUNES
 
Final Embracing Your Own Power Talk
Final Embracing Your Own Power TalkFinal Embracing Your Own Power Talk
Final Embracing Your Own Power TalkHack the Hood
 
M Learning Presentation
M Learning PresentationM Learning Presentation
M Learning Presentationrboskett
 
JSP Tag Library
JSP Tag LibraryJSP Tag Library
JSP Tag Libraryjgiudici
 
Don't work with assholes -life lessons from my trip to spain
Don't work with assholes -life lessons from my trip to spainDon't work with assholes -life lessons from my trip to spain
Don't work with assholes -life lessons from my trip to spainHack the Hood
 
Status of accountability in online news media: A case of Nepal
Status of accountability in online news media: A case of NepalStatus of accountability in online news media: A case of Nepal
Status of accountability in online news media: A case of Nepalbbacharya
 
الجلسة التشاركية النهائية للبرنامج السنوي الإستثماري 2017 ‎
الجلسة التشاركية النهائية للبرنامج السنوي الإستثماري 2017 ‎الجلسة التشاركية النهائية للبرنامج السنوي الإستثماري 2017 ‎
الجلسة التشاركية النهائية للبرنامج السنوي الإستثماري 2017 ‎Mohamed Larbi BEN YOUNES
 
честита баба марта_
честита баба марта_честита баба марта_
честита баба марта_Rositsa Dimova
 
05 - Une combinaison de Politiques : Au-delà de la Science
05 - Une combinaison de Politiques : Au-delà de la Science 05 - Une combinaison de Politiques : Au-delà de la Science
05 - Une combinaison de Politiques : Au-delà de la Science Mohamed Larbi BEN YOUNES
 

En vedette (20)

Introduction to zc.buildout
Introduction to zc.buildoutIntroduction to zc.buildout
Introduction to zc.buildout
 
ERPCX whitepaper virtual consulting 2011 1
ERPCX whitepaper virtual consulting 2011 1ERPCX whitepaper virtual consulting 2011 1
ERPCX whitepaper virtual consulting 2011 1
 
Final - dec. 11 hkl4 presentation (1)
Final - dec. 11 hkl4 presentation (1)Final - dec. 11 hkl4 presentation (1)
Final - dec. 11 hkl4 presentation (1)
 
Results questionaires
Results questionairesResults questionaires
Results questionaires
 
Comic strip iii
Comic strip iiiComic strip iii
Comic strip iii
 
02 - Le Rôle des Grappes dans la Stratégie de Spécialisation Intelligente
02 - Le Rôle des Grappes dans la Stratégie de Spécialisation Intelligente02 - Le Rôle des Grappes dans la Stratégie de Spécialisation Intelligente
02 - Le Rôle des Grappes dans la Stratégie de Spécialisation Intelligente
 
Final Embracing Your Own Power Talk
Final Embracing Your Own Power TalkFinal Embracing Your Own Power Talk
Final Embracing Your Own Power Talk
 
M Learning Presentation
M Learning PresentationM Learning Presentation
M Learning Presentation
 
JSP Tag Library
JSP Tag LibraryJSP Tag Library
JSP Tag Library
 
Don't work with assholes -life lessons from my trip to spain
Don't work with assholes -life lessons from my trip to spainDon't work with assholes -life lessons from my trip to spain
Don't work with assholes -life lessons from my trip to spain
 
Water in use
Water in useWater in use
Water in use
 
Status of accountability in online news media: A case of Nepal
Status of accountability in online news media: A case of NepalStatus of accountability in online news media: A case of Nepal
Status of accountability in online news media: A case of Nepal
 
الجلسة التشاركية النهائية للبرنامج السنوي الإستثماري 2017 ‎
الجلسة التشاركية النهائية للبرنامج السنوي الإستثماري 2017 ‎الجلسة التشاركية النهائية للبرنامج السنوي الإستثماري 2017 ‎
الجلسة التشاركية النهائية للبرنامج السنوي الإستثماري 2017 ‎
 
Designcorpsinternet
DesigncorpsinternetDesigncorpsinternet
Designcorpsinternet
 
Do italia sas samolet
Do italia sas samoletDo italia sas samolet
Do italia sas samolet
 
Pdp
PdpPdp
Pdp
 
Inergy
InergyInergy
Inergy
 
честита баба марта_
честита баба марта_честита баба марта_
честита баба марта_
 
Final Arse Talk
Final Arse TalkFinal Arse Talk
Final Arse Talk
 
05 - Une combinaison de Politiques : Au-delà de la Science
05 - Une combinaison de Politiques : Au-delà de la Science 05 - Une combinaison de Politiques : Au-delà de la Science
05 - Une combinaison de Politiques : Au-delà de la Science
 

Similaire à nature17435

Neurally Driven Prosthetics
Neurally Driven ProstheticsNeurally Driven Prosthetics
Neurally Driven ProstheticsMarshall Benson
 
Improvement of a Bidirectional Brain-Computer Interface for Neural Engineerin...
Improvement of a Bidirectional Brain-Computer Interface for Neural Engineerin...Improvement of a Bidirectional Brain-Computer Interface for Neural Engineerin...
Improvement of a Bidirectional Brain-Computer Interface for Neural Engineerin...HayleyBoyd5
 
Neurobionics and robotic neurorehabilitations
Neurobionics and robotic neurorehabilitationsNeurobionics and robotic neurorehabilitations
Neurobionics and robotic neurorehabilitationsNeurologyKota
 
The Acute Effects Of Vibroacoustically-Induced Microvibrations On EEG Activit...
The Acute Effects Of Vibroacoustically-Induced Microvibrations On EEG Activit...The Acute Effects Of Vibroacoustically-Induced Microvibrations On EEG Activit...
The Acute Effects Of Vibroacoustically-Induced Microvibrations On EEG Activit...researchinventy
 
NIRS-BASED CORTICAL ACTIVATION ANALYSIS BY TEMPORAL CROSS CORRELATION
NIRS-BASED CORTICAL ACTIVATION ANALYSIS BY TEMPORAL CROSS CORRELATIONNIRS-BASED CORTICAL ACTIVATION ANALYSIS BY TEMPORAL CROSS CORRELATION
NIRS-BASED CORTICAL ACTIVATION ANALYSIS BY TEMPORAL CROSS CORRELATIONsipij
 
Monitoring neural activities by optical imaging
Monitoring neural activities by optical imagingMonitoring neural activities by optical imaging
Monitoring neural activities by optical imagingMd Kafiul Islam
 
Classification of EEG Signals for Brain-Computer Interface
Classification of EEG Signals for Brain-Computer InterfaceClassification of EEG Signals for Brain-Computer Interface
Classification of EEG Signals for Brain-Computer InterfaceAzoft
 
Comparison of regression models for estimation of isometric wrist joint torqu...
Comparison of regression models for estimation of isometric wrist joint torqu...Comparison of regression models for estimation of isometric wrist joint torqu...
Comparison of regression models for estimation of isometric wrist joint torqu...Amir Ziai
 
Correlation Analysis of Electromyogram Signals
Correlation Analysis of Electromyogram SignalsCorrelation Analysis of Electromyogram Signals
Correlation Analysis of Electromyogram SignalsIJMTST Journal
 
Myoelectric Leg for Transfemoral Amputee
Myoelectric Leg for Transfemoral AmputeeMyoelectric Leg for Transfemoral Amputee
Myoelectric Leg for Transfemoral Amputeeijsrd.com
 
INHIBITION AND SET-SHIFTING TASKS IN CENTRAL EXECUTIVE FUNCTION OF WORKING ME...
INHIBITION AND SET-SHIFTING TASKS IN CENTRAL EXECUTIVE FUNCTION OF WORKING ME...INHIBITION AND SET-SHIFTING TASKS IN CENTRAL EXECUTIVE FUNCTION OF WORKING ME...
INHIBITION AND SET-SHIFTING TASKS IN CENTRAL EXECUTIVE FUNCTION OF WORKING ME...sipij
 
EEG Mouse:A Machine Learning-Based Brain Computer Interface_interface
EEG Mouse:A Machine Learning-Based Brain Computer Interface_interfaceEEG Mouse:A Machine Learning-Based Brain Computer Interface_interface
EEG Mouse:A Machine Learning-Based Brain Computer Interface_interfaceWilly Marroquin (WillyDevNET)
 
Cross correlation analysis of
Cross correlation analysis ofCross correlation analysis of
Cross correlation analysis ofcsandit
 
CROSS CORRELATION ANALYSIS OF MULTI-CHANNEL NEAR INFRARED SPECTROSCOPY
CROSS CORRELATION ANALYSIS OF MULTI-CHANNEL NEAR INFRARED SPECTROSCOPYCROSS CORRELATION ANALYSIS OF MULTI-CHANNEL NEAR INFRARED SPECTROSCOPY
CROSS CORRELATION ANALYSIS OF MULTI-CHANNEL NEAR INFRARED SPECTROSCOPYcscpconf
 
CROSS CORRELATION ANALYSIS OF MULTI-CHANNEL NEAR INFRARED SPECTROSCOPY
CROSS CORRELATION ANALYSIS OF MULTI-CHANNEL NEAR INFRARED SPECTROSCOPYCROSS CORRELATION ANALYSIS OF MULTI-CHANNEL NEAR INFRARED SPECTROSCOPY
CROSS CORRELATION ANALYSIS OF MULTI-CHANNEL NEAR INFRARED SPECTROSCOPYcscpconf
 

Similaire à nature17435 (20)

Neurally Driven Prosthetics
Neurally Driven ProstheticsNeurally Driven Prosthetics
Neurally Driven Prosthetics
 
Improvement of a Bidirectional Brain-Computer Interface for Neural Engineerin...
Improvement of a Bidirectional Brain-Computer Interface for Neural Engineerin...Improvement of a Bidirectional Brain-Computer Interface for Neural Engineerin...
Improvement of a Bidirectional Brain-Computer Interface for Neural Engineerin...
 
Shuying_Zhang_IEM2014_poster
Shuying_Zhang_IEM2014_posterShuying_Zhang_IEM2014_poster
Shuying_Zhang_IEM2014_poster
 
Cavallaro2005
Cavallaro2005Cavallaro2005
Cavallaro2005
 
Neurobionics and robotic neurorehabilitations
Neurobionics and robotic neurorehabilitationsNeurobionics and robotic neurorehabilitations
Neurobionics and robotic neurorehabilitations
 
The Acute Effects Of Vibroacoustically-Induced Microvibrations On EEG Activit...
The Acute Effects Of Vibroacoustically-Induced Microvibrations On EEG Activit...The Acute Effects Of Vibroacoustically-Induced Microvibrations On EEG Activit...
The Acute Effects Of Vibroacoustically-Induced Microvibrations On EEG Activit...
 
NIRS-BASED CORTICAL ACTIVATION ANALYSIS BY TEMPORAL CROSS CORRELATION
NIRS-BASED CORTICAL ACTIVATION ANALYSIS BY TEMPORAL CROSS CORRELATIONNIRS-BASED CORTICAL ACTIVATION ANALYSIS BY TEMPORAL CROSS CORRELATION
NIRS-BASED CORTICAL ACTIVATION ANALYSIS BY TEMPORAL CROSS CORRELATION
 
Senior Thesis
Senior ThesisSenior Thesis
Senior Thesis
 
Monitoring neural activities by optical imaging
Monitoring neural activities by optical imagingMonitoring neural activities by optical imaging
Monitoring neural activities by optical imaging
 
Classification of EEG Signals for Brain-Computer Interface
Classification of EEG Signals for Brain-Computer InterfaceClassification of EEG Signals for Brain-Computer Interface
Classification of EEG Signals for Brain-Computer Interface
 
Comparison of regression models for estimation of isometric wrist joint torqu...
Comparison of regression models for estimation of isometric wrist joint torqu...Comparison of regression models for estimation of isometric wrist joint torqu...
Comparison of regression models for estimation of isometric wrist joint torqu...
 
Correlation Analysis of Electromyogram Signals
Correlation Analysis of Electromyogram SignalsCorrelation Analysis of Electromyogram Signals
Correlation Analysis of Electromyogram Signals
 
Gourov and Curran 2014
Gourov and Curran 2014Gourov and Curran 2014
Gourov and Curran 2014
 
Thesis
ThesisThesis
Thesis
 
Myoelectric Leg for Transfemoral Amputee
Myoelectric Leg for Transfemoral AmputeeMyoelectric Leg for Transfemoral Amputee
Myoelectric Leg for Transfemoral Amputee
 
INHIBITION AND SET-SHIFTING TASKS IN CENTRAL EXECUTIVE FUNCTION OF WORKING ME...
INHIBITION AND SET-SHIFTING TASKS IN CENTRAL EXECUTIVE FUNCTION OF WORKING ME...INHIBITION AND SET-SHIFTING TASKS IN CENTRAL EXECUTIVE FUNCTION OF WORKING ME...
INHIBITION AND SET-SHIFTING TASKS IN CENTRAL EXECUTIVE FUNCTION OF WORKING ME...
 
EEG Mouse:A Machine Learning-Based Brain Computer Interface_interface
EEG Mouse:A Machine Learning-Based Brain Computer Interface_interfaceEEG Mouse:A Machine Learning-Based Brain Computer Interface_interface
EEG Mouse:A Machine Learning-Based Brain Computer Interface_interface
 
Cross correlation analysis of
Cross correlation analysis ofCross correlation analysis of
Cross correlation analysis of
 
CROSS CORRELATION ANALYSIS OF MULTI-CHANNEL NEAR INFRARED SPECTROSCOPY
CROSS CORRELATION ANALYSIS OF MULTI-CHANNEL NEAR INFRARED SPECTROSCOPYCROSS CORRELATION ANALYSIS OF MULTI-CHANNEL NEAR INFRARED SPECTROSCOPY
CROSS CORRELATION ANALYSIS OF MULTI-CHANNEL NEAR INFRARED SPECTROSCOPY
 
CROSS CORRELATION ANALYSIS OF MULTI-CHANNEL NEAR INFRARED SPECTROSCOPY
CROSS CORRELATION ANALYSIS OF MULTI-CHANNEL NEAR INFRARED SPECTROSCOPYCROSS CORRELATION ANALYSIS OF MULTI-CHANNEL NEAR INFRARED SPECTROSCOPY
CROSS CORRELATION ANALYSIS OF MULTI-CHANNEL NEAR INFRARED SPECTROSCOPY
 

nature17435

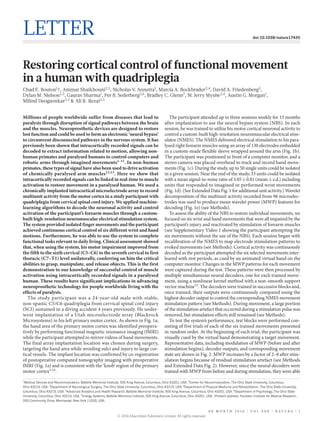
  • 1. 0 0 M O N T H 2 0 1 6 | V O L 0 0 0 | N A T U R E | 1 LETTER doi:10.1038/nature17435 Restoring cortical control of functional movement in a human with quadriplegia Chad E. Bouton1 †, Ammar Shaikhouni2,3 , Nicholas V. Annetta1 , Marcia A. Bockbrader2,4 , David A. Friedenberg5 , Dylan M. Nielson2,3 , Gaurav Sharma1 , Per B. Sederberg2,6 , Bradley C. Glenn7 , W. Jerry Mysiw2,4 , Austin G. Morgan1 , Milind Deogaonkar2,3 & Ali R. Rezai2,3 Millions of people worldwide suffer from diseases that lead to paralysis through disruption of signal pathways between the brain and the muscles. Neuroprosthetic devices are designed to restore lost function and could be used to form an electronic ‘neural bypass’ to circumvent disconnected pathways in the nervous system. It has previously been shown that intracortically recorded signals can be decoded to extract information related to motion, allowing non- human primates and paralysed humans to control computers and robotic arms through imagined movements1–11 . In non-human primates, these types of signal have also been used to drive activation of chemically paralysed arm muscles12,13 . Here we show that intracortically recorded signals can be linked in real-time to muscle activation to restore movement in a paralysed human. We used a chronically implanted intracortical microelectrode array to record multiunit activity from the motor cortex in a study participant with quadriplegia from cervical spinal cord injury. We applied machine- learning algorithms to decode the neuronal activity and control activation of the participant’s forearm muscles through a custom- built high-resolution neuromuscular electrical stimulation system. The system provided isolated finger movements and the participant achieved continuous cortical control of six different wrist and hand motions. Furthermore, he was able to use the system to complete functional tasks relevant to daily living. Clinical assessment showed that, when using the system, his motor impairment improved from the fifth to the sixth cervical (C5–C6) to the seventh cervical to first thoracic (C7–T1) level unilaterally, conferring on him the critical abilities to grasp, manipulate, and release objects. This is the first demonstration to our knowledge of successful control of muscle activation using intracortically recorded signals in a paralysed human. These results have significant implications in advancing neuroprosthetic technology for people worldwide living with the effects of paralysis. The study participant was a 24-year-old male with stable, non-spastic C5/C6 quadriplegia from cervical spinal cord injury (SCI) sustained in a diving accident 4 years previously. He under- went implantation of a Utah microelectrode array (Blackrock Microsystems) in his left primary motor cortex. As shown in Fig. 1a, the hand area of the primary motor cortex was identified preopera- tively by performing functional magnetic resonance imaging (fMRI) while the participant attempted to mirror videos of hand movements. The final array implantation location was chosen during surgery, targeting the hand area while avoiding sulci and injury to large cor- tical vessels. The implant location was confirmed by co-registration of postoperative computed tomography imaging with preoperative fMRI (Fig. 1a) and is consistent with the ‘knob’ region of the primary motor cortex5,14 . The participant attended up to three sessions weekly for 15 months after implantation to use the neural bypass system (NBS). In each session, he was trained to utilize his motor cortical neuronal activity to control a custom-built high-resolution neuromuscular electrical stim- ulator (NMES). The NMES delivered electrical stimulation to his para- lysed right forearm muscles using an array of 130 electrodes embedded in a custom-made flexible sleeve wrapped around the arm (Fig. 1b). The participant was positioned in front of a computer monitor, and a stereo camera was placed overhead to track and record hand move- ments (Fig. 1c). During the study, up to 50 single units could be isolated in a given session. Near the end of the study, 33 units could be isolated with a mean signal-to-noise ratio of 3.05 ± 0.81 (mean ± s.d.) including units that responded to imagined or performed wrist movements (Fig. 1d). (See Extended Data Fig. 1 for additional unit activity.) Wavelet decomposition of the multiunit activity recorded from 96 microelec- trodes was used to produce mean wavelet power (MWP) features for decoding (Fig. 1e) (see Methods). To assess the ability of the NBS to restore individual movements, we focused on six wrist and hand movements that were all impaired by the participant’s injury and reactivated by stimulation of forearm muscles (see Supplementary Video 1 showing the participant attempting the six movements without the use of the NBS). Each session began with recalibration of the NMES to map electrode stimulation patterns to evoked movements (see Methods). Cortical activity was continuously decoded as the participant attempted the six selected movements inter- leaved with rest periods, as cued by an animated virtual hand on the computer monitor. Changes in the MWP patterns for each movement were captured during the test. These patterns were then processed by multiple simultaneous neural decoders, one for each trained move- ment, using a nonlinear kernel method with a non-smooth support vector machine15 . The decoders were trained in successive blocks and, once trained, their outputs were continuously compared using the highest decoder output to control the corresponding NMES movement stimulation pattern (see Methods). During movement, a large portion of the stimulation artefact that occurred during a stimulation pulse was removed, but stimulation effects still remained (see Methods). To test the system’s performance, test blocks were performed con- sisting of five trials of each of the six trained movements presented in random order. At the beginning of each trial, the participant was visually cued by the virtual hand demonstrating a target movement. Representative data, including modulation of MWP (before and after stimulation begins), decoder outputs, and corresponding movement state are shown in Fig. 2. MWP increases by a factor of 2–8 after stim- ulation begins because of residual stimulation artefact (see Methods and Extended Data Fig. 2). However, since the neural decoders were trained with MWP from before and during stimulation, they were able 1 Medical Devices and Neuromodulation, Battelle Memorial Institute, 505 King Avenue, Columbus, Ohio 43201, USA. 2 Center for Neuromodulation, The Ohio State University, Columbus, Ohio 43210, USA. 3 Department of Neurological Surgery, The Ohio State University, Columbus, Ohio 43210, USA. 4 Department of Physical Medicine and Rehabilitation, The Ohio State University, Columbus, Ohio 43210, USA. 5 Advanced Analytics and Health Research, Battelle Memorial Institute, 505 King Avenue, Columbus, Ohio 43201, USA. 6 Department of Psychology, The Ohio State University, Columbus, Ohio 43210, USA. 7 Energy Systems, Battelle Memorial Institute, 505 King Avenue, Columbus, Ohio 43201, USA. †Present address: Feinstein Institute for Medical Research, 350 Community Drive, Manhasset, New York 11030, USA. © 2016 Macmillan Publishers Limited. All rights reserved
  • 2. 2 | N A T U R E | V O L 0 0 0 | 0 0 M O N T H 2 0 1 6 LETTERRESEARCH Time (s) Trial 0 5 10 15 20 –2 0 2 Meanwavelet power –1 0 1 e 0 Firingrate (spikess–1) 0 80 60 40 20 100 Trial WF 5 10 15 20 WE WR WUd Time (ms) Voltage(μV) Channel 37, unit 1 200 0 200 400 cb Arm movement Overlap Array a 1 2 3 4 0 1.5 Figure 1 | Experimental setup and neural modulation. a, Red regions are brain areas active during attempts to mimic hand movements, where the t-values for the move-rest T1-weighted fMRI contrast are greater than 7; The implanted microelectrode array location from post-operation computed tomography is shown in green; The overlap of the red and green regions is shown in yellow. b, Neuromuscular electrical stimulation sleeve. c, NBS in use with the participant in front a computer monitor. d, Examples of rasters and peristimulus histograms from one discriminated unit (channel 37 unit 1) with response to attempted wrist movements. The participant was presented with cues to attempt wrist flexion (WF), wrist extension (WE), wrist radial deviation (WR), and wrist ulnar deviation (WU). Each cue was presented for a random duration of 3–4 s followed by a random 3–4 s rest period. We presented 20 trials of each in random order. The top part of each subpanel is a raster, each dot represents a spike, and each row of spikes represents data from one trial. All trials were aligned on cue presentation (time zero, red dashed line). At the right of the panel is an example of 500 randomly selected waveforms from the discriminated unit (blue) from channel 37 that responded to wrist, elbow, and shoulder movements. The thick yellow line represents the average waveform for this unit which showed increased firing rate for imagined wrist flexion and wrist ulnar deviation (as well as elbow and shoulder movements, see Extended Data Fig. 1). Because the participant was asked to imagine and hold the movement throughout the cue period, the increase of activity during the rest cue is probably due to the participant imagining the antagonist movement to return to a neutral position. e, Wavelet-processed neural data from channel 37 corresponding to the same movements in d. The bottom part of each subpanel shows the mean wavelet coefficients for each movement and each trial over time. Each row represent data from a trial. The top part shows the MWP averaged over the trials in dark red with a confidence interval of 1 s.d. around the mean shown in light pink. The trials were centred on cue presentation (black dashed line). (Photographs by A. Morgan and T. R. Massey.) Wrist flexion Wrist extension Hand open Thumb flexion Thumb extension Middle flexion Neural decoder Video classifier 0.2 –0.2 –0.4 –0.6 –0.8 –1 –1.2 –3 –2 –1 0 1 2 3 0 MWP(beforestimulation) MWP(afterstartofstimulation) 155 156 157 158 159 160 Hand open Cue stopCue start 143 144 145 146 147 Thumb flexion Time (s) Cue stopCue start e 132 133 134 135 136 Middle flexion Cue stopCue start d Decoderoutputchannel 80 81 82 83 84 85 Wrist extension Cue stopCue start c 69 70 71 72 73 Wrist flexion b Cue stopCue start 52 0 0.5 1 1 96 0 0.5 1 1 96 53 54 55 56 57 Thumb extension Cue stopCue start Stimulation starts Decoderoutputchannel a f Figure 2 | MWP and system performance for individual hand movements. a–f, Heat maps of MWP representing processed signals from the microelectrode array, neural decoder output scores (dashed line), and physical hand movements (solid line) as detected by a computer-based video classification algorithm for each movement type: thumb extension (a), wrist flexion (b), wrist extension (c), middle flexion (d), thumb flexion (e), and hand open (f). Of the six simultaneously running decoders, the output score from the one with the highest amplitude greater than zero was used to turn on/off the stimulation. The vertical white line marks when the decoder crosses zero and the stimulation is turned on. MWP increases (by a factor of 2–8) during stimulation because of residual stimulation artefact (see Methods). The MWP plot is split into two areas with two different colour scales to facilitate visualization of MWP before and during stimulation. Trial data shown range from 0.5 s before the cue to 2.5 s after the cue ended. A 1 s wide boxcar filter is applied to the MWP data causing a delay of ~0.5 s. Each subfigure represents one trial out of the total five trials for each individual hand movement and the time scale on the x axis shows the absolute time when the particular movement occurred during the test block. The MWP is in units of standard deviations away from a baseline non-movement period. Only decoder outputs greater than zero are shown for visual clarity. © 2016 Macmillan Publishers Limited. All rights reserved
  • 3. 0 0 M O N T H 2 0 1 6 | V O L 0 0 0 | N A T U R E | 3 LETTER RESEARCH to recognize the correct imagined movement to initiate stimulation and the participant’s desire to sustain and subsequently terminate the target movement (see Supplementary Video 2 showing the participant attempting the six movements using NBS). Accuracy (percentage of video frames where observed movement matches the cue), sensitiv- ity (percentage of video frames during cued movement where correct movement was observed), and specificity (percentage of video frames correctly identified during rest or non-target movement cues) for the trained movements were measured by computer-based evaluation of video frames of hand movements (see Methods and Extended Data Fig. 3a). Using the system, the participant achieved an overall accu- racy of 70.4 ± 1.0% (mean ± s.d., P < 0.01 by permutation test16 ). His accuracy for performing individual movements ranged from 93.1 ± 0.5% for wrist flexion (P < 0.01) to 97.3 ± 0.3% for thumb flexion (P < 0.01). Sensitivity ranged between 32.9 ± 3.8% for thumb extension and 81.9 ± 2.6% for wrist extension, and specificity ranged between 94.8 ± 0.5% for wrist flexion and 99.8 ± 1.0% for thumb flex- ion (Extended Data Fig. 3b). The participant was able to perform sim- ilar basic movement tasks with text or verbal cues as well, suggesting the mirror neuron system is not required for these tasks. To characterize the recovery of upper limb function when using the NBS, a physiatrist performed assessments of upper limb senso- rimotor function using the Graded and Redefined Assessment of Strength, Sensibility, and Prehension (GRASSP) test17 . The GRASSP is a standardized test with excellent inter-rater and test–retest reliability developed to assess sensorimotor impairment of patients with cervical SCI across the following domains of the Manual Muscle Test (MMT): strength, dorsal sensation, ventral sensation, gross grasping ability (qualitative prehension), and prehensile skills (quantitative prehen- sion). All five GRASSP domains were assessed without use of NBS to generate a baseline score. As only motor, and not sensory, function was expected to change with use of the NBS, MMT, gross grasping ability, and prehensile skills subtests were repeated using the system. The NMES was calibrated to map electrode stimulation patterns to desired evoked movement patterns using an anatomically guided trial-and-error approach and a new decoder was trained for each individual task, rather than one for all tasks (see Methods). Figure 3 shows that when the par- ticipant used the NBS, his MMT strength improved from C6 to C7–C8 level, his gross grasping ability improved from C7–C8 to C8–T1 level, and his prehensile skills improved from C5 to C6 level. These findings quantify the reduction in functional motor impairments possible with NBS for patients with cervical SCI. Fatigue was sometimes observed after multiple repetitions of sustained (3–4 s) stimulation. To investigate the effectiveness of the NBS in assisting with daily activities relevant to daily life, we asked the participant to perform a complex functional movement that he was unable to complete without the system. The task required him to grasp a bottle with a cylindrical grasp, maintain the grasp while pouring its contents into a jar, open his hand to release the bottle, and use a precision pinch to pick up and hold a stir stick to stir the jar’s contents (Fig. 4 and Supplementary Video 3). During the task, the participant used his residual shoulder and elbow movements to guide his hand in space while he performed the task; however, this presented a significant challenge in initial test- ing. The participant had difficulty in maintaining his grasp of the objects, particularly during transfer, and often dropped them. We observed differences in the MWP associated with imagined grasping, T1A C8A C7A C6A System off System on Strength (MMT) Qualitative prehension Quantitative prehension 20% 40% 60% 80% 100% 0% Figure 3 | GRASSP clinical assessment. GRASSP performance on each domain was scored by percentage of possible points earned, and normed to benchmarks of the International Standards for Neurological Classification of Spinal Cord Injury and the American Spinal Injury Association Impairment Scale (greyscale regions in graph). The participant’s baseline score (red), obtained 8 months after implantation, falls within the C5–C6 norms for strength on MMT and quantitative prehension (gross grasping ability) and between C7–C8 for qualitative prehension (prehensile skills). Using the NBS (green), between 8 and 9 months after implantation, his motor function improved in all areas tested, with strength nearly achieving C8–T1 level function, qualitative prehension similarly improving to between C8–T1 level, and quantitative prehension improving to C6 level. Qualitative prehension was limited by lack of stimulation electrodes to facilitate thumb opposition. MMT strength was limited by lack of stimulation electrodes over elbow extensors and hand intrinsics. cba fed Figure 4 | Grasp-pour-and-stir functional movement task. a–f, Sequential snapshots from the functional movement task showing the participant opening his hand (a), grasping the glass bottle (b), pouring its contents (dice) into a jar (c), grasping a stir stick from another jar (d), transferring the stir stick without dropping it (e), and using it to stir the dice in the jar (f). The task required the participant to evoke different cortical modulation patterns to control the opening of his hand, perform a cylindrical palmar grasp, and achieve a precision pinch grasp, while simultaneously moving his arm. (Video by C. Majstorovic.) © 2016 Macmillan Publishers Limited. All rights reserved
  • 4. 4 | N A T U R E | V O L 0 0 0 | 0 0 M O N T H 2 0 1 6 LETTERRESEARCH stimulation-induced grasping, and grasp-and-transfer movements (Extended Data Fig. 4). To improve the decoding performance during these complex tasks, the MWP data from all three of these periods were used to train a nonlinear support vector machine (see Methods). Using this approach, the participant was able to successfully complete the grasp-pour-and-stir task three out of five times in 10 min with a completion time of 42 ± 10 s (mean ± s.d.) for successful trials, demon- strating that he was able to utilize the NBS for a functional activity that he could not perform otherwise (see Supplementary Video 4 showing the participant attempting the task without the use of NBS). In this study, for the first time, a human with quadriplegia regained volitional, functional movement through the use of intracortically recorded signals linked to neuromuscular stimulation in real-time. With use of the investigational system, our C5/C6 participant gained wrist and hand function consistent with a C7–T1 level of injury. This improvement in function is meaningful for reducing the burden of care in patients with SCI as most C5 and C6 patients require assistance for activities of daily living, while C7–T1 level patients can live more independently. Although invasive, the NBS provides an advantage over existing functional electrical stimulation systems that utilize low dimensional control signals such as EEG or EMG like the Freehand system18–20 . These devices typically allow control over fewer move- ments than those demonstrated in this study, because of the relatively low information content of their control signal sources compared with intracortically recorded signals. Complexfunctionalmovementsthatinvolvebothstimulation-induced and residual movements, such as those at the shoulder and elbow, pre- sented an important challenge in this study. Residual limb movement can activate motor cortical neurons21 and some motor cortical neurons respond to movement from several joints22 . This may explain the neural activity differences observed and the difficulties initially encountered as the patient attempted movements involving paralysed and non- paralysed joint movement simultaneously. The nonlinear algorithm presented here is one possible solution to this problem. To allow transfer of this work to other patients, further improvements will be required on the microelectrode technology, algorithms, and NMES. However, theelectronicneuralbypasspresentedheredemonstrateswhatispossible in the future and can offer hope for movement restoration to people living with paralysis worldwide. Online Content Methods, along with any additional Extended Data display items and Source Data, are available in the online version of the paper; references unique to these sections appear only in the online paper. Received 19 August 2015; accepted 15 February 2016. Published online 13 April 2016. 1. Aflalo, T. et al. Decoding motor imagery from the posterior parietal cortex of a tetraplegic human. Science 348, 906–910 (2015). 2. Bansal, A. K., Truccolo, W., Vargas-Irwin, C. E. & Donoghue, J. P. Decoding 3D reach and grasp from hybrid signals in motor and premotor cortices: spikes, multiunit activity, and local field potentials. J. Neurophysiol. 107, 1337–1355 (2012). 3. Chapin, J. K., Moxon, K. A., Markowitz, R. S. & Nicolelis, M. A. Real-time control of a robot arm using simultaneously recorded neurons in the motor cortex. Nature Neurosci. 2, 664–670 (1999). 4. Hochberg, L. R. et al. Reach and grasp by people with tetraplegia using a neurally controlled robotic arm. Nature 485, 372–375 (2012). 5. Hochberg, L. R. et al. Neuronal ensemble control of prosthetic devices by a human with tetraplegia. Nature 442, 164–171 (2006). 6. Kennedy, P. R. & Bakay, R. A. Restoration of neural output from a paralyzed patient by a direct brain connection. Neuroreport 9, 1707–1711 (1998). 7. Santhanam, G., Ryu, S. I., Yu, B. M., Afshar, A. & Shenoy, K. V. A high- performance brain-computer interface. Nature 442, 195–198 (2006). 8. Serruya, M. D., Hatsopoulos, N. G., Paninski, L., Fellows, M. R. & Donoghue, J. P. Instant neural control of a movement signal. Nature 416, 141–142 (2002). 9. Taylor, D. M., Tillery, S. I. & Schwartz, A. B. Direct cortical control of 3D neuroprosthetic devices. Science 296, 1829–1832 (2002). 10. Velliste, M., Perel, S., Spalding, M. C., Whitford, A. S. & Schwartz, A. B. Cortical control of a prosthetic arm for self-feeding. Nature 453, 1098–1101 (2008). 11. Wessberg, J. et al. Real-time prediction of hand trajectory by ensembles of cortical neurons in primates. Nature 408, 361–365 (2000). 12. Ethier, C., Oby, E. R., Bauman, M. J. & Miller, L. E. Restoration of grasp following paralysis through brain-controlled stimulation of muscles. Nature 485, 368–371 (2012). 13. Moritz, C. T., Perlmutter, S. I. & Fetz, E. E. Direct control of paralysed muscles by cortical neurons. Nature 456, 639–642 (2008). 14. Yousry, T. A. et al. Localization of the motor hand area to a knob on the precentral gyrus. A new landmark. Brain 120, 141–157 (1997). 15. Humber, C., Ito, K. & Bouton, C. Nonsmooth formulation of the support vector machine for a neural decoding problem. arXiv Preprint at http://arxiv.org/ abs/1012.0958v1 (2010). 16. Ojala, M. & Garriga, G. Permutation tests for studying classifier performance. J. Mach. Learn. Res. 11, 1833–1863 (2010). 17. Kalsi-Ryan, S., Curt, A., Verrier, M. C. & Fehlings, M. G. Development of the Graded Redefined Assessment of Strength, Sensibility and Prehension (GRASSP): reviewing measurement specific to the upper limb in tetraplegia. J. Neurosurg. Spine 17, 65–76 (2012). 18. Kilgore, K. L. et al. An implanted upper-extremity neuroprosthesis using myoelectric control. J. Hand Surg. Am. 33, 539–550 (2008). 19. Peckham, P. H. et al. An advanced neuroprosthesis for restoration of hand and upper arm control using an implantable controller. J. Hand Surg. Am. 27, 265–276 (2002). 20. Pfurtscheller, G., Muller, G. R., Pfurtscheller, J., Gerner, H. J. & Rupp, R. ‘Thought’–control of functional electrical stimulation to restore hand grasp in a patient with tetraplegia. Neurosci. Lett. 351, 33–36 (2003). 21. Shaikhouni, A., Donoghue, J. P. & Hochberg, L. R. Somatosensory responses in a human motor cortex. J. Neurophysiol. 109, 2192–2204 (2013). 22. Fetz, E. E., Finocchio, D. V., Baker, M. A. & Soso, M. J. Sensory and motor responses of precentral cortex cells during comparable passive and active joint movements. J. Neurophysiol. 43, 1070–1089 (1980). Supplementary Information is available in the online version of the paper. Acknowledgements We thank the study participant for his dedication and his family for their support. We also thank the development team and management at Battelle Memorial Institute for their support, the surgical support team, C. Majstorovic for assistance with data analysis and equipment during sessions, S. Preston for stereo camera coding and troubleshooting, the clinical study support staff, W. Pease for performing the electromyogram and nerve conduction studies, and M. Zhang for assistance with figure preparation. Financial support for this study came from Battelle Memorial Institute and The Ohio State University Center for Neuromodulation. Author Contributions C.E.B., N.V.A., D.A.F., G.S., B.C.G., M.A.B., A.S., A.G.M., D.M.N., P.B.S., W.J.M., and A.R.R. conceived and designed the experiments and fMRI procedure. N.V.A., D.A.F., G.S., B.C.G., M.A.B., and A.G.M. performed the experiments. W.J.M. and M.A.B. were involved in participant recruitment. A.R.R., M.D., and A.S. performed the surgery. All authors contributed to writing the paper. Author Information Reprints and permissions information is available at www.nature.com/reprints. The authors declare competing financial interests: details are available in the online version of the paper. Readers are welcome to comment on the online version of the paper. Correspondence and requests for materials should be addressed to C.E.B. (boutonce@gmail.com or cbouton@northwell.edu) or G.S. (sharmag@battelle.org). © 2016 Macmillan Publishers Limited. All rights reserved
  • 5. LETTER RESEARCH METHODS No statistical methods were used to predetermine sample size. Cues within an experiment were randomized, but experiments themselves were not randomized. The investigators were not blinded to allocation during experiments and outcome assessment. Approval for this study was obtained from the US Food and Drug Administration (Investigational Device Exemption) and The Ohio State University Medical Center Institutional Review Board (Columbus, Ohio). The study met institutional require- ments for the conduct of human subjects and was registered on the http://www. ClinicalTrials.gov website (identifier NCT01997125). The participant referenced in this work provided permission for photographs and videos and completed an informed consent process before commencement of the study. Study participant and surgical procedure. The study participant had complete, non-spastic quadriplegia subsequent to traumatic cervical spine injury sustained 4 years previously while diving. He had full bilateral elbow flexion (grade 5/5), active wrist extension with radial deviation through an incomplete range of motion against gravity (grade 2/5), but no motor function below the level of C6. His sen- sory level was C5 on the right (because of altered but present light touch on his thumb) and C6 on the left. He had intact proprioception in the right upper limb at the shoulder for internal rotation through external rotation, at the elbow for flexion through extension, at the forearm for pronation through supination, and at the wrist for flexion through extension. Proprioception for right digit flexion through extension at the metacarpal-phalangeal joints was impaired for all digits. His injury was complete, with an overall neurological level of C5 American Spinal Injury Association Impairment Scale A with zone of partial preservation for motor function to C6 bilaterally according to the International Standards for Neurological Classification of Spinal Cord Injury23 . Electromyogram with nerve conduction studies were performed by a board certified electromyographer to further pheno- type the patient’s motor impairments, documenting presence of voluntary motor units in the right deltoid (C56), biceps (C56), and extensor carpi radialis (C67), but absence of motor units in triceps (C678), pronator teres (C67), extensor digitorum (C78), extensor indicis (C78), flexor policis longus (C78), abductor policis brevis (C8–T1), and first dorsal interosseus (C8–T1) muscles. The patient underwent a left frontoparietal craniotomy. The hand area of motor cortex was identified preoperatively by fusing fMRI activation maps obtained while the patient attempted movements co-registered to the preoperative planning MRI. An intraoperative navigation system was used to plan the craniotomy. The microe- lectrode array was then implanted into the cortex using a pneumatic inserter. The pedestal was tunnelled under the skin to a posterior exit point. Reference wires were placed subdurally according to the manufacturer’s guidelines. fMRI acquisition. A 3 T MRI system (Philips Achieva) equipped with an eight-channel head coil was used to collect ten runs of functional images with a blipped single-shot gradient-echo EPI imaging sequence with a spatial resolution of 2.2 mm × 2.2 mm × 2.3 mm. The acquisition parameters were repetition time/echo time (TR/TE) 2,000/30 ms, 80° flip angle, 104 × 75 matrix size, 230 mm × 168 mm field of view, 27 slices, and echo train of 75 ms. The number of dynamic acquisi- tions was 165 and each run took 5.5 min. The field of view of the functional scans did not cover the whole brain, but did cover the superior motor strip bilaterally. A high-resolution T1-weighted image was also acquired with the following param- eters: TR/TE 7.7/3.5 ms, 1 mm × 1 mm × 1 mm voxel resolution, three-dimensional acquisition with 144 slices. We asked the participant to visualize movements of his right hand while we collected fMRI. We collected ten blocks, each with ten trials. Each trial consisted of a fixation cross displayed for 1.4 s, followed by a 5 s video depicting a movement beginning after a 0.1 s delay. Each movement video was repeated three times with a 1.5 s interval between repetitions. The orientation cross for the next set of videos was displayed after a jittered inter-trial interval of between 8 and 12 s, as well as two sets of three repetitions of 5 s videos depicting a right hand at rest. Each video began with a right hand in the resting position of his right hand. The hand in the video then executed a specific motion and held that movement before returning to the rest position. The videos depicted the following eight movements: clenching hand into a fist, wrist flexion, wrist pronation and supination, drumming fingers by sequentially touching the palm with the fifth to second fingers, splaying all fingers to maximum extension, flexing the first finger, flexing the second finger, flexing the third finger; and finally resting in which the hand did not move. To obtain the final results, we contrasted all of the movement conditions against the rest condition and found that the areas with the highest activation were in the left motor and sensory cortex. The location of the microelectrode array implanta- tion overlapped with an area in the motor strip where activity in response to motor visualization was observed. FunctionalMRIprocessing.FunctionalMRIprocessingwasperformedusingAFNI24 and FSL25 . We dropped the first three volumes of each run, then removed spikes with 3ddespike and regressed out cardiac and respiratory signals with 3dretroicor. Next, we temporally shifted all of the slices in each volume to the start of the volume’s collection using 3dTshift with Fourier interpolation and registered all of the functional volumes to the third volume of the first run. We fitted a general linear model restricted maximum likelihood with regressors for each of the visu- alization movement types and regressors for motion and the derivative of motion. The regressor for each visualization movement was a 5 s block convolved with a haemodynamic response function starting at the onset of each video presentation. Regressions were fitted with 3dDeconvolve and 3dREMLfit. To identify activity related to motor visualization, we contrasted all of the movements versus the rest condition and applied a threshold of a t value of 7, then dilated these results so that they were visible on the cortical surface. We co-registered the functional images with the T1-weighted anatomical image with FSL’s grey-matter/white-matter boundary-based linear registration. Postoperative computed tomography images were linearly registered with the same anatomical image using the FSL image registration tool with a mutual information cost function and 6 degrees of freedom. The overlap between microelectrode array location and fMRI results was visualized with MRIcroGL (http://www.cabiatl.com/mricrogl/). Researchers were not blinded during pre-processing or subsequent analyses. System architecture. The Neuroport neural data acquisition system and the Utah microelectrode array with 1.5 mm electrodes (Blackrock Microsystems) were used to acquire the neural data. A 0.3 Hz first-order high-pass and a 7.5 kHz third-order low-pass Butterworth analogue hardware filter were applied to the data, and each of the 96 channels of the microelectrode array were sampled at a rate of 30,000 samples per second. The digitized data were then transmitted to a personal com- puter where they were decoded to determine which motion was being imagined and then encoded to evoke the desired response from the muscles in the forearm. The computer communicated with the custom high-definition NMES that drove the electrode sleeve wrapped around the forearm. Signal processing. The signal processing and decoding/control algorithms were all run on a personal computer using MATLAB (version 2012a). The digitized data from the Neuroport was processed every 100 ms. Stimulation artefact in the data was detected by looking for a threshold crossing at 500 μV that occurred simultaneously on at least 4 of 12 randomly selected channels. A 2.5 ms window of data around each detected artefact was then removed and adjacent data segments were rejoined. This approach removed a large portion of the artefact, but stimu- lation effects still remained. Residual artefact, caused by the Neuroport amplifiers recovering from a brief period of saturation after each stimulation pulse, led to increased signal amplitude during stimulation (see wavelet processing description below). The decoders were trained with data from the period before and during stimulation to accommodate this residual artefact and allow the user to initiate and sustain the correct movement. Wavelet decomposition was then applied to the data, using the ‘db4’ wavelet and 11 wavelet scales26 . Wavelet decomposition has been shown to be an effective tool in neural decoding applications and provides information encompassing single unit, multiunit, and LFP, without requiring spike sorting27 . In this study four wavelet scales (3–6) were used, corresponding to the multiunit frequency band spanning approximately 234–3,750 Hz. The mean of the wavelet coefficients for each scale of each channel was calculated every 100 ms and a 1 s wide boxcar filter was applied to smooth the data. Baseline drift in the data was estimated by using a 15 s boxcar filter and was subtracted from the smoothed mean wavelet coefficients for the corresponding 100 ms window. This drift may be due to multiple causes including changes in concentration/focus level and has been observed previously28 . The mean coefficients of scales 3–6 were then standard- ized per channel, per scale, by subtracting the mean and dividing by the standard deviation of those scales and channels during the training blocks. The four scales were then combined by averaging the standardized coefficients for each channel, resulting in 96 values for every 100 ms of data. When present, residual artefact in a portion of this 100 ms segment can cause a local increase in wavelet coefficients leading to a twofold to eightfold increase in the reported mean for the segment. The resulting values were then used as features, termed mean wavelet power (MWP), as input into the decoders. Example decoder output scores are shown in Extended Data Fig. 5. To look at MWP signal quality over the study period, data for all channels were collected over 60 s at the beginning of each test session where the participant was instructed to close his eyes and rest. MWP features with no mean subtraction were calculated to approximate the power in the multiunit frequency bands. After an initial decline, the MWP stabilized after 150 days after implantation (Extended Data Fig. 6). Stimulation. The participant received intermittent stimulation during sessions (with a maximum of three sessions per week, typically lasting 3–4 h including setup time). The continuous, variable output score of each decoder was used to drive the stimulation level during all tasks. Stimulation hydrogel material (Axelgaard) cut into disks, 12 mm in diameter, were applied to the stimulation electrodes. The © 2016 Macmillan Publishers Limited. All rights reserved
  • 6. LETTERRESEARCH centre-to-centre spacing of the electrodes was 22 mm along the long axis of the forearm and 15 mm in the transverse direction. Electrical stimulation was pro- vided intermittently in the form of current-controlled, monophasic (biphasic recommended for long-term, continuous use) rectangular pulses of a 50 Hz pulse rate and 500 μs pulse width. Pulse amplitudes ranged from 0 to 20 mA and were updated every 100 ms. For each motion, the stimulation intensity and spatial pattern were determined by using a trial-and-error method. The output score of a given decoder was in the −1 to 1 range and when exceeding zero, the system enabled stimulation for that movement. If the output scores of multiple decoders exceeded zero simultaneously, then the system enabled the movement with the highest decoder score. If ‘graded stimulation intensity’ was not being used, then the stimulator would use the full (calibrated) stimulation intensity for the desired motion. In some cases, graded stimulation intensity was used, which required three stimulation intensity levels to be captured. The stimulation intensity levels were set so that they produced a low, medium, and high amount of joint deflection (visually determined by the operator). The decoder output score, r, was then used to set the stimulation intensity level, f(r), during real-time decoding. A piecewise linear function was used to interpolate between the three calibrated stimulation intensities as follows: ( ) =      ≤ / ( − )/ . + < ≤ . ( − )/ . + − . < ≤ . > . f r r r m l l r r h m m h r h r 0, 0 0 2 , 0 0 2 0 2 2 , 0 2 0 4 , 0 4 where l, m, and h, correspond to the three stimulation intensities. The thresholds of 0.2 and 0.4 were derived empirically and were used to compensate for the nonlinear response of the muscles to surface stimulation. Stimulation spatial patterns and intensity levels were saved in a database. In sub- sequent sessions with the participant, the previous calibrations could be recalled. See Supplementary Table 1 for electrode labels and total number of stimulation electrodes used to evoke each movement during the individual movement task and Extended Data Fig. 7 for a representative stimulation pattern used to evoke ‘hand open’ movement. Task methods and algorithm training. The decoders were trained in blocks, each consisting of repetitions of desired motions with short rest periods between. The participant was cued by a small graphical hand displayed on a monitor. After each block, the decoders were adapted (created or updated) using data from the most recent three blocks. During the first block (before a decoder had been built), the system provided ‘scripted’ stimulation (stimulation corresponding to the cue) while the participant imagined/attempted the cued movements. After the first block, a decoder was built and the study participant received real-time, cortically controlled stimulation. Every 100 ms, the system updated the stimulation with the electrode pattern for the motion with the highest decoder output score. For a short amount of time during each cue, referred to as ‘no-feedback time,’ no stimulation was given which provided training data from both the period before motion and during stimulation/motion. For tasks that included residual shoulder and elbow move- ment, longer movement cues were used to also capture training data for the grasp alone and subsequently the grasp with arm movement in space. This training data (cues and MWP features) were used to train a nonlinear support vector machine algorithm, resulting in more robust decoders. A decoder for each motion (against all other motions/rest) was built using a nonlinear Gaussian radial basis function kernel29 to process the features. The processed features were then input into a non-smooth support vector machine algorithm that used sparsity optimization to improve decoder accuracy by zeroing out the least valuable MWP features15 . During decoding, all decoders ran simultaneously and the decoder with the highest output score above zero was used to drive the stimulator. Individual movement task. During the individual movement task training, the participant was cued by the graphical hand for all six wrist and finger motions. The decoders were trained in seven successive blocks, each consisting of three trials of each movement. Each cue lasted 2.5 s and was always followed by a rest period of random length (2.5–4.0 s); the movement cues were randomly shuffled. The ‘no-feedback time’ was set to 1.2 s in the first block and 0.8 s in subsequent blocks. The test portion of the ‘individual movement task’ used the same cueing param- eters as during training, except each movement cue was repeated five times and the ‘no-feedback time’ was disabled. For this task, graded stimulation intensity was not used. Overall accuracy for the neural decoder was calculated by the fraction of 100 ms segments where the neural decoder agreed with the cue. To quantify finger and hand movements in the individual movement task, coloured finger cots (coverings) were placed on the participant’s fingers. For detect- ing movements involving the wrist, an additional cot was placed on a plastic cylin- der extending out past the participant’s thumb. A Bumblebee2 stereo camera was positioned above the participant’s hand to track movement in three dimensions. The colour of the cots was used to identify individual fingers and locate them in three-dimensional space using a combination of custom code and OpenCV30 . The location of the fingers was then fed into the same decoding algorithm used for neural decoding to determine the position of the hand, termed the video classifier. This classifier was trained using video data collected at 12 frames per second using scripted stimulation for the moves of interest. As previously described, accuracy, sensitivity, and specificity were computed. A permutation test was performed by comparing the observed data to data with shuffled labels16 . To account for reaction and system lag time, the video decoder data were shifted by 1.2 s. GRASSP assessment. Independent decoders were trained separately for each GRASSP test that required stimulation. During the GRASSP training, the par- ticipant was cued by the graphical hand for the motion needed for that particular task. The duration of the cue and rest periods were randomly selected from a uniform distribution across the ranges specified in Supplementary Table 2, which also specified the number of repetitions of each cue. Each cue was always followed by a rest period. The ‘no-feedback time’ was set to 0.8 s for all blocks. The test portion of the task used the same cueing parameters as those used during training, except each movement cue was repeated five times and the ‘no-feedback time’ was disabled. The GRASSP tests were conducted without any cues. Since decoder sets were trained for each individual GRASSP test (versus training one decoder set for all tests), the user could not switch between GRASSP tests at will without reloading or training the appropriate decoders. Some GRASSP tests required two movements to be trained for one test to open the hand around the object and then grip the object. In some GRASSP tests, graded stimulation intensity was used to make the gripping action smoother. Functional movement task. While performing training for the functional move- ment task, the participant was cued by the graphical hand for all three of the motions requiring stimulation. Each cue lasted 5.5 s and was always followed by a 5 s rest period. Each movement cue was repeated four times. The movement cues were sequenced so that the participant could perform the complete functional movement task during training. The ‘no-feedback time’ was set to 1.2 s in the first block and 0.8 s in subsequent blocks. For the hand open and bottle grip movements, the stimulation intensity was not graded; however, graded stimulation intensity was used for the stir bar grip to enable a smooth grasp. The test portion of the functional movement task was conducted without any cues. The participant was verbally instructed when to start upon which a timer was initiated. To be considered a successful trial, the participant had to grip the bottle, pour at least ten dice into the jar, set the bottle down, pick up a stir stick with a pinch grasp, stir the contents with at least two (circular) stirs, and leave the stir stick in the jar (at which time the timer was stopped). No objects could be dropped or knocked over during the task and the trial had to be completed within 60 s. He was given a total of 10 min to complete as many trials as possible (with a mandatory 60 s rest period between each trial). Sixty seconds of rest was chosen to give the researcher time to reset the props of the task and to give the participant time to rest physically and mentally. Because of his injury, the participant had limited ability to lift his arm, and repetitive tasks such as this requiring him to do so could cause his shoulder to fatigue and become uncomfortable. 23. Kirshblum, S. C. et al. International Standards for Neurological Classification of Spinal Cord Injury: cases with classification challenges. J. Spinal Cord Med. 37, 120–127 (2014). 24. Cox, R. W. AFNI: software for analysis and visualization of functional magnetic resonance neuroimages. Comput. Biomed. Res. 29, 162–173 (1996). 25. Smith, S. M. et al. Advances in functional and structural MR image analysis and implementation as FSL. Neuroimage 23 (Suppl. 1), S208–S219 (2004). 26. Mallat, S. A Wavelet Tour of Signal Processing (Academic, 1998). 27. Sharma, G. et al. Time stability of multi-unit, single-unit and LFP neuronal signals in chronically implanted brain electrodes. Bioelectron. Med. 2, 63–71 (2015). 28. Kennedy, P. Changes in emotional state modulate neuronal firing rates of human speech motor cortex: a case study in long-term recording. Neurocase 17, 381–393 (2011). 29. Scholkopf, B. et al. Comparing support vector machines with Gaussian kernels to radial basis function classifiers. IEEE Trans. Signal Process. 45, 2758–2765 (1997). 30. Bradski, G. The OpenCV library. Doctor Dobbs J. 25, 120–126 (2000). © 2016 Macmillan Publishers Limited. All rights reserved
  • 7. LETTER RESEARCH Extended Data Figure 1 | Neural modulation. a, b, Examples of rasters and peristimulus histograms from simultaneously recorded units with response to attempted or performed wrist, elbow, and shoulder movements are shown in (a) for channel 68, unit 1 and in (b) for channel 37, unit 1. The participant was presented with cues to attempt wrist flexion (WF), wrist extension (WE), wrist radial deviation (WR), wrist ulnar deviation (WU), elbow extension (EE), or to perform elbow flexion (EF), shoulder flexion (SF), or shoulder abduction (SA). Each cue was presented for a duration of 3 s with a random jitter of 0–2 s followed by a 3 s period with a jitter of 0–2 s. We presented 20 trials of each in random order. The top part of each subpanel is a raster, the black dots represent spikes, each row of spikes represents data from one trial. All trials were aligned on cue presentation (time zero, red dashed line). On the right of each set of panels is an example of 500 randomly selected waveforms from the discriminated unit (blue). The thick yellow line represents the average waveform for the unit. The top panel shows unit 1 on channel 68. This unit responded well to movement around the shoulder and elbow. The bottom panel shows activity from unit 1 on channel 37 that responded to wrist, elbow, and shoulder movements. Because the participant was asked to imagine and hold the movement throughout the cue period, the latent increase of activity after the cue ended (during the rest period) was probably due to the participant imagining the antagonist movement to return to a neutral position. © 2016 Macmillan Publishers Limited. All rights reserved
  • 8. LETTERRESEARCH Extended Data Figure 2 | Stimulation artefact removal. Stimulation artefact was removed from the signal associated with each electrode before further processing (see Methods). a, Example of the voltage data during stimulation for a single electrode shows a period before stimulation and a period during stimulation containing three stimulation artefacts (large amplitude pulses). b, Large artefacts were detected and removed to reduce their effects; however, residual artefacts could remain (causing a twofold to eightfold increase in MWP during stimulation). c, The period before stimulation is shown for reference. d, The period with three stimulation artefacts (after removal) is shown after concatenation/rejoining of the signal segments, and wavelet decomposition is then performed on these shorter, concatenated data (see Methods). © 2016 Macmillan Publishers Limited. All rights reserved
  • 9. LETTER RESEARCH Extended Data Figure 3 | Individual movement task performance. The participant was visually cued to attempt each of the six trained movements. a, Snapshot of each movement. b, The performance (sensitivity, specificity, and accuracy) was measured by automatic evaluation of video frames of hand movements for each of the six moves. The overall accuracy of the NBS was 70.4 ± 1.0% (P < 0.01). Statistics for individual movements are calculated against a movement specific cue vector with two classes: one class for the movement of interest and one class for all other moves plus rest, which we refer to as the non-target class. Sensitivity is the percentage of video frames during cued movement where the correct movement was observed. It captures the ability of the participant to initiate the specific movement in response to the cue and his ability to sustain the movement for the duration of the two second cue. Specificity is the percentage of video frames during non-target cues that were correctly identified. Accuracy is the percentage of video frames where the observed hand position matched the cue vector for that specific movement. It can also be calculated as a weighted average of sensitivity and specificity, with the weights corresponding to the relative frequency of the two classes. As such, the sensitivity and specificity give additional performance information which can be especially useful when the relative frequency of the classes is skewed towards one class. Overall accuracy measures the performance of all six decoders simultaneously by calculating the percentage of video frames where the observed hand position matches the position the participant was asked to achieve. Thus, errors on any of the six movements are incorporated in the overall accuracy, so it is expected to be lower than the accuracy of any individual movement. Error bars, ±2 s.d. (Video taken by D. Friedenberg.) © 2016 Macmillan Publishers Limited. All rights reserved
  • 10. LETTERRESEARCH Extended Data Figure 4 | MWP during a combination movement task. MWP as calculated by the NBS algorithm during a task combining imagined movement, stimulation-induced movement, and non-paralysed muscle movement is shown. The participant’s reaction time and a 1 s boxcar filter used to smooth the neural data creates the delay observed after the cues are presented. The participant’s hand was placed on top of a spoon set on a table and he was cued by the graphical hand to imagine gripping a spoon (solid black line), provided stimulation to evoke the actual gripping of the spoon (red line), and cued by an audible beep to transfer the spoon using the residual movement in his shoulder and elbow (black dashed line). The spoon transfer distance was approximately 45 cm to the left/right, alternating between each trial. Differences in MWP can be seen for each of the three portions of each trial. The increase in MWP between imagined movement and stimulation-induced movement is caused by residual stimulation artefact. During the transfer cue, the utilization of residual (shoulder) movement was associated with a different and consistent MWP pattern, requiring the development of a more robust decoding strategy which combined data from imagined, stimulation- induced, and transfer movements for decoder training (see Methods). © 2016 Macmillan Publishers Limited. All rights reserved
  • 11. LETTER RESEARCH Extended Data Figure 5 | Neural decoder outputs for each movement in the individual movement task. The blue line represents the cue that the participant was trying to match. For a particular movement, when the blue line was at one, the user was prompted to imagine that movement. The black line is the decoder output for that move. The decoded movement is rest if none of the decoder outputs are above zero (dotted line); otherwise, it is determined by the maximum of all the decoder outputs. Green stars are placed above the 29 out of 30 cues in which the neural decoder correctly matched the cue. In this plot the cues have been shifted by 0.8 s to account for reaction and system lag time. Decoder output below −0.5 has been set to −0.5 for visual clarity. © 2016 Macmillan Publishers Limited. All rights reserved
  • 12. LETTERRESEARCH Extended Data Figure 6 | Evolution of MWP over time. At the beginning of each test session, data for all channels were collected over 60 s where the participant was instructed to close his eyes and rest. No stimulation was provided during this period. MWP features with no mean subtraction were calculated to approximate the power in the multiunit wavelet bands corresponding to scales 3–6. After an initial decline the MWP stabilized at 150 days after implantation. Dashed line represents a polynomial fit of order 4. © 2016 Macmillan Publishers Limited. All rights reserved
  • 13. LETTER RESEARCH Extended Data Figure 7 | Stimulation electrode pattern. The stimulator was calibrated to evoke movements in the hand and wrist. a, Representative map of the anode (red) and cathode (black) electrodes in the lower (L) and upper (U) stimulation cuffs used to evoke the ‘hand open’ movement during the individual movement task. b, Stimulation cuffs on the participant’s arm, with the stimulation pattern highlighted. See Supplementary Table 1 for a complete list of electrode patterns used for the individual hand movement task. (Photographs taken by N. Annetta.) © 2016 Macmillan Publishers Limited. All rights reserved