Ontonix: Crisis Anticipation System
•
0 j'aime•160 vues

Monitoring and managing complexity within the system maintains robustness

Recommandé
Contenu connexe
Similaire à Ontonix: Crisis Anticipation System
Similaire à Ontonix: Crisis Anticipation System (17)
Plus de David Wilson
Plus de David Wilson (16)
Ontonix: Crisis Anticipation System
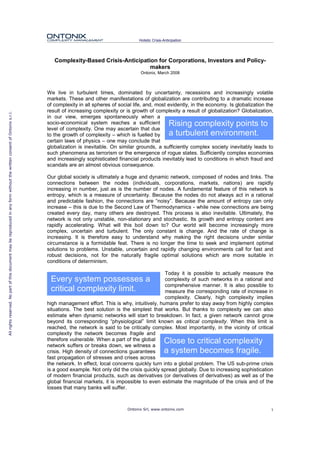
- 1. ONTONIX COMPLEXITY MANAGEMENT Holistic Crisis-Anticipation Complexity-Based Crisis-Anticipation for Corporations, Investors and Policy- makers Ontonix, March 2008 We live in turbulent times, dominated by uncertainty, recessions and increasingly volatile markets. These and other manifestations of globalization are contributing to a dramatic increase of complexity in all spheres of social life, and, most evidently, in the economy. Is globalization the result of increasing complexity or is growth of complexity a result of globalization? Globalization, All rights reserved. No part of this document may be reproduced in any form without the written consent of Ontonix s.r.l. in our view, emerges spontaneously when a socio-economical system reaches a sufficient Rising complexity points to level of complexity. One may ascertain that due to the growth of complexity – which is fuelled by a turbulent environment. certain laws of physics – one may conclude that globalization is inevitable. On similar grounds, a sufficiently complex society inevitably leads to such phenomena as terrorism or the emergence of rogue states. Sufficiently complex economies and increasingly sophisticated financial products inevitably lead to conditions in which fraud and scandals are an almost obvious consequence. Our global society is ultimately a huge and dynamic network, composed of nodes and links. The connections between the nodes (individuals, corporations, markets, nations) are rapidly increasing in number, just as is the number of nodes. A fundamental feature of this network is entropy, which is a measure of uncertainty. Because the nodes do not always act in a rational and predictable fashion, the connections are “noisy”. Because the amount of entropy can only increase – this is due to the Second Law of Thermodynamics - while new connections are being created every day, many others are destroyed. This process is also inevitable. Ultimately, the network is not only unstable, non-stationary and stochastic. Its growth and entropy content are rapidly accelerating. What will this boil down to? Our world will become increasingly more complex, uncertain and turbulent. The only constant is change. And the rate of change is increasing. It is therefore easy to understand why making the right decisions under similar circumstance is a formidable feat. There is no longer the time to seek and implement optimal solutions to problems. Unstable, uncertain and rapidly changing environments call for fast and robust decisions, not for the naturally fragile optimal solutions which are more suitable in conditions of determinism. Today it is possible to actually measure the Every system possesses a complexity of such networks in a rational and comprehensive manner. It is also possible to critical complexity limit. measure the corresponding rate of increase in complexity. Clearly, high complexity implies high management effort. This is why, intuitively, humans prefer to stay away from highly complex situations. The best solution is the simplest that works. But thanks to complexity we can also estimate when dynamic networks will start to breakdown. In fact, a given network cannot grow beyond its corresponding “physiological” limit known as critical complexity. When this limit is reached, the network is said to be critically complex. Most importantly, in the vicinity of critical complexity the network becomes fragile and therefore vulnerable. When a part of the global Close to critical complexity network suffers or breaks down, we witness a crisis. High density of connections guarantees a system becomes fragile. fast propagation of stresses and crises across the network. In effect, local concerns quickly turn into a global problem. The US sub-prime crisis is a good example. Not only did the crisis quickly spread globally. Due to increasing sophistication of modern financial products, such as derivatives (or derivatives of derivatives) as well as of the global financial markets, it is impossible to even estimate the magnitude of the crisis and of the losses that many banks will suffer. Ontonix Srl, www.ontonix.com 1
- 2. ONTONIX COMPLEXITY MANAGEMENT Holistic Crisis-Anticipation Because of the nature of the network and, most importantly, because of its rapidly rising complexity, similar crises will become more and more frequent. But, since crises will become the salient feature of the global economy (and society) a fundamental question arises. Is it possible to anticipate such crises? Can crisis-anticipation become the backbone of new management and decision-making paradigms? The answer is affirmative. Thanks to the recently developed complexity management technology, effective and rational crisis-anticipation is becoming a concrete reality. The business value of having a pre-alarm system which can issue early warnings is enormous. Our economy may be seen as a boiling liquid in which bubbles constantly form All rights reserved. No part of this document may be reproduced in any form without the written consent of Ontonix s.r.l. while others burst. Being able to estimate when a given bubble will burst is every manager’s and investor’s dream. Before we illustrate an eloquent example of how our complexity-based pre-alarm system works, let us take a closer look at the logic behind this innovative technique. The concept is simple. The state of health of a given system is proportional to the difference between its critical complexity and the current value of complexity. The closer the system is to its criticality threshold, the less healthy it is. The point is, therefore, to be able to measure both the complexity as well as the corresponding critical limit. Ontonix has developed “natural” measures for both. A model-free approach has been chosen, so as be independent of any particular modelling technique. Modelling is subjective and every model is disputable, adding to the intrinsic uncertainty of a given problem. In order to avoid this additional layer of uncertainty, we process raw data directly, without enforcing any kind of functions on top. With this premise in mind, we may state that a system enters in a state of pre-crisis as it approaches its critical complexity. Tracking the evolution of the distance of a system from its A system starts to build-up critical complexity yields, directly, a measure of the system’s vulnerability. As increasingly complexity before a crisis. high thresholds of complexity are crossed, warning of increasing intensity may be issued. Systems that are kept at a safe distance from criticality are robust and therefore enjoy a lower risk exposure than near-critical systems. This may be said of corporations, markets or societies, or the World as a whole. The enormous value of this approach stems from a fundamental issue. Sufficiently complex systems often collapse due to endogenous, or internal, causes. Traumas induced from the outside are not necessary in order to destroy a very complex system. The sheer complexity of certain systems makes them vulnerable from within. History is full of examples. Let us take a closer look at the US sub-prime crisis in order to appreciate the power of this simple approach. Steeply rising house values in the USA during the period 2001– 2005 tempted new buyers to borrow beyond their means, and existing owners to borrow money by re-financing their existing mortgages, using as collateral the increased value of their real estate. In the case of loans made to marginal credit-worthy customers, commonly known as sub-prime loans, the lenders tended to "look the other way". Then prices began to turn around. The sub-prime mortgage crisis was born and caused a sharp rise in home foreclosures. The process commenced during the fall of 2006 and had become a global financial crisis within a year. Many factors created it, but the most immediate causes were a rising interest rate environment which caused people with adjustable rate mortgages to see significant increases in their loan payments amid declining property values. This left many borrowers unable or unwilling to meet their financial commitments, and many lenders without a means to recoup their losses. The sharp rise in foreclosures after the fall in housing values caused several major sub-prime mortgage lenders to shut down or file for bankruptcy. The sub-prime crisis could This activity has helped lead to the stock price have been anticipated. collapse of some of the largest lenders such as Countrywide Financial, Washington Mutual, government-sponsored Fannie Mae, and Citigroup, a component of the Dow Jones Industrial Average. Sub-prime loan packages became investment vehicles available for purchase by banks and other investment entities throughout the world, and the U.S.-created crisis is thought by many to have had its effect on stock markets Ontonix Srl, www.ontonix.com 2
- 3. ONTONIX COMPLEXITY MANAGEMENT Holistic Crisis-Anticipation globally. Several hedge funds became worthless, and some coordinated national bank interventions became necessary. Observers of the meltdown suggest that blame needs to be shared between the mortgage provider and the consumer. Others have charged mortgage brokers with steering borrowers to unaffordable loans, and their house appraisers with inflating housing values. Mortgages are normally originated by banks and mortgage companies, who in turn borrow the money by selling loan packages to Wall Street and various types of investment funds who in turn may have borrowed their money from low or zero interest sources such as Japan, known as the carry trade. The actual and ultimate valuation ascribed to a fixed investment through these generational levels became inscrutable. Thus, it is claimed by some that Wall All rights reserved. No part of this document may be reproduced in any form without the written consent of Ontonix s.r.l. Street helped to distribute risk by shifting it from providers who should have known what was going on to consumers who did not. It appears that the causes of the meltdown are pretty much understood. However, pressing questions arise at this point: Why did nobody raise a red flag? How is it possible that a crisis of similar magnitude passed unnoticed under our noses? We probably won't know the exact magnitude of the crisis for years to come. The question, at this point, is to figure out how a similar future crisis may be anticipated. Our study of the US housing market spanned the period 2004-2007, embracing a total of 56 parameters, including 16 macro-economical indicators. The full list is reported below. TABLE 1 US housing market analysis parameters. • GDP • FEDFUNDS • LIBOR 1-year • Unemployment • Inflation • YenDollar • DollarEU • DollarUK • YuanDollar • Retail Sales • NASDAQ Vol • NASDAQ Adj Cls • DJI Vol • DJI Adj Cls • SnP Vol • SnP Adj Cls • Newly privately owned housing units started • Newly privately owned housing units under construction • Newly privately owned housing units completed • New single family home sales - US sold • New single family home sales - Months supply at current US sales rate • Existing home sales - US • Existing home sales - Months supply • New single family home prices - median - US • New single family home prices - US average - houses actually sold • Existing home prices-median - US • Existing home prices - Average - US • Repeat Sales house price index - US • Housing Affordability index - US - Median Existing Price • Housing Affordability index - US - Income to Qualify • Market Absorption of new rental units and median asking rent - unfurnished rental apartment completions • Market Absorption of new rental units and median asking rent - Median asking rent • Builders views of housing market activity - housing market index • Builders views of housing market activity - Sale of single family detached homes - current activity • Builders views of housing market activity - Sale of single family detached homes - future expectations • Builders views of housing market activity - prospective buyer traffic • Mortgage interest rates - conventional 30 yr fixed rate • Mortgage interest rates - conventional 15 yr fixed rate • Mortgage interest rates - conventional 1 yr ARM rate • Mortgage interest rates - effective rates - fixed rate - effective rate • FHA,VA,PA,PMI 1-4 Family mortgage insurance activity - FHA applications • FHA,VA,PA,PMI 1-4 Family mortgage insurance activity - PMI Certificates • Mortgage Delinquencies and Foreclosures Started - Delinquency Rates -Total Past due - All Loans Ontonix Srl, www.ontonix.com 3
- 4. ONTONIX COMPLEXITY MANAGEMENT Holistic Crisis-Anticipation • Mortgage Delinquencies & Foreclosures Started - Delinquency Rates -Total Past due – Conv. Loans - All Conv • Mortgage Delinquencies & Foreclosures Started - Delinquency Rates -Total Past due – Conv. Loans - Prime only • Mortgage Delinquencies & Foreclosures Started - Delinquency Rates -Total Past due – Conv. Loans -SubPrime only • Mortgage Delinquencies and Foreclosures Started - Foreclosures Started - All Loans • Mortgage Delinquencies and Foreclosures Started - Foreclosures Started -Conventional Loans - All conv • Mortgage Delinquencies and Foreclosures Started - Foreclosures Started -Conventional Loans - Prime only • Mortgage Delinquencies and Foreclosures Started - Foreclosures Started -Conventional Loans - SubPrime only • Expenditures for existing residential properties - Total Expenditures • Expenditures for existing residential properties - Maintenance and Repair • Value of new construction, private residential buildings - New residential construction - Single family structures • Gross domestic product and residential fixed investment - Gross Domestic Product • Gross domestic product and residential fixed investment - Residential fixed investment All rights reserved. No part of this document may be reproduced in any form without the written consent of Ontonix s.r.l. • Gross domestic product and residential fixed investment - Residential fixed investment percent of GDP Time-domain analysis of the data has been performed with OntoSpace™ using a sliding-window approach. The objective of the study has been to identify any significant fluctuations in complexity, entropy and state-of health of the market, which would hint the presence of hidden Changes in complexity problems or imminent traumas. The results were, to say the least, astonishing. While in the period indicate imminent crisis. 2004-2005 the complexity of the market oscillated around 32-33, in early 2006, we witness a rapid rise, which ends during the last quarter of 2006, see Figure 1. Critical Complexity Complexity 2004 2005 2006 2007 Figure 1 Evolution of complexity and the corresponding complexity bounds in the US housing market. At the end of 2006 complexity reaches a plateau, remaining almost constant (around 45) until the end of 2007. The upper curve in the plot reflects the corresponding critical complexity which also increases – this is generally a reflection of the growth of the market and is generally a positive phenomenon. Such a sharp increase in complexity (35%) generally means two things: Ontonix Srl, www.ontonix.com 4
- 5. ONTONIX COMPLEXITY MANAGEMENT Holistic Crisis-Anticipation 1. The variables in question (see list in TABLE 1) are becoming more entropy-rich (in other words, the degree of uncertainty increases) - see entropy time-history below in Figure 2. 2. There is an increase in the number of relationships between the variables - a change in any variable influences an increasing number of other variables. While the complexity (orange curve) remains stable throughout 2007, the critical complexity shows a clear and constant trend towards lower values. This means that the market is becoming globally less healthy, see Figure 3. In effect, this holistic (global) state of health is what analysts miss. Conventional risk rating methods rarely take into account so many parameters and All rights reserved. No part of this document may be reproduced in any form without the written consent of Ontonix s.r.l. therefore necessarily lack the holistic dimension of our analysis. One could, in effect, devise a function linking all the 56 parameters into one single market health index. However, such a function will always be subjective. One has to be lucky in selecting the function and in defining weights of the parameters. Our complexity metric is a natural and intrinsic attribute of dynamical systems. It quantifies the amount of structured information within a system, and therefore is not dependent on the experience or modeling preferences of the analyst. 2004 2005 2006 2007 Figure 2 Evolution of entropy in the US housing market. The robustness time-history is very interesting. As the robustness has been growing steadily - reflecting a globally positive climate - it has Complexity reflects the been doing so with an increasingly oscillatory behavior, see Figure 3. After peaking during state-of-health of a market. the third quarter of 2006, it started to decline sharply at exactly the same time as complexity has reached a plateau and as critical complexity started to decrease slowly. In synch with complexity also the overall market entropy started to rise sharply in early 2006, doubling in early Ontonix Srl, www.ontonix.com 5
- 6. ONTONIX COMPLEXITY MANAGEMENT Holistic Crisis-Anticipation 2007 the value it had in early 2006. It is evident how, during 2006, the market was quickly accumulating entropy, thereby becoming globally more uncertain and turbulent. Large amounts of entropy cannot be accumulated for long – Nature offers no free lunch – and the entropy has to be dumped somehow. A consistent and oscillatory increase in entropy is very rarely a good omen. An example of Process Map, relating the market parameters, is shown below in Figure 4. The map evolves with time, given that it is obtained based on time-dependent data. The high density of the map gives an idea of how difficult decision-making is and how problems at any particular node will quickly spread to other nodes. In other words, fixing a problem may rapidly lead to new All rights reserved. No part of this document may be reproduced in any form without the written consent of Ontonix s.r.l. problems. 2004 2005 2006 2007 Figure 3 Evolution of the state-of-health (robustness) of the US housing market. The last portion of the plot (2007) suggests that the crisis will continue throughout 2008. Examining the above plots one recognizes how the rapid changes in complexity and entropy were hinting that the market was globally becoming less healthy and resilient. At least a year before the public was informed of the meltdown (August 2007) there were clear indications. The Process Map, illustrated in Figure 4, also grew in density during that period. Since the value of complexity reflects how structured and information-rich a system is, it is evident that the amount of management resources dedicated to a certain problem must be in proportion with its complexity. If a market becomes significantly more complex, analysis and decision-making tools must take this fact into account, risking failure if they don’t. It becomes clear, at this point, how complexity-based crisis anticipation works. You simply measure and track complexity, and look out for any sudden changes or even slow but consistent drifts. In both cases, these point to the accumulation of entropy and the emergence of new structures within the system. Since entropy cannot grow indefinitely without being dumped by the system, one can be assured of an approaching crisis. The gradients of complexity give an idea of Ontonix Srl, www.ontonix.com 6
- 7. ONTONIX COMPLEXITY MANAGEMENT Holistic Crisis-Anticipation how intense the crisis will be and, most importantly, when it will hit. Coupled with past experience and the knowledge of previous crises, this technique provides the basis for a rational and Tracking complexity allows holistic crisis-anticipation system which may to anticipate a crisis. be used by decision-makers, investors, managers, and policy-makers. All rights reserved. No part of this document may be reproduced in any form without the written consent of Ontonix s.r.l. Figure 4 Process Map of the US housing market. Since the map is generated based on time- dependent data, it evolves and changes with time. This means that variables which appear to be critical during a particular period may not be critical in the following period. Ontonix Srl, www.ontonix.com 7