Measuring the return from pharmaceutical innovation 2015
•
3 j'aime•27,886 vues

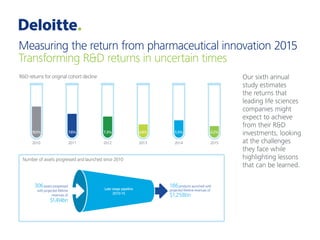
Our sixth annual study estimates the returns that leading life sciences companies might expect to achieve from their R&D investments, looking at the challenges they face while highlighting lessons that can be learned.

Recommandé
Recommandé
Contenu connexe
Tendances
Tendances (20)
Similaire à Measuring the return from pharmaceutical innovation 2015
Similaire à Measuring the return from pharmaceutical innovation 2015 (20)
Plus de Deloitte UK
Plus de Deloitte UK (20)
Dernier
Dernier (20)
Measuring the return from pharmaceutical innovation 2015
- 1. Measuring the return from pharmaceutical innovation 2015 Transforming R&D returns in uncertain times Our sixth annual study estimates the returns that leading life sciences companies might expect to achieve from their R&D investments, looking at the challenges they face while highlighting lessons that can be learned. Cost to develop an asset has increased by ~1/3rd since2010 Average peak sales per asset have halved since 2010 As cost to develop an asset increases, sales continue to decline Despite declining returns original cohort has improved on two key metrics 2010 2015 2015 50% $816m $416m 2010 2015 33% $1.188bn $1.576bn R&D returns for original cohort decline 2010 10.1% 2011 7.6% 2012 7.3% 2013 4.8% 2014 5.5% 2015 4.2% Number of assets progressed and launched since 2010 186products launched with projected lifetime revenues of $1,258bn Late stage pipeline 2010-15 306assets progressed with projected lifetime revenues of $1,414bn Therapy area Externalinnovation is important – higher proportion 54%
- 2. Core trends in 2015 Cost to develop an asset has increased by ~1/3rd since2010 Average peak sales per asset have halved since 2010 130% 17%vs5% However, between 2013-15, extension cohort of mid- to large-cap companies outperforms on all R&D metrics As cost to develop an asset increases, sales continue to decline Despite declining returns original cohort has improved on two key metrics 2010 2015 2015 higher average peak sales Over three-times higher IRR 25% Lower average cost to develop an asset Projected value lost through terminated assets has declined from ~$80bneachyear to~$30bnin2015 43approved assets – highest number recorded STOPGO 50% $816m $416m 2010 2015 33% $1.188bn $1.576bn 2010 10.1% 2011 7.6% 2012 7.3% 2013 4.8% 2014 5.5% 2015 4.2% $$ $ $
- 3. Drivers of R&D performance 186products launched with projected lifetime revenues of $1,258bn Late stage pipeline 2010-15 306assets progressed with projected lifetime revenues of $1,414bn Bigger is not necessarily better – between 2013-15 smaller companies are delivering higher R&D returns Therapy area consistency delivers more, higher value assets Externalinnovation is important – higher proportion of late stage pipeline value from external assets in extension cohort: 54% 79% Extension cohort* * Extension cohort: mid- to large-cap companies Original cohort Extension cohort* Original cohort 5% 17% www.deloitte.co.uk/measuringrndreturns