1. Part 2. Out of sample testing and live trading January 29, 2009
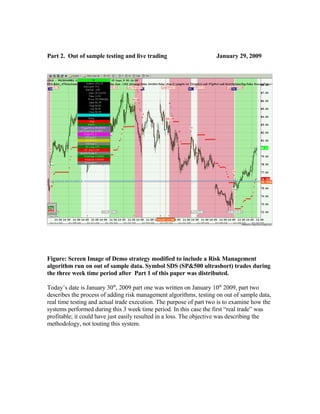
Figure: Screen Image of Demo strategy modified to include a Risk Management
algorithm run on out of sample data. Symbol SDS (SP&500 ultrashort) trades during
the three week time period after Part 1 of this paper was distributed.
Today’s date is January 30th, 2009 part one was written on January 10th 2009, part two
describes the process of adding risk management algorithms, testing on out of sample data,
real time testing and actual trade execution. The purpose of part two is to examine how the
systems performed during this 3 week time period. In this case the first “real trade” was
profitable; it could have just easily resulted in a loss. The objective was describing the
methodology, not touting this system.
2. However Costly, Risk Management is essential.
Surprisingly adding money management algorithms such as stops will often result in a less
profitable strategy. Apparently an “always in” strategy enables an earlier entry and this can
out weight the advantage of limiting losses via stops placement.
Stops in a sense are insurance. Insuring against a potential disaster is essential. Surprisingly
stops frequently erode strategy performance but can be viewed as life insurance. Like any
insurance policy there is a “premium” cost associated. In the case of this strategy, stops
improve the strategy performance.
There are a large number of stop algorithms to choose from: fixed percentage, moving
average base, dynamic volatility stops, trailing, parabolic, etc. After extensive testing I rely
on a method that serves two purposes: limiting risk and protecting profits.
Screen image of strategy modified to incorporate money management algorithm, which
encompasses the time period since Part 1 was written. On the following screen image for
the S&P 500 Ultra short ETF the red labels were added indicating Long and Short signals,
LX and SX, labels indicate exiting short and long positions, and the red dots represent a
proprietary “trailing stop” algorithm.
3. Out of Sample Testing - Verify historical back testing results
Every system needs to have the historical results verified. The first step is to insure the
back testing trade signals and actual report results are the same as those occurring during
real time market hours. One has to be completely certain the reported back testing profit
and loss figures are accurate. Most trading strategy development programs are accurate if
the strategy is coded correctly. However, in order to gauge accuracy and properly factor in
slippage, the strategy is tested in real time on our of sample data.
Once it is determined that the reports are accurate the out of sample results will determine
if the overall strategy results are in line with the back test on historical data. As long as the
strategy is not optimized, results should be similar. The more variable permutations, or
optimization done the greater the chance that the strategy is “curve fitted”. Optimized
strategies rarely if ever produce results on out of sample data. The exact same strategy is
being run on each symbol, eliminating any possibility of “optimization”.
Figure: Trades generated on out of sample symbol SDS (SP500 Ultrashort) during
three week period since Part 1 of this paper was distributed. The out of sample results
validate the profitability of the strategy.
4. Figure: Strategy Performance Report for out of sample time period system returned
15 percent during the time period, very much in line with prior 6 months in sample
performance results.
5. Figure: Total trade analysis report for out of sample time period validates in sample
historical testing period.
7. Live Trading Begins
Initially minimally sized trades will be executed while continuing to further validate
trading results prior to increasing position size. The symbols being traded should scale well
as the objective is to maximize strategy profitability. The symbols being trades are highly
liquid, broad based index and sector ETFs.
Compare actual trade execution and eSignal reported execution.
Figure: This was the eSignal trade report signaling a long trade at approximately
10:00am at a price of 75.93 am on 1/29/09 and closed at 1/30/09 for a profit of $350 or
approximately 5 percent. The execution report produced by my firms front end
execution program, HydraTrade, reports the trade, order # 402578 on the INET.
INET is the ECN I routed the order to for symbol SDS and the other symbols
mentioned in this report. The .02 difference is accounted for by slippage which I
specify as .05 for each trade.
9. EEV UltraShort MSCI Emerging Mrkts ProShares ETF
Order Gross Ecn Net
Time Id Exchg Liq B/S Qty Price Realized Comm Fee SEC TAF Realized
10:01:42 402527 INET A B 10 56.54 -565.4 1 -0.02 0 0 -566.38
Overnight Adjustment 565.4 0 565.4
Fills: 1 10 0 1 -0.02 0 0 -0.98
MZZ UltraShort MidCap400 ProShares ETF
Order Gross Ecn Net
Time Id Exchg Liq B/S Qty Price Realized Comm Fee SEC TAF Realized
10:01:58 402536 INET A B 10 59.61 -5961 1 -0.19 0 0 -5961.8
Overnight Adjustment 596.1 0 596.1
Fills: 2 190 -2.7 2 -0.36 0.08 0.01 -4.43
SDS UltraShort S&P500 ProShares ETF
Order Gross Ecn Net
Time Id Exchg Liq B/S Qty Price Realized Comm Fee SEC TAF Realized
10:04:18 402578 INET A B 10 75.91 -759.1 1 -0.02 0 0 -760.08
Overnight Adjustment 759.1 0 759.1
Fills: 1 10 0 1 -0.02 0 0 -0.98
SRS UltraShort Real Estate ProShares ETF
Order Gross Ecn Net
Time Id Exchg Liq B/S Qty Price Realized Comm Fee SEC TAF Realized
10:06:09 402635 INET A B 10 51.88 -518.8 1 -0.02 0 0 -519.78
Overnight Adjustment 518.8 0 518.8
Fills: 1 10 0 1 -0.02 0 0 -0.98
TZA Direxion Small Cap Bear 3X Shares ETF
Order Gross Ecn Net
Time Id Exchg Liq B/S Qty Price Realized Comm Fee SEC TAF Realized
10:05:16 402600 INET A B 10 53.04 -530.4 1 -0.02 0 0 -531.38
Overnight Adjustment 530.4 0 530.4
Fills: 1 10 0 1 -0.02 0 0 -0.98
Figure: Clearing broker execution report listing the prior days opening trades.
10. Figure: Because these trades were executed today, the clearing broker reports will not
be available until tomorrow (actually Monday). This is the trade report produced by
the HydaTrade front end trade execution. Initially only 10 shares are traded as the
system is being validated, even 100 shares in these symbols could result in losses of
thousands of dollars. The instruments traded are highly liquid and position sizes of
many thousands of shares can be held.
Net Net
Symbol Open Close Points Pct
EEV 56.54 58.24 1.7 3.01%
MZZ 59.61 62.48 2.87 4.81%
SDS 75.91 79.57 3.66 4.82%
SRS 51.88 56.66 4.78 9.21%
TZA 53.04 57.66 4.62 8.71%
Figure: Actual Profit and Loss calculation taking data from the earlier execution
report copied into an excel spreadsheet as reported by execution broker report.