SlideShare une entreprise Scribd logo
1  sur  26
Copyright 2014 American Medical Association. All rights
reserved.
Compensation of Chief Executive Officers
at Nonprofit US Hospitals
Karen E. Joynt, MD, MPH ; Sidney T. Le, BA; E. John Orav,
PhD; Ashish K. Jha, MD, MPH
H ospital chief executive officers (CEOs) play a criticalrole in
shaping the performance of their organiza-tions through setting
organizational priorities, allo-
cating resources, and hiring clinical leadership. Indeed, in a
recent large national survey1 of hospital board chairpersons,
respondents reported that CEOs were the single most influ-
ential individuals in shaping quality performance at their
institutions.
One way to potentially improve quality at an institution
is to tie the CEO’s compensation to the institution’s perfor-
mance. This has been broadly used in other industries, and data
suggest that metrics chosen for inclusion in CEO compensa-
tion packages can affect executives’ behavior.2,3 However, we
know little about how CEOs in the hospital industry are paid
and the specific factors that underlie their compensation, with
much of the data either decades old or focused on a limited
sample of institutions.4-8 These issues are particularly salient
among nonprofit institutions, in which the metric of organi-
zational success in many industries—the profitability of the or-
ganization—must be balanced against more mission-driven fac-
tors, such as the quality of care delivered and the degree of
community benefit provided. Yet, we are unaware of any em-
pirical data on the metrics by which CEOs of nonprofit hospi-
tals are paid or to what degree the hospital’s quality of care or
level of community benefit affects their compensation.
In mid-2012, national data on compensation of CEOs of
nonprofit entities became publicly available for the first time.
We used these newly available data to answer 3 questions. First,
IMPORTANCE Hospital chief executive officers (CEOs) can
shape the priorities and
performance of their organizations. The degree to which their
compensation is based on their
hospitals’ quality performance is not well known.
OBJECTIVE To characterize CEO compensation and examine
its relation with quality metrics.
DESIGN, SETTING, AND PARTICIPANTS Retrospective
observational study. Participants
included 1877 CEOs at 2681 private, nonprofit US hospitals.
MAIN OUTCOMES AND MEASURES We used linear
regression to identify hospital structural
characteristics associated with CEO pay. We then determined
the degree to which a hospital’s
performance on financial metrics, technologic metrics, quality
metrics, and community
benefit in 2008 was associated with CEO pay in 2009.
RESULTS The CEOs in our sample had a mean compensation of
$595 781 (median, $404 938)
in 2009. In multivariate analyses, CEO pay was associated with
the number of hospital beds
overseen ($550 for each additional bed; 95% CI, 429-671; P <
.001), teaching status
($425 078 more at major teaching vs nonteaching hospitals;
95% CI, 315 238-534 918;
P < .001), and urban location. Hospitals with high levels of
advanced technologic capabilities
compensated their CEOs $135 862 more (95% CI, 80 744-190
990; P < .001) than did
hospitals with low levels of technology. Hospitals with high
performance on patient
satisfaction compensated their CEOs $51 706 more than did
those with low performance on
patient satisfaction (95% CI, 15 166-88 247; P = .006). We
found no association between
CEO pay and hospitals’ margins, liquidity, capitalization,
occupancy rates, process quality
performance, mortality rates, readmission rates, or measures of
community benefit.
CONCLUSIONS AND RELEVANCE Compensation of CEOs at
nonprofit hospitals was highly
variable across the country. Compensation was associated with
technology and patient
satisfaction but not with processes of care, patient outcomes, or
community benefit.
JAMA Intern Med. 2014;174(1):61-67.
doi:10.1001/jamainternmed.2013.11537
Published online October 14, 2013.
Invited Commentary page 68
Supplemental content at
jamainternalmedicine.com
Author Affiliations: Department of
Health Policy and Management,
Harvard School of Public Health,
Boston, Massachusetts (Joynt, Le,
Jha); Department of Biostatistics,
Harvard School of Public Health,
Boston, Massachusetts (Orav);
Cardiovascular Division, Department
of Medicine, Brigham and Women’s
Hospital, Boston, Massachusetts
(Joynt); Cardiology and Vascular
Medicine Section, Department of
Medicine, Veterans Affairs Boston
Healthcare System, Boston,
Massachusetts (Joynt); Division of
General Internal Medicine,
Department of Medicine, Brigham
and Women’s Hospital, Boston,
Massachusetts (Orav, Jha); General
Internal Medicine Section,
Department of Medicine, Veterans
Affairs Boston Healthcare System,
Boston, Massachusetts (Jha);
currently a medical student,
University of California, San Francisco
(Le).
Corresponding Author: Ashish K.
Jha, MD, MPH, Department of Health
Policy and Management, Office 405,
Harvard School of Public Health, 677
Huntington Ave, Boston, MA 02115
([email protected]).
Research
Original Investigation
jamainternalmedicine.com JAMA Internal Medicine January
2014 Volume 174, Number 1 61
Copyright 2014 American Medical Association. All rights
reserved.
Downloaded From: https://jamanetwork.com/ by Jennifer
Naegele on 06/29/2020
Copyright 2014 American Medical Association. All rights
reserved.
what is the range of compensation for CEOs of nonprofit hos-
pitals in the United States? Second, which structural and or-
ganizational factors of hospitals are associated with the com-
pensation of CEOs? Finally, to what extent is hospital CEO pay
associated with the institution’s financial performance, tech-
nologic capabilities, patient outcomes, or metrics of commu-
nity benefit provided?
Methods
Data Sources
We linked 7 data sources: (1) publicly available Form 990 tax
returns compiled by GuideStar (http://www.guidestar.org) for
US hospitals filing as nonprofit entities in 2009; (2) the Ameri-
can Hospital Association annual survey; (3) rural-urban com-
muting area codes9; (4) Hospital Compare data, which con-
tain process of care measures and the Hospital Consumer
Assessment of Healthcare Providers and Systems survey; (5)
the 2009 Medicare Provider Analysis and Review File; (6)
Medi-
care cost reports; and (7) the Medicare impact file. This study
was approved by the Office of Human Research Administra-
tion at the Harvard School of Public Health.
Identifying Executives
From the 990 forms, we identified 1877 CEOs overseeing 2681
nonfederal, private, nonprofit acute-care hospitals in the
United States. These hospitals comprise more than 98% of pri-
vate nonprofit US hospitals.
Structural and Organizational Measures
We hypothesized that CEOs who oversaw more complex or-
ganizations (measured by number of beds, number of hospi-
tals overseen, membership in a system, or being a major teach-
ing hospital) would be compensated more highly than others.
We also examined other characteristics, including a hospi-
tal’s proportion of Medicare patients (a marker of payer mix)
and its disproportionate share hospital index (a measure of the
proportion of low-income patients), hypothesizing that the
CEOs of hospitals with a less favorable payer mix might re-
ceive lower compensation.
Financial Performance Measures
We examined 4 measures of financial performance: total mar-
gin (calculated from the Medicare Cost Reports as the ratio of
net income to net revenue plus other income), liquidity (the
ratio of current assets to total liabilities), capitalization (the ra-
tio of fund balances to total assets) all representing perfor-
mance in fiscal year 2008,10 and occupancy rate (from the
American Hospital Association survey representing calendar
year 2008). We examined hospital performance in 2008 be-
cause we assumed that the prior year’s performance would in-
fluence the subsequent year’s compensation.
Technologic Measures
For each hospital, we used a well-validated technologic
index11,12 that combines the presence of several advanced
tech-
nologies into a single score (eg, positron-emission tomogra-
phy, magnetic resonance imaging, and the capability of per-
forming complex operations) (Supplement [eTable 1]). We
assigned higher weights to technologies that are relatively rare.
Quality-of-Care Measures
We selected a set of quality metrics that are endorsed by the
National Quality Forum13 and used by the Centers for Medi-
care and Medicaid Services for public reporting and have sub-
sequently formed the basis for new mandatory federal pay-
for-performance initiatives, such as value-based purchasing14
and the Hospital Readmission Reduction Program. Although
these metrics are not comprehensive, they represent the best
and most widely used measures of hospital quality. For each
hospital, we calculated a composite measure of performance
on processes of care for acute myocardial infarction, conges-
tive heart failure, and pneumonia for calendar year 2008
(Supplement [eTable 2]).15,16 To assess patient satisfaction,
we
used Hospital Consumer Assessment of Healthcare Providers
and Systems data and focused on overall satisfaction (the pro-
portion rating the hospital a 9 or 10 on a 10-point scale). We
built patient-level hierarchical logistic regression models to cal-
culate 30-day risk-adjusted mortality and readmission rates for
patients admitted with acute myocardial infarction, conges-
tive heart failure, or pneumonia in calendar year 2008, ex-
cluding December because 30-day outcomes crossed into 2009
(Supplement [eTables 3 and 4]). We built composite mortality
and readmissions measures across the 3 conditions for each
hospital using indirect standardization.
Community Benefit Measures
We used hospital-reported 990 forms to determine charity care
and other community benefits provided in calendar year 2009,
which are self-reported as a proportion of total hospital ex-
penditures. Charity care represents uncompensated care, un-
reimbursed Medicaid care, and unreimbursed costs from other
means-tested government programs. Other community ben-
efits include community health services, health profession-
als’ education, subsidized health services, research, and con-
tributions to charitable organizations.17
Primary Outcome
Our primary outcome was CEO compensation in calendar year
2009. For each executive, we used the 990 forms to obtain re-
portable compensation from the primary organization (includ-
ing benefits and deferred compensation), reportable compen-
sation from related organizations (ie, a foundation associated
with a hospital), and estimated other compensation from the
primary and related organizations. We summed these ele-
ments to determine each CEO’s total compensation package.
To account for regional variations in the cost of care, we de-
flated each CEO’s compensation by the Medicare Wage In-
dex, used by Medicare to adjust prospective payments to hos-
pitals for hospital wage level differences between metropolitan
statistical areas.
Statistical Analysis
We began by plotting the distribution of CEO compensation.
We then calculated summary statistics for the characteristics
Research Original Investigation Compensation of CEOs at
Nonprofit Hospitals
62 JAMA Internal Medicine January 2014 Volume 174, Number
1 jamainternalmedicine.com
Copyright 2014 American Medical Association. All rights
reserved.
Downloaded From: https://jamanetwork.com/ by Jennifer
Naegele on 06/29/2020
Copyright 2014 American Medical Association. All rights
reserved.
of the hospitals that each CEO managed, breaking the sample
into the lowest decile, middle 8 deciles, and top decile of com-
pensation. In cases in which executives managed multiple hos-
pitals, we averaged hospital characteristics weighted by the
number of beds. Thus, analyses were carried out at the CEO
level, with each CEO assigned the aggregate characteristics of
the beds they managed. We examined the relationship be-
tween wage index–deflated CEO compensation and hospital
structural characteristics, using multivariable linear regres-
sion models with CEO compensation as the outcome and each
of the key hospital characteristics as predictors including num-
ber of beds overseen, number of hospitals overseen, teaching
status (major, minor, or nonteaching), census region, loca-
tion (urban vs rural), critical access status, proportion of Medi-
care patients, and disproportionate share hospital index.
Next, we examined whether a hospital’s performance on
measures of financial performance, technology index, qual-
ity and patient outcomes, or community benefit was associ-
ated with CEO compensation. We individually examined each
metric in models adjusted for the structural characteristics out-
lined above and then proceeded to our full model including
all of these variables. Because of interrelationships between
the quality measures,18,19 we tested for but found no evi-
dence of collinearity (Supplement [eTable 5]). We used the lin-
ear models to calculate adjusted compensation for low per-
formers (those at the 25th percentile) and high performers (75th
percentile) on each metric.
Because we were concerned that focusing on just 3 condi-
tions for our mortality outcomes may not adequately capture
the breadth of hospital care provided, we also created, as a sen-
sitivity analysis, a 19-condition composite of medical and sur-
gical mortality rates that comprise a large proportion of hospi-
tal care20 (Supplement [eTable 6]). We compared the
relationship
between CEO pay and outcomes across these 19 conditions.
We conducted additional sensitivity analyses. Because CEOs’
compensation might be based on improvement over time rather
than performance in a single year, we conducted analyses using
the change in financial performance and quality performance
from 2006 to 2008 as our predictor; for patient satisfaction
scores,
which became publicly available in 2007, we used change from
2007 to 2008. Finally, because the data on CEO pay were some-
what right-skewed and because the factors that affect CEO pay
at wealthy hospitals may be different from those that affect
CEO
pay among low-paying hospitals, we repeated our analyses
using
quantile regression at the 25th, 50th, and 75th percentiles.
We considered a 2-tailed value of P < .05 to be significant.
Analyses were performed using commercial software (Stata,
version 12.1; StataCorp).
Results
We identified 1877 executives responsible for 2681 hospitals.
The CEOs had an unadjusted mean compensation of $595 781
Figure. Distribution of Chief Executive Officer Pay
0
<50 000 1 000 000
1 500 000
2 000 000 ≥3 000 000
10.0
9.0
Ex
ec
ut
iv
es
, %
Compensation, $
8.0
7.0
6.0
5.0
4.0
3.0
2.0
1.0
500 000100 000 1 100 000
1 600 000
2 100 000
600 000200 000 1 200 000
1 700 000
2 200 000
700 000300 000 1 300 000
1 800 000
2 300 000
800 000400 000 1 400 000
1 900 000
2 400 000
900 000 2 500 000 2 700 000
2 800 000
2 900 000
2 600 000
Histogram of chief executive officer pay at US nonprofit
hospitals in calendar year 2009.
Compensation of CEOs at Nonprofit Hospitals Original
Investigation Research
jamainternalmedicine.com JAMA Internal Medicine January
2014 Volume 174, Number 1 63
Copyright 2014 American Medical Association. All rights
reserved.
Downloaded From: https://jamanetwork.com/ by Jennifer
Naegele on 06/29/2020
Copyright 2014 American Medical Association. All rights
reserved.
and a median compensation of $404 938 in 2009. Distribu-
tion of the compensation is shown in the Figure. The CEOs in
the lowest decile of compensation, with a median compensa-
tion of $117 933, were largely responsible for small, nonteach-
ing hospitals in rural areas, most frequently in the Midwest
(Table 1). The CEOs in the highest decile of compensation, with
a median compensation of $1 662 548, oversaw larger, urban
hospitals, which were more often major or minor teaching hos-
pitals. Overall median hospital margins were 3.5%, and me-
dian occupancy rate was 63.0% (Table 2). Hospitals’ median
performance on process measures was 93.4% and on patient
satisfaction, 65.0%. Median charity care and other commu-
nity benefit comprised 1.6% and 1.4% of total hospital expen-
ditures, respectively.
Hospital Characteristics and CEO Compensation
In multivariable analyses, compensation was higher for CEOs
managing more beds ($550 per additional bed; 95% CI, 429-
671; P < .001) (Table 3). Managing more hospitals was also as-
sociated with higher pay ($32 609 per additional hospital; 95%
CI, 5154-60 063; P = .02). The CEOs of major teaching hospi-
tals were paid $425 078 more (95% CI, 315 238-534 918; P <
.001)
than were CEOs of nonteaching hospitals. The CEOs of hospi-
tals with a higher proportion of poor patients and Medicare pa-
tients were generally compensated less than were other CEOs
(Table 3).
Hospital Financial Performance and CEO Compensation
Hospital financial performance was not significantly associ-
ated with CEO compensation in our fully adjusted models
(Table 4). High performers on total margins, for example,
paid their CEOs similarly to poor performers (difference,
$7045; 95% CI, −16 463 to 30 553; P = .56), and the relation-
ships for liquidity, capitalization, and occupancy rate were
also nonsignificant.
Advanced Technologies and CEO Compensation
The presence of higher levels of advanced technology, as
measured by a technology index, was associated with sub-
stantially higher CEO compensation. High performers on
the technology index received $135 862 additional pay com-
pared w ith poor performers (95% CI, 80 744-190 980;
P < .001).
Hospital Quality Performance and CEO Compensation
We found no significant association between performance on
process quality, risk-adjusted mortality, or readmission rates
and CEO compensation (Table 4). High performers on mortal-
ity rates paid their CEOs $4667 less than poor performers (95%
CI, −27 457 to 18 123; P = .69). However, hospitals with higher
patient satisfaction scores compensated their CEOs more than
did hospitals with lower scores (difference, $51 706; 95% CI,
15 166 to 88 247; P = .006).
Table 1. Characteristics of Hospitals Associated With Each
Chief Executive Officer
Characteristic
Decile of Compensation
Lowest 2-9 Highest
No. of officers 188 1502 187
No. of hospitals 189 1841 651
Total compensation, $
Median (IQR) 117 933 (89 221-136 390) 405 167 (264 196-635
226) 1 662 548 (1 358 702-2 327 567)
Mean (SD) 106 324 (38 985) 469 096 (254 133) 2 105 394 (1
201 963)
No. of beds
Median (IQR) 39 (25-73) 136 (61-256) 234 (80-451)
Mean (SD) 62 (76) 185 (169) 310 (290)
Region, %
Northeast 9.6 26.2 23.0
Midwest 50.5 34.0 32.1
South 23.4 26.4 31.5
West 16.5 13.4 13.4
Teaching, %
Major 0.0 6.8 33.8
Minor 12.8 25.2 33.6
Nonteaching 87.2 68.0 32.6
Rural-urban commuting area, %
Urban 12.8 53.9 88.7
Suburban 3.7 4.4 0.9
Large rural town 8.5 19.2 6.6
Small town/isolated rural 75.0 22.5 3.7
Medicare patients, % 53.2 (49.0-67.2) 48.6 (42.9-54.6) 41.8
(38.0-48.5)
Disproportionate share index 0.0 (0.0-0.0) 17.2 (3.6-26.3) 21.5
(12.2-30.3)
Critical access hospital 69.7 18.3 2.8
Abbreviation: IQR, interquartile range.
Research Original Investigation Compensation of CEOs at
Nonprofit Hospitals
64 JAMA Internal Medicine January 2014 Volume 174, Number
1 jamainternalmedicine.com
Copyright 2014 American Medical Association. All rights
reserved.
Downloaded From: https://jamanetwork.com/ by Jennifer
Naegele on 06/29/2020
Copyright 2014 American Medical Association. All rights
reserved.
Community Benefit and CEO Compensation
We found no association between charity care and CEO com-
pensation (−$52 for high performers vs poor performers; 95%
CI, −441 to 337; P = .79) or between community benefit and
CEO
compensation ($0 additional compensation for high perform-
ers vs poor performers, 95% CI, −3 to 3; P = .88).
Sensitivity Analysis
When we substituted a 19-condition composite mortality
rate into the model, we found no association with CEO pay
(−$453 for high vs low performers; 95% CI, −35 992 to
35 086; P = .98) (Supplement [eTable 7]). Using changes in
financial performance and quality performance from 2006
to 2008 as predictors, technology was the only factor sig-
nificantly associated with CEO compensation (Supplement
[eTable 8]).
When we used quantile regression to examine the dis-
tribution of CEO salaries based on varying levels of financial
and quality performance, we found relatively similar results
in all but 2 instances. Whereas we found little relationship
between total margins and CEO pay in our overall analyses,
we found that the 25th percentile and median CEO salaries
were higher at high-margin hospitals compared with low-
margin hospitals (Supplement [eTables 9 and 10]). There
was no relationship between hospital total margin and CEO
pay at the upper end of the pay scale (Supplement [eTable
11]). Similarly, we found that the 25th percentile of CEO
compensation was somewhat higher among hospitals with
high performance on process quality measures compared
with hospitals with poor performance on the process quality
measures. The difference in median salaries was even
smaller and not statistically significant, and there was no
significant difference based on process quality scores at the
upper end of the CEO pay scale.
Discussion
We examined the compensation of CEOs of nonprofit US hos-
pitals and found that executives who oversaw larger teaching
hospitals were the most highly compensated. Furthermore,
even after accounting for these and other structural factors, a
higher level of advanced technologies was associated with sig-
nificantly higher compensation. Although we found no rela-
tionship with hospital performance on standard process or out-
come metrics, patient satisfaction had a modest but significant
relationship with CEO compensation. Finally, despite the fact
that we examined nonprofit institutions whose tax-exempt sta-
tus is based on their ability to demonstrate community ben-
efit, we found no relationship between the degree of that ben-
efit and CEO compensation.
Among the quality metrics we examined, only patient sat-
isfaction was consistently associated with CEO compensa-
tion. The factors that shape the compensation package of CEOs
likely reflect a combination of boards’ awareness of hospital
performance on key metrics and its assessment of the ability
of the CEO to influence those metrics. Boards may have an
easier time assessing patient satisfaction than other quality
metrics, such as risk-adjusted mortality rates, or may see pa-
tient satisfaction as a key measure of organizational perfor-
mance and marketability. Of course, it is possible that boards
reward CEOs on other factors that we could not measure, such
as staff satisfaction.
Table 2. Hospital Performance
Characteristic % Median (IQR)
Hospital financial outcomes
Total margins 3.5 (0.1-7.5)
Liquidity 200.1 (135.3-298.4)
Capitalization 51.6 (33.5-66.4)
Occupancy rate 63.0 (50.3-72.8)
Presence of advanced technologies
Technology index 0.406 (0.246-0.609)
Hospital quality
Process measures, 2008 93.4 (89.7-95.5)
Patient satisfaction, 2008 65.0 (60.0-70.0)
Risk-adjusted mortality rates, 2008 12.2 (10.3-14.6)
Risk-adjusted readmission rates, 2008 21.2 (18.8-24.3)
Community benefit
Charity care provided,
% of total expenditures
1.6 (0.7-2.8)
Other community benefit,
% of total expenditures
1.4 (0.5-3.3)
Abbreviation: IQR, interquartile range.
Table 3. Hospital Characteristics
and Chief Executive Officer Compensation
Characteristic
Additional Compensationa
(95% CI)
P
Value
Mean wage-adjusted
compensation, $
595 781 (not applicable)
No. of beds, $ 550 (429 to 671) <.001
No. of hospitals, $ 32 609 (5154 to 60 063) .02
Region, $
Northeast Reference
Midwest 29 206 (−36 476 to 94 888) .38
South 77 449 (9070 to 145 829) .03
West 32 533 (−51 917 to 116 983) .45
Teaching, $
Not teaching Reference
Major 425 078 (315 238 to 534 918) <.001
Minor 151 352 (87 899 to 214 805) <.001
Rural-urban commuting area, $
Urban Reference
Suburban −137 690 (−272 195 to −3184) .045
Large rural town −124 491 (−198 703 to −50 279) .001
Small town/isolated rural −195 553 (−284 305 to −106 801)
<.001
Critical access hospital, $ −1156 (−136 390 to 134 078) .99
Disproportionate share index, $ −38 938 (−59 621 to −18 254)
.000
Percent Medicare patients, $ −21 112 (−43 137 to 913) .060
a For continuous predictors, additional compensation represents
the change in
compensation associated with a 10% change in the independent
variable.
Model is adjusted for all listed covariates.
Compensation of CEOs at Nonprofit Hospitals Original
Investigation Research
jamainternalmedicine.com JAMA Internal Medicine January
2014 Volume 174, Number 1 65
Copyright 2014 American Medical Association. All rights
reserved.
Downloaded From: https://jamanetwork.com/ by Jennifer
Naegele on 06/29/2020
Copyright 2014 American Medical Association. All rights
reserved.
There was no consistent association between CEO pay and
more traditional measures of quality, such as adherence to pro-
cess measures or patient outcomes. In one set of sensitivity
analyses, we found that the low end (25th percentile) of CEO
pay at hospitals with better adherence to process measures was
somewhat higher than at hospitals with worse adherence to
process measures, although the difference was small. This
could represent a chance finding, or it might suggest that at
hospitals with lower-paid CEOs, there appears to be a little
more
attention given to process quality metrics.
Given that hospital boards have a fiduciary responsibility
to represent the welfare of the community, they could make
the link between their CEO’s pay and hospital quality perfor-
mance more explicit. It may be that they have not done so be-
cause they may believe that these quality metrics are not ad-
equate measures of CEO performance. Whether linking CEO
compensation to quality metrics would lead to better care is
unknown; an alternative possibility is that linking CEO com-
pensation explicitly to quality metrics could have unin-
tended consequences, such as reducing hospitals’ incentive to
provide to medically or socially complex populations.
We were surprised to find only weak nonsignificant rela-
tionships between CEO pay and financial performance. How-
ever, indirect measures of financial performance, including
payer mix and advanced technology, were associated with CEO
compensation. Furthermore, we found that at the lower half
of the pay scale, there appeared to be a modest relationship
between hospital total margins and CEO pay. It may be that
total
margins play a role in CEO salary up to a point, beyond which,
as compensation rises, it has little bearing on measures of qual-
ity or financial performance. The fact that hospitals with higher
levels of technology paid their CEOs more has several poten-
tial explanations. First, the advanced technologies may iden-
tify hospitals that provide more “complex” care and there-
fore need to pay more to attract a leader who can manage a
complex organization. Alternatively, boards may value their
hospitals being seen as technologic leaders in the commu-
nity. Finally, high levels of technology may simply be a reflec-
tion of financial health: hospitals with the resources and ac-
cess to capital to purchase advanced technologies may be
rewarding their CEOs for this success.
Although there has been prior work21 examining the
relationship between CEO pay and firm performance
broadly, there have been few recent data on the compensa-
tion of hospital CEOs. Four large studies using data from the
1990s found that CEO compensation was linked to hospital
financial performance,4 profit status,5 size, and location6
and only somewhat to quality.22 Two recent studies of non-
profit CEO compensation, one in Connecticut7 and one in
New Hampshire,8 also found no relationship between CEO
p ay a n d q u a l it y o r c o m m u n it y b e n e f it , a l t h o u
g h t h e
samples were small (29 and 23 hospitals, respectively). We
are unaware of any recent data on national patterns of hos-
pital CEO compensation.
There are limitations to our study. To assess CEO com-
pensation, we relied on data that, although audited, have
not been extensively validated. Although the 990 forms are
intended to include all compensation, even that which is
indirect or in-kind, this type of compensation may be under-
reported. Hospitals may not consistently use the same defi-
nitions of uncompensated care or may inflate costs attrib-
uted to charity by using list prices for this care.23 The quality
measures we assessed were those that are publicly available
and that are components of federal pay-for-performance
programs but may have their own limitations. For example,
patient satisfaction metrics represent a combination of hos-
pital performance and patient expectations. Furthermore,
our selected quality metrics, although likely reflective of
overall quality at each hospital, are not exhaustive; it is pos-
sible that hospitals track internal quality metrics, such as
infection rates, and that these may be more closely corre-
lated with financial remuneration. Our metrics of financial
performance may not wholly reflect the financial health of
the institution, although we aimed to include a set of met-
Table 4. Hospital Financial Outcomes, Technology, Quality, and
Community Benefit
and Chief Executive Officer Compensationa
Characteristic
Low
…
SE571 Course Project: Security Assessment and
Recommendations
Scenarios
Scenario One
Company Overview
Aircraft
Solution
s(AS)is a recognized leader in the design and fabrication of
component products and services for companies in the
electronics, commercial, defense, and aerospace industry.
Located in Southern California, AS has a dedicated, trained
workforce and maintains a large capacity plant and extensive
equipment to meet customer requirements. Much of the
equipment is automated to increase production while reducing
costs. The company's workforce has a large skill base: design
engineers, programmers, machinists, and assembly personnel to
work its highly-automated production systems.
The mission of AS is to provide customer success through
machined products and related services, and to meet cost,
quality, and schedule requirements.
The company strategy is to offer low-cost design and computer-
aided modeling packages to customers to reduce their
development expenses. AS will help the customer through all
phases of new product deployment, from initial prototypes
through final large-volume production and assembly. By
involving itself in all phases of customer product development,
AS hopes to establish long-term relationships and secure
repeated follow-on business with its customers. In addition, AS
continues to invest heavily in workforce education and training,
so as to improve capability to serve its customers.
Company Geographic Layout
Aircraft

Contenu connexe

Similaire à Copyright 2014 American Medical Association. All rights reserv.docx

1) Write a paper of 900  words regarding the statistical significanc.docx
1) Write a paper of 900  words regarding the statistical significanc.docx1) Write a paper of 900  words regarding the statistical significanc.docx
1) Write a paper of 900  words regarding the statistical significanc.docxlindorffgarrik
 
Standardized Bedside ReportingOne of the goals of h.docx
Standardized Bedside ReportingOne of the goals of h.docxStandardized Bedside ReportingOne of the goals of h.docx
Standardized Bedside ReportingOne of the goals of h.docxwhitneyleman54422
 
Payer Mix and EHR Adoptionin HospitalsDong Yeong Shin, doc.docx
Payer Mix and EHR Adoptionin HospitalsDong Yeong Shin, doc.docxPayer Mix and EHR Adoptionin HospitalsDong Yeong Shin, doc.docx
Payer Mix and EHR Adoptionin HospitalsDong Yeong Shin, doc.docxdanhaley45372
 
Coyne and Messina Articles AnalysisAs an example guideline, re.docx
Coyne and Messina Articles AnalysisAs an example guideline, re.docxCoyne and Messina Articles AnalysisAs an example guideline, re.docx
Coyne and Messina Articles AnalysisAs an example guideline, re.docxfaithxdunce63732
 
Job Redesign For Expanded HIM Functions Case Study...
Job Redesign For Expanded HIM Functions Case Study...Job Redesign For Expanded HIM Functions Case Study...
Job Redesign For Expanded HIM Functions Case Study...Amanda Hengel
 
Assessment of healthcare providers’ collaboration at governmental hospitals
Assessment of healthcare providers’ collaboration at governmental hospitalsAssessment of healthcare providers’ collaboration at governmental hospitals
Assessment of healthcare providers’ collaboration at governmental hospitalsiyad shaqura
 
Ihi Engaging Physicians White Paper2009
Ihi Engaging Physicians White Paper2009Ihi Engaging Physicians White Paper2009
Ihi Engaging Physicians White Paper2009primary
 
Healthcare services quantitative research
Healthcare services quantitative researchHealthcare services quantitative research
Healthcare services quantitative researchSnwareHealth
 
THIS IS THE FEEDBACK I RECEEIVED. Only one patient responded to my.docx
THIS IS THE FEEDBACK I RECEEIVED. Only one patient responded to my.docxTHIS IS THE FEEDBACK I RECEEIVED. Only one patient responded to my.docx
THIS IS THE FEEDBACK I RECEEIVED. Only one patient responded to my.docxjuliennehar
 
Case StudyHigh-Performing Health Care Organization • March 2.docx
Case StudyHigh-Performing Health Care Organization • March 2.docxCase StudyHigh-Performing Health Care Organization • March 2.docx
Case StudyHigh-Performing Health Care Organization • March 2.docxtroutmanboris
 
The Physician Value Index. A Tool for Effective Physician Integration.
The Physician Value Index. A Tool for Effective Physician Integration. The Physician Value Index. A Tool for Effective Physician Integration.
The Physician Value Index. A Tool for Effective Physician Integration. pscisolutions
 
PCOMS and an Acute Care Inpatient Unit: Quality Improvement and Reduced Readm...
PCOMS and an Acute Care Inpatient Unit: Quality Improvement and Reduced Readm...PCOMS and an Acute Care Inpatient Unit: Quality Improvement and Reduced Readm...
PCOMS and an Acute Care Inpatient Unit: Quality Improvement and Reduced Readm...Barry Duncan
 
Care by design magill lloyd successful turnaround
Care by design magill lloyd successful turnaroundCare by design magill lloyd successful turnaround
Care by design magill lloyd successful turnaroundPaul Grundy
 
Evaluating Transitions of Care Processes
Evaluating Transitions of Care ProcessesEvaluating Transitions of Care Processes
Evaluating Transitions of Care Processeshedavidson
 
Exploring the Impact of Information System Introduction
Exploring the Impact of Information System IntroductionExploring the Impact of Information System Introduction
Exploring the Impact of Information System IntroductionSuelette Dreyfus
 
Growth of Research Centers Focused on Quality Improvement report_FINAL
Growth of Research Centers Focused on Quality Improvement report_FINALGrowth of Research Centers Focused on Quality Improvement report_FINAL
Growth of Research Centers Focused on Quality Improvement report_FINALNatalie Fahlberg
 
Performance Evaluations Related to Patient Outcomes: Con
Performance Evaluations Related to Patient Outcomes: ConPerformance Evaluations Related to Patient Outcomes: Con
Performance Evaluations Related to Patient Outcomes: ConKristin Botzer
 
Bostick- HPOE Eliminating Health Care Disparities
Bostick- HPOE Eliminating Health Care DisparitiesBostick- HPOE Eliminating Health Care Disparities
Bostick- HPOE Eliminating Health Care DisparitiesNathan (Andy) Bostick
 

Similaire à Copyright 2014 American Medical Association. All rights reserv.docx (20)

1) Write a paper of 900  words regarding the statistical significanc.docx
1) Write a paper of 900  words regarding the statistical significanc.docx1) Write a paper of 900  words regarding the statistical significanc.docx
1) Write a paper of 900  words regarding the statistical significanc.docx
 
Standardized Bedside ReportingOne of the goals of h.docx
Standardized Bedside ReportingOne of the goals of h.docxStandardized Bedside ReportingOne of the goals of h.docx
Standardized Bedside ReportingOne of the goals of h.docx
 
Payer Mix and EHR Adoptionin HospitalsDong Yeong Shin, doc.docx
Payer Mix and EHR Adoptionin HospitalsDong Yeong Shin, doc.docxPayer Mix and EHR Adoptionin HospitalsDong Yeong Shin, doc.docx
Payer Mix and EHR Adoptionin HospitalsDong Yeong Shin, doc.docx
 
Coyne and Messina Articles AnalysisAs an example guideline, re.docx
Coyne and Messina Articles AnalysisAs an example guideline, re.docxCoyne and Messina Articles AnalysisAs an example guideline, re.docx
Coyne and Messina Articles AnalysisAs an example guideline, re.docx
 
Job Redesign For Expanded HIM Functions Case Study...
Job Redesign For Expanded HIM Functions Case Study...Job Redesign For Expanded HIM Functions Case Study...
Job Redesign For Expanded HIM Functions Case Study...
 
Assessment of healthcare providers’ collaboration at governmental hospitals
Assessment of healthcare providers’ collaboration at governmental hospitalsAssessment of healthcare providers’ collaboration at governmental hospitals
Assessment of healthcare providers’ collaboration at governmental hospitals
 
Ihi Engaging Physicians White Paper2009
Ihi Engaging Physicians White Paper2009Ihi Engaging Physicians White Paper2009
Ihi Engaging Physicians White Paper2009
 
Healthcare services quantitative research
Healthcare services quantitative researchHealthcare services quantitative research
Healthcare services quantitative research
 
THIS IS THE FEEDBACK I RECEEIVED. Only one patient responded to my.docx
THIS IS THE FEEDBACK I RECEEIVED. Only one patient responded to my.docxTHIS IS THE FEEDBACK I RECEEIVED. Only one patient responded to my.docx
THIS IS THE FEEDBACK I RECEEIVED. Only one patient responded to my.docx
 
Case StudyHigh-Performing Health Care Organization • March 2.docx
Case StudyHigh-Performing Health Care Organization • March 2.docxCase StudyHigh-Performing Health Care Organization • March 2.docx
Case StudyHigh-Performing Health Care Organization • March 2.docx
 
Hospital cost
Hospital costHospital cost
Hospital cost
 
The Physician Value Index. A Tool for Effective Physician Integration.
The Physician Value Index. A Tool for Effective Physician Integration. The Physician Value Index. A Tool for Effective Physician Integration.
The Physician Value Index. A Tool for Effective Physician Integration.
 
PCOMS and an Acute Care Inpatient Unit: Quality Improvement and Reduced Readm...
PCOMS and an Acute Care Inpatient Unit: Quality Improvement and Reduced Readm...PCOMS and an Acute Care Inpatient Unit: Quality Improvement and Reduced Readm...
PCOMS and an Acute Care Inpatient Unit: Quality Improvement and Reduced Readm...
 
Using technology to improve quality
Using technology to improve qualityUsing technology to improve quality
Using technology to improve quality
 
Care by design magill lloyd successful turnaround
Care by design magill lloyd successful turnaroundCare by design magill lloyd successful turnaround
Care by design magill lloyd successful turnaround
 
Evaluating Transitions of Care Processes
Evaluating Transitions of Care ProcessesEvaluating Transitions of Care Processes
Evaluating Transitions of Care Processes
 
Exploring the Impact of Information System Introduction
Exploring the Impact of Information System IntroductionExploring the Impact of Information System Introduction
Exploring the Impact of Information System Introduction
 
Growth of Research Centers Focused on Quality Improvement report_FINAL
Growth of Research Centers Focused on Quality Improvement report_FINALGrowth of Research Centers Focused on Quality Improvement report_FINAL
Growth of Research Centers Focused on Quality Improvement report_FINAL
 
Performance Evaluations Related to Patient Outcomes: Con
Performance Evaluations Related to Patient Outcomes: ConPerformance Evaluations Related to Patient Outcomes: Con
Performance Evaluations Related to Patient Outcomes: Con
 
Bostick- HPOE Eliminating Health Care Disparities
Bostick- HPOE Eliminating Health Care DisparitiesBostick- HPOE Eliminating Health Care Disparities
Bostick- HPOE Eliminating Health Care Disparities
 

Plus de dickonsondorris

Copyright © eContent Management Pty Ltd. Health Sociology Revi.docx
Copyright © eContent Management Pty Ltd. Health Sociology Revi.docxCopyright © eContent Management Pty Ltd. Health Sociology Revi.docx
Copyright © eContent Management Pty Ltd. Health Sociology Revi.docxdickonsondorris
 
Copyright © Pearson Education 2010 Digital Tools in Toda.docx
Copyright © Pearson Education 2010 Digital Tools in Toda.docxCopyright © Pearson Education 2010 Digital Tools in Toda.docx
Copyright © Pearson Education 2010 Digital Tools in Toda.docxdickonsondorris
 
Copyright © Jen-Wen Lin 2018 1 STA457 Time series .docx
Copyright © Jen-Wen Lin 2018   1 STA457 Time series .docxCopyright © Jen-Wen Lin 2018   1 STA457 Time series .docx
Copyright © Jen-Wen Lin 2018 1 STA457 Time series .docxdickonsondorris
 
Copyright © John Wiley & Sons, Inc. All rights reserved..docx
Copyright © John Wiley & Sons, Inc. All rights reserved..docxCopyright © John Wiley & Sons, Inc. All rights reserved..docx
Copyright © John Wiley & Sons, Inc. All rights reserved..docxdickonsondorris
 
Copyright © by The McGraw-Hill Companies, Inc. The Aztec Accou.docx
Copyright © by The McGraw-Hill Companies, Inc. The Aztec Accou.docxCopyright © by The McGraw-Hill Companies, Inc. The Aztec Accou.docx
Copyright © by The McGraw-Hill Companies, Inc. The Aztec Accou.docxdickonsondorris
 
Copyright © Cengage Learning. All rights reserved. CHAPTE.docx
Copyright © Cengage Learning.  All rights reserved. CHAPTE.docxCopyright © Cengage Learning.  All rights reserved. CHAPTE.docx
Copyright © Cengage Learning. All rights reserved. CHAPTE.docxdickonsondorris
 
Copyright © by Holt, Rinehart and Winston. All rights reserved.docx
Copyright © by Holt, Rinehart and Winston. All rights reserved.docxCopyright © by Holt, Rinehart and Winston. All rights reserved.docx
Copyright © by Holt, Rinehart and Winston. All rights reserved.docxdickonsondorris
 
Copyright © 2020 by Jones & Bartlett Learning, LLC, an Ascend .docx
Copyright © 2020 by Jones & Bartlett Learning, LLC, an Ascend .docxCopyright © 2020 by Jones & Bartlett Learning, LLC, an Ascend .docx
Copyright © 2020 by Jones & Bartlett Learning, LLC, an Ascend .docxdickonsondorris
 
Copyright © 2019, American Institute of Certified Public Accou.docx
Copyright © 2019, American Institute of Certified Public Accou.docxCopyright © 2019, American Institute of Certified Public Accou.docx
Copyright © 2019, American Institute of Certified Public Accou.docxdickonsondorris
 
Copyright © 2018 Pearson Education, Inc. All Rights ReservedChild .docx
Copyright © 2018 Pearson Education, Inc. All Rights ReservedChild .docxCopyright © 2018 Pearson Education, Inc. All Rights ReservedChild .docx
Copyright © 2018 Pearson Education, Inc. All Rights ReservedChild .docxdickonsondorris
 
Copyright © 2018 Pearson Education, Inc. C H A P T E R 6.docx
Copyright © 2018 Pearson Education, Inc. C H A P T E R  6.docxCopyright © 2018 Pearson Education, Inc. C H A P T E R  6.docx
Copyright © 2018 Pearson Education, Inc. C H A P T E R 6.docxdickonsondorris
 
Copyright © 2018 Capella University. Copy and distribution o.docx
Copyright © 2018 Capella University. Copy and distribution o.docxCopyright © 2018 Capella University. Copy and distribution o.docx
Copyright © 2018 Capella University. Copy and distribution o.docxdickonsondorris
 
Copyright © 2018 Pearson Education, Inc.C H A P T E R 3.docx
Copyright © 2018 Pearson Education, Inc.C H A P T E R  3.docxCopyright © 2018 Pearson Education, Inc.C H A P T E R  3.docx
Copyright © 2018 Pearson Education, Inc.C H A P T E R 3.docxdickonsondorris
 
Copyright © 2018 by Steven Levitsky and Daniel.docx
Copyright © 2018 by Steven Levitsky and Daniel.docxCopyright © 2018 by Steven Levitsky and Daniel.docx
Copyright © 2018 by Steven Levitsky and Daniel.docxdickonsondorris
 
Copyright © 2017, 2014, 2011 Pearson Education, Inc. All Right.docx
Copyright © 2017, 2014, 2011 Pearson Education, Inc. All Right.docxCopyright © 2017, 2014, 2011 Pearson Education, Inc. All Right.docx
Copyright © 2017, 2014, 2011 Pearson Education, Inc. All Right.docxdickonsondorris
 
Copyright © 2017 Wolters Kluwer Health Lippincott Williams.docx
Copyright © 2017 Wolters Kluwer Health  Lippincott Williams.docxCopyright © 2017 Wolters Kluwer Health  Lippincott Williams.docx
Copyright © 2017 Wolters Kluwer Health Lippincott Williams.docxdickonsondorris
 
Copyright © 2016, 2013, 2010 Pearson Education, Inc. All Right.docx
Copyright © 2016, 2013, 2010 Pearson Education, Inc. All Right.docxCopyright © 2016, 2013, 2010 Pearson Education, Inc. All Right.docx
Copyright © 2016, 2013, 2010 Pearson Education, Inc. All Right.docxdickonsondorris
 
Copyright © 2017 by University of Phoenix. All rights rese.docx
Copyright © 2017 by University of Phoenix. All rights rese.docxCopyright © 2017 by University of Phoenix. All rights rese.docx
Copyright © 2017 by University of Phoenix. All rights rese.docxdickonsondorris
 
Copyright © 2016 John Wiley & Sons, Inc.Copyright © 20.docx
Copyright © 2016 John Wiley & Sons, Inc.Copyright © 20.docxCopyright © 2016 John Wiley & Sons, Inc.Copyright © 20.docx
Copyright © 2016 John Wiley & Sons, Inc.Copyright © 20.docxdickonsondorris
 
Copyright © 2016 Pearson Education, Inc. .docx
Copyright © 2016 Pearson Education, Inc.                    .docxCopyright © 2016 Pearson Education, Inc.                    .docx
Copyright © 2016 Pearson Education, Inc. .docxdickonsondorris
 

Plus de dickonsondorris (20)

Copyright © eContent Management Pty Ltd. Health Sociology Revi.docx
Copyright © eContent Management Pty Ltd. Health Sociology Revi.docxCopyright © eContent Management Pty Ltd. Health Sociology Revi.docx
Copyright © eContent Management Pty Ltd. Health Sociology Revi.docx
 
Copyright © Pearson Education 2010 Digital Tools in Toda.docx
Copyright © Pearson Education 2010 Digital Tools in Toda.docxCopyright © Pearson Education 2010 Digital Tools in Toda.docx
Copyright © Pearson Education 2010 Digital Tools in Toda.docx
 
Copyright © Jen-Wen Lin 2018 1 STA457 Time series .docx
Copyright © Jen-Wen Lin 2018   1 STA457 Time series .docxCopyright © Jen-Wen Lin 2018   1 STA457 Time series .docx
Copyright © Jen-Wen Lin 2018 1 STA457 Time series .docx
 
Copyright © John Wiley & Sons, Inc. All rights reserved..docx
Copyright © John Wiley & Sons, Inc. All rights reserved..docxCopyright © John Wiley & Sons, Inc. All rights reserved..docx
Copyright © John Wiley & Sons, Inc. All rights reserved..docx
 
Copyright © by The McGraw-Hill Companies, Inc. The Aztec Accou.docx
Copyright © by The McGraw-Hill Companies, Inc. The Aztec Accou.docxCopyright © by The McGraw-Hill Companies, Inc. The Aztec Accou.docx
Copyright © by The McGraw-Hill Companies, Inc. The Aztec Accou.docx
 
Copyright © Cengage Learning. All rights reserved. CHAPTE.docx
Copyright © Cengage Learning.  All rights reserved. CHAPTE.docxCopyright © Cengage Learning.  All rights reserved. CHAPTE.docx
Copyright © Cengage Learning. All rights reserved. CHAPTE.docx
 
Copyright © by Holt, Rinehart and Winston. All rights reserved.docx
Copyright © by Holt, Rinehart and Winston. All rights reserved.docxCopyright © by Holt, Rinehart and Winston. All rights reserved.docx
Copyright © by Holt, Rinehart and Winston. All rights reserved.docx
 
Copyright © 2020 by Jones & Bartlett Learning, LLC, an Ascend .docx
Copyright © 2020 by Jones & Bartlett Learning, LLC, an Ascend .docxCopyright © 2020 by Jones & Bartlett Learning, LLC, an Ascend .docx
Copyright © 2020 by Jones & Bartlett Learning, LLC, an Ascend .docx
 
Copyright © 2019, American Institute of Certified Public Accou.docx
Copyright © 2019, American Institute of Certified Public Accou.docxCopyright © 2019, American Institute of Certified Public Accou.docx
Copyright © 2019, American Institute of Certified Public Accou.docx
 
Copyright © 2018 Pearson Education, Inc. All Rights ReservedChild .docx
Copyright © 2018 Pearson Education, Inc. All Rights ReservedChild .docxCopyright © 2018 Pearson Education, Inc. All Rights ReservedChild .docx
Copyright © 2018 Pearson Education, Inc. All Rights ReservedChild .docx
 
Copyright © 2018 Pearson Education, Inc. C H A P T E R 6.docx
Copyright © 2018 Pearson Education, Inc. C H A P T E R  6.docxCopyright © 2018 Pearson Education, Inc. C H A P T E R  6.docx
Copyright © 2018 Pearson Education, Inc. C H A P T E R 6.docx
 
Copyright © 2018 Capella University. Copy and distribution o.docx
Copyright © 2018 Capella University. Copy and distribution o.docxCopyright © 2018 Capella University. Copy and distribution o.docx
Copyright © 2018 Capella University. Copy and distribution o.docx
 
Copyright © 2018 Pearson Education, Inc.C H A P T E R 3.docx
Copyright © 2018 Pearson Education, Inc.C H A P T E R  3.docxCopyright © 2018 Pearson Education, Inc.C H A P T E R  3.docx
Copyright © 2018 Pearson Education, Inc.C H A P T E R 3.docx
 
Copyright © 2018 by Steven Levitsky and Daniel.docx
Copyright © 2018 by Steven Levitsky and Daniel.docxCopyright © 2018 by Steven Levitsky and Daniel.docx
Copyright © 2018 by Steven Levitsky and Daniel.docx
 
Copyright © 2017, 2014, 2011 Pearson Education, Inc. All Right.docx
Copyright © 2017, 2014, 2011 Pearson Education, Inc. All Right.docxCopyright © 2017, 2014, 2011 Pearson Education, Inc. All Right.docx
Copyright © 2017, 2014, 2011 Pearson Education, Inc. All Right.docx
 
Copyright © 2017 Wolters Kluwer Health Lippincott Williams.docx
Copyright © 2017 Wolters Kluwer Health  Lippincott Williams.docxCopyright © 2017 Wolters Kluwer Health  Lippincott Williams.docx
Copyright © 2017 Wolters Kluwer Health Lippincott Williams.docx
 
Copyright © 2016, 2013, 2010 Pearson Education, Inc. All Right.docx
Copyright © 2016, 2013, 2010 Pearson Education, Inc. All Right.docxCopyright © 2016, 2013, 2010 Pearson Education, Inc. All Right.docx
Copyright © 2016, 2013, 2010 Pearson Education, Inc. All Right.docx
 
Copyright © 2017 by University of Phoenix. All rights rese.docx
Copyright © 2017 by University of Phoenix. All rights rese.docxCopyright © 2017 by University of Phoenix. All rights rese.docx
Copyright © 2017 by University of Phoenix. All rights rese.docx
 
Copyright © 2016 John Wiley & Sons, Inc.Copyright © 20.docx
Copyright © 2016 John Wiley & Sons, Inc.Copyright © 20.docxCopyright © 2016 John Wiley & Sons, Inc.Copyright © 20.docx
Copyright © 2016 John Wiley & Sons, Inc.Copyright © 20.docx
 
Copyright © 2016 Pearson Education, Inc. .docx
Copyright © 2016 Pearson Education, Inc.                    .docxCopyright © 2016 Pearson Education, Inc.                    .docx
Copyright © 2016 Pearson Education, Inc. .docx
 

Dernier

Web & Social Media Analytics Previous Year Question Paper.pdf
Web & Social Media Analytics Previous Year Question Paper.pdfWeb & Social Media Analytics Previous Year Question Paper.pdf
Web & Social Media Analytics Previous Year Question Paper.pdfJayanti Pande
 
Introduction to Nonprofit Accounting: The Basics
Introduction to Nonprofit Accounting: The BasicsIntroduction to Nonprofit Accounting: The Basics
Introduction to Nonprofit Accounting: The BasicsTechSoup
 
BAG TECHNIQUE Bag technique-a tool making use of public health bag through wh...
BAG TECHNIQUE Bag technique-a tool making use of public health bag through wh...BAG TECHNIQUE Bag technique-a tool making use of public health bag through wh...
BAG TECHNIQUE Bag technique-a tool making use of public health bag through wh...Sapna Thakur
 
The basics of sentences session 2pptx copy.pptx
The basics of sentences session 2pptx copy.pptxThe basics of sentences session 2pptx copy.pptx
The basics of sentences session 2pptx copy.pptxheathfieldcps1
 
Ecosystem Interactions Class Discussion Presentation in Blue Green Lined Styl...
Ecosystem Interactions Class Discussion Presentation in Blue Green Lined Styl...Ecosystem Interactions Class Discussion Presentation in Blue Green Lined Styl...
Ecosystem Interactions Class Discussion Presentation in Blue Green Lined Styl...fonyou31
 
Accessible design: Minimum effort, maximum impact
Accessible design: Minimum effort, maximum impactAccessible design: Minimum effort, maximum impact
Accessible design: Minimum effort, maximum impactdawncurless
 
BASLIQ CURRENT LOOKBOOK LOOKBOOK(1) (1).pdf
BASLIQ CURRENT LOOKBOOK  LOOKBOOK(1) (1).pdfBASLIQ CURRENT LOOKBOOK  LOOKBOOK(1) (1).pdf
BASLIQ CURRENT LOOKBOOK LOOKBOOK(1) (1).pdfSoniaTolstoy
 
Organic Name Reactions for the students and aspirants of Chemistry12th.pptx
Organic Name Reactions  for the students and aspirants of Chemistry12th.pptxOrganic Name Reactions  for the students and aspirants of Chemistry12th.pptx
Organic Name Reactions for the students and aspirants of Chemistry12th.pptxVS Mahajan Coaching Centre
 
SOCIAL AND HISTORICAL CONTEXT - LFTVD.pptx
SOCIAL AND HISTORICAL CONTEXT - LFTVD.pptxSOCIAL AND HISTORICAL CONTEXT - LFTVD.pptx
SOCIAL AND HISTORICAL CONTEXT - LFTVD.pptxiammrhaywood
 
Z Score,T Score, Percential Rank and Box Plot Graph
Z Score,T Score, Percential Rank and Box Plot GraphZ Score,T Score, Percential Rank and Box Plot Graph
Z Score,T Score, Percential Rank and Box Plot GraphThiyagu K
 
mini mental status format.docx
mini    mental       status     format.docxmini    mental       status     format.docx
mini mental status format.docxPoojaSen20
 
Measures of Central Tendency: Mean, Median and Mode
Measures of Central Tendency: Mean, Median and ModeMeasures of Central Tendency: Mean, Median and Mode
Measures of Central Tendency: Mean, Median and ModeThiyagu K
 
9548086042 for call girls in Indira Nagar with room service
9548086042  for call girls in Indira Nagar  with room service9548086042  for call girls in Indira Nagar  with room service
9548086042 for call girls in Indira Nagar with room servicediscovermytutordmt
 
microwave assisted reaction. General introduction
microwave assisted reaction. General introductionmicrowave assisted reaction. General introduction
microwave assisted reaction. General introductionMaksud Ahmed
 
Nutritional Needs Presentation - HLTH 104
Nutritional Needs Presentation - HLTH 104Nutritional Needs Presentation - HLTH 104
Nutritional Needs Presentation - HLTH 104misteraugie
 
APM Welcome, APM North West Network Conference, Synergies Across Sectors
APM Welcome, APM North West Network Conference, Synergies Across SectorsAPM Welcome, APM North West Network Conference, Synergies Across Sectors
APM Welcome, APM North West Network Conference, Synergies Across SectorsAssociation for Project Management
 
POINT- BIOCHEMISTRY SEM 2 ENZYMES UNIT 5.pptx
POINT- BIOCHEMISTRY SEM 2 ENZYMES UNIT 5.pptxPOINT- BIOCHEMISTRY SEM 2 ENZYMES UNIT 5.pptx
POINT- BIOCHEMISTRY SEM 2 ENZYMES UNIT 5.pptxSayali Powar
 

Dernier (20)

Web & Social Media Analytics Previous Year Question Paper.pdf
Web & Social Media Analytics Previous Year Question Paper.pdfWeb & Social Media Analytics Previous Year Question Paper.pdf
Web & Social Media Analytics Previous Year Question Paper.pdf
 
Introduction to Nonprofit Accounting: The Basics
Introduction to Nonprofit Accounting: The BasicsIntroduction to Nonprofit Accounting: The Basics
Introduction to Nonprofit Accounting: The Basics
 
BAG TECHNIQUE Bag technique-a tool making use of public health bag through wh...
BAG TECHNIQUE Bag technique-a tool making use of public health bag through wh...BAG TECHNIQUE Bag technique-a tool making use of public health bag through wh...
BAG TECHNIQUE Bag technique-a tool making use of public health bag through wh...
 
The basics of sentences session 2pptx copy.pptx
The basics of sentences session 2pptx copy.pptxThe basics of sentences session 2pptx copy.pptx
The basics of sentences session 2pptx copy.pptx
 
Ecosystem Interactions Class Discussion Presentation in Blue Green Lined Styl...
Ecosystem Interactions Class Discussion Presentation in Blue Green Lined Styl...Ecosystem Interactions Class Discussion Presentation in Blue Green Lined Styl...
Ecosystem Interactions Class Discussion Presentation in Blue Green Lined Styl...
 
Accessible design: Minimum effort, maximum impact
Accessible design: Minimum effort, maximum impactAccessible design: Minimum effort, maximum impact
Accessible design: Minimum effort, maximum impact
 
BASLIQ CURRENT LOOKBOOK LOOKBOOK(1) (1).pdf
BASLIQ CURRENT LOOKBOOK  LOOKBOOK(1) (1).pdfBASLIQ CURRENT LOOKBOOK  LOOKBOOK(1) (1).pdf
BASLIQ CURRENT LOOKBOOK LOOKBOOK(1) (1).pdf
 
Organic Name Reactions for the students and aspirants of Chemistry12th.pptx
Organic Name Reactions  for the students and aspirants of Chemistry12th.pptxOrganic Name Reactions  for the students and aspirants of Chemistry12th.pptx
Organic Name Reactions for the students and aspirants of Chemistry12th.pptx
 
SOCIAL AND HISTORICAL CONTEXT - LFTVD.pptx
SOCIAL AND HISTORICAL CONTEXT - LFTVD.pptxSOCIAL AND HISTORICAL CONTEXT - LFTVD.pptx
SOCIAL AND HISTORICAL CONTEXT - LFTVD.pptx
 
Z Score,T Score, Percential Rank and Box Plot Graph
Z Score,T Score, Percential Rank and Box Plot GraphZ Score,T Score, Percential Rank and Box Plot Graph
Z Score,T Score, Percential Rank and Box Plot Graph
 
mini mental status format.docx
mini    mental       status     format.docxmini    mental       status     format.docx
mini mental status format.docx
 
Measures of Central Tendency: Mean, Median and Mode
Measures of Central Tendency: Mean, Median and ModeMeasures of Central Tendency: Mean, Median and Mode
Measures of Central Tendency: Mean, Median and Mode
 
9548086042 for call girls in Indira Nagar with room service
9548086042  for call girls in Indira Nagar  with room service9548086042  for call girls in Indira Nagar  with room service
9548086042 for call girls in Indira Nagar with room service
 
Advance Mobile Application Development class 07
Advance Mobile Application Development class 07Advance Mobile Application Development class 07
Advance Mobile Application Development class 07
 
microwave assisted reaction. General introduction
microwave assisted reaction. General introductionmicrowave assisted reaction. General introduction
microwave assisted reaction. General introduction
 
Código Creativo y Arte de Software | Unidad 1
Código Creativo y Arte de Software | Unidad 1Código Creativo y Arte de Software | Unidad 1
Código Creativo y Arte de Software | Unidad 1
 
Nutritional Needs Presentation - HLTH 104
Nutritional Needs Presentation - HLTH 104Nutritional Needs Presentation - HLTH 104
Nutritional Needs Presentation - HLTH 104
 
Mattingly "AI & Prompt Design: The Basics of Prompt Design"
Mattingly "AI & Prompt Design: The Basics of Prompt Design"Mattingly "AI & Prompt Design: The Basics of Prompt Design"
Mattingly "AI & Prompt Design: The Basics of Prompt Design"
 
APM Welcome, APM North West Network Conference, Synergies Across Sectors
APM Welcome, APM North West Network Conference, Synergies Across SectorsAPM Welcome, APM North West Network Conference, Synergies Across Sectors
APM Welcome, APM North West Network Conference, Synergies Across Sectors
 
POINT- BIOCHEMISTRY SEM 2 ENZYMES UNIT 5.pptx
POINT- BIOCHEMISTRY SEM 2 ENZYMES UNIT 5.pptxPOINT- BIOCHEMISTRY SEM 2 ENZYMES UNIT 5.pptx
POINT- BIOCHEMISTRY SEM 2 ENZYMES UNIT 5.pptx
 

Copyright 2014 American Medical Association. All rights reserv.docx

  • 1. Copyright 2014 American Medical Association. All rights reserved. Compensation of Chief Executive Officers at Nonprofit US Hospitals Karen E. Joynt, MD, MPH ; Sidney T. Le, BA; E. John Orav, PhD; Ashish K. Jha, MD, MPH H ospital chief executive officers (CEOs) play a criticalrole in shaping the performance of their organiza-tions through setting organizational priorities, allo- cating resources, and hiring clinical leadership. Indeed, in a recent large national survey1 of hospital board chairpersons, respondents reported that CEOs were the single most influ- ential individuals in shaping quality performance at their institutions. One way to potentially improve quality at an institution is to tie the CEO’s compensation to the institution’s perfor- mance. This has been broadly used in other industries, and data suggest that metrics chosen for inclusion in CEO compensa- tion packages can affect executives’ behavior.2,3 However, we know little about how CEOs in the hospital industry are paid and the specific factors that underlie their compensation, with much of the data either decades old or focused on a limited sample of institutions.4-8 These issues are particularly salient among nonprofit institutions, in which the metric of organi- zational success in many industries—the profitability of the or- ganization—must be balanced against more mission-driven fac- tors, such as the quality of care delivered and the degree of community benefit provided. Yet, we are unaware of any em-
  • 2. pirical data on the metrics by which CEOs of nonprofit hospi- tals are paid or to what degree the hospital’s quality of care or level of community benefit affects their compensation. In mid-2012, national data on compensation of CEOs of nonprofit entities became publicly available for the first time. We used these newly available data to answer 3 questions. First, IMPORTANCE Hospital chief executive officers (CEOs) can shape the priorities and performance of their organizations. The degree to which their compensation is based on their hospitals’ quality performance is not well known. OBJECTIVE To characterize CEO compensation and examine its relation with quality metrics. DESIGN, SETTING, AND PARTICIPANTS Retrospective observational study. Participants included 1877 CEOs at 2681 private, nonprofit US hospitals. MAIN OUTCOMES AND MEASURES We used linear regression to identify hospital structural characteristics associated with CEO pay. We then determined the degree to which a hospital’s performance on financial metrics, technologic metrics, quality metrics, and community benefit in 2008 was associated with CEO pay in 2009. RESULTS The CEOs in our sample had a mean compensation of $595 781 (median, $404 938) in 2009. In multivariate analyses, CEO pay was associated with the number of hospital beds overseen ($550 for each additional bed; 95% CI, 429-671; P < .001), teaching status ($425 078 more at major teaching vs nonteaching hospitals;
  • 3. 95% CI, 315 238-534 918; P < .001), and urban location. Hospitals with high levels of advanced technologic capabilities compensated their CEOs $135 862 more (95% CI, 80 744-190 990; P < .001) than did hospitals with low levels of technology. Hospitals with high performance on patient satisfaction compensated their CEOs $51 706 more than did those with low performance on patient satisfaction (95% CI, 15 166-88 247; P = .006). We found no association between CEO pay and hospitals’ margins, liquidity, capitalization, occupancy rates, process quality performance, mortality rates, readmission rates, or measures of community benefit. CONCLUSIONS AND RELEVANCE Compensation of CEOs at nonprofit hospitals was highly variable across the country. Compensation was associated with technology and patient satisfaction but not with processes of care, patient outcomes, or community benefit. JAMA Intern Med. 2014;174(1):61-67. doi:10.1001/jamainternmed.2013.11537 Published online October 14, 2013. Invited Commentary page 68 Supplemental content at jamainternalmedicine.com Author Affiliations: Department of Health Policy and Management, Harvard School of Public Health, Boston, Massachusetts (Joynt, Le,
  • 4. Jha); Department of Biostatistics, Harvard School of Public Health, Boston, Massachusetts (Orav); Cardiovascular Division, Department of Medicine, Brigham and Women’s Hospital, Boston, Massachusetts (Joynt); Cardiology and Vascular Medicine Section, Department of Medicine, Veterans Affairs Boston Healthcare System, Boston, Massachusetts (Joynt); Division of General Internal Medicine, Department of Medicine, Brigham and Women’s Hospital, Boston, Massachusetts (Orav, Jha); General Internal Medicine Section, Department of Medicine, Veterans Affairs Boston Healthcare System, Boston, Massachusetts (Jha); currently a medical student, University of California, San Francisco (Le). Corresponding Author: Ashish K. Jha, MD, MPH, Department of Health Policy and Management, Office 405, Harvard School of Public Health, 677 Huntington Ave, Boston, MA 02115 ([email protected]). Research Original Investigation jamainternalmedicine.com JAMA Internal Medicine January 2014 Volume 174, Number 1 61
  • 5. Copyright 2014 American Medical Association. All rights reserved. Downloaded From: https://jamanetwork.com/ by Jennifer Naegele on 06/29/2020 Copyright 2014 American Medical Association. All rights reserved. what is the range of compensation for CEOs of nonprofit hos- pitals in the United States? Second, which structural and or- ganizational factors of hospitals are associated with the com- pensation of CEOs? Finally, to what extent is hospital CEO pay associated with the institution’s financial performance, tech- nologic capabilities, patient outcomes, or metrics of commu- nity benefit provided? Methods Data Sources We linked 7 data sources: (1) publicly available Form 990 tax returns compiled by GuideStar (http://www.guidestar.org) for US hospitals filing as nonprofit entities in 2009; (2) the Ameri- can Hospital Association annual survey; (3) rural-urban com- muting area codes9; (4) Hospital Compare data, which con- tain process of care measures and the Hospital Consumer Assessment of Healthcare Providers and Systems survey; (5) the 2009 Medicare Provider Analysis and Review File; (6) Medi- care cost reports; and (7) the Medicare impact file. This study was approved by the Office of Human Research Administra- tion at the Harvard School of Public Health. Identifying Executives
  • 6. From the 990 forms, we identified 1877 CEOs overseeing 2681 nonfederal, private, nonprofit acute-care hospitals in the United States. These hospitals comprise more than 98% of pri- vate nonprofit US hospitals. Structural and Organizational Measures We hypothesized that CEOs who oversaw more complex or- ganizations (measured by number of beds, number of hospi- tals overseen, membership in a system, or being a major teach- ing hospital) would be compensated more highly than others. We also examined other characteristics, including a hospi- tal’s proportion of Medicare patients (a marker of payer mix) and its disproportionate share hospital index (a measure of the proportion of low-income patients), hypothesizing that the CEOs of hospitals with a less favorable payer mix might re- ceive lower compensation. Financial Performance Measures We examined 4 measures of financial performance: total mar- gin (calculated from the Medicare Cost Reports as the ratio of net income to net revenue plus other income), liquidity (the ratio of current assets to total liabilities), capitalization (the ra- tio of fund balances to total assets) all representing perfor- mance in fiscal year 2008,10 and occupancy rate (from the American Hospital Association survey representing calendar year 2008). We examined hospital performance in 2008 be- cause we assumed that the prior year’s performance would in- fluence the subsequent year’s compensation. Technologic Measures For each hospital, we used a well-validated technologic index11,12 that combines the presence of several advanced tech- nologies into a single score (eg, positron-emission tomogra- phy, magnetic resonance imaging, and the capability of per-
  • 7. forming complex operations) (Supplement [eTable 1]). We assigned higher weights to technologies that are relatively rare. Quality-of-Care Measures We selected a set of quality metrics that are endorsed by the National Quality Forum13 and used by the Centers for Medi- care and Medicaid Services for public reporting and have sub- sequently formed the basis for new mandatory federal pay- for-performance initiatives, such as value-based purchasing14 and the Hospital Readmission Reduction Program. Although these metrics are not comprehensive, they represent the best and most widely used measures of hospital quality. For each hospital, we calculated a composite measure of performance on processes of care for acute myocardial infarction, conges- tive heart failure, and pneumonia for calendar year 2008 (Supplement [eTable 2]).15,16 To assess patient satisfaction, we used Hospital Consumer Assessment of Healthcare Providers and Systems data and focused on overall satisfaction (the pro- portion rating the hospital a 9 or 10 on a 10-point scale). We built patient-level hierarchical logistic regression models to cal- culate 30-day risk-adjusted mortality and readmission rates for patients admitted with acute myocardial infarction, conges- tive heart failure, or pneumonia in calendar year 2008, ex- cluding December because 30-day outcomes crossed into 2009 (Supplement [eTables 3 and 4]). We built composite mortality and readmissions measures across the 3 conditions for each hospital using indirect standardization. Community Benefit Measures We used hospital-reported 990 forms to determine charity care and other community benefits provided in calendar year 2009, which are self-reported as a proportion of total hospital ex- penditures. Charity care represents uncompensated care, un- reimbursed Medicaid care, and unreimbursed costs from other
  • 8. means-tested government programs. Other community ben- efits include community health services, health profession- als’ education, subsidized health services, research, and con- tributions to charitable organizations.17 Primary Outcome Our primary outcome was CEO compensation in calendar year 2009. For each executive, we used the 990 forms to obtain re- portable compensation from the primary organization (includ- ing benefits and deferred compensation), reportable compen- sation from related organizations (ie, a foundation associated with a hospital), and estimated other compensation from the primary and related organizations. We summed these ele- ments to determine each CEO’s total compensation package. To account for regional variations in the cost of care, we de- flated each CEO’s compensation by the Medicare Wage In- dex, used by Medicare to adjust prospective payments to hos- pitals for hospital wage level differences between metropolitan statistical areas. Statistical Analysis We began by plotting the distribution of CEO compensation. We then calculated summary statistics for the characteristics Research Original Investigation Compensation of CEOs at Nonprofit Hospitals 62 JAMA Internal Medicine January 2014 Volume 174, Number 1 jamainternalmedicine.com Copyright 2014 American Medical Association. All rights reserved. Downloaded From: https://jamanetwork.com/ by Jennifer Naegele on 06/29/2020
  • 9. Copyright 2014 American Medical Association. All rights reserved. of the hospitals that each CEO managed, breaking the sample into the lowest decile, middle 8 deciles, and top decile of com- pensation. In cases in which executives managed multiple hos- pitals, we averaged hospital characteristics weighted by the number of beds. Thus, analyses were carried out at the CEO level, with each CEO assigned the aggregate characteristics of the beds they managed. We examined the relationship be- tween wage index–deflated CEO compensation and hospital structural characteristics, using multivariable linear regres- sion models with CEO compensation as the outcome and each of the key hospital characteristics as predictors including num- ber of beds overseen, number of hospitals overseen, teaching status (major, minor, or nonteaching), census region, loca- tion (urban vs rural), critical access status, proportion of Medi- care patients, and disproportionate share hospital index. Next, we examined whether a hospital’s performance on measures of financial performance, technology index, qual- ity and patient outcomes, or community benefit was associ- ated with CEO compensation. We individually examined each metric in models adjusted for the structural characteristics out- lined above and then proceeded to our full model including all of these variables. Because of interrelationships between the quality measures,18,19 we tested for but found no evi- dence of collinearity (Supplement [eTable 5]). We used the lin- ear models to calculate adjusted compensation for low per- formers (those at the 25th percentile) and high performers (75th percentile) on each metric. Because we were concerned that focusing on just 3 condi- tions for our mortality outcomes may not adequately capture
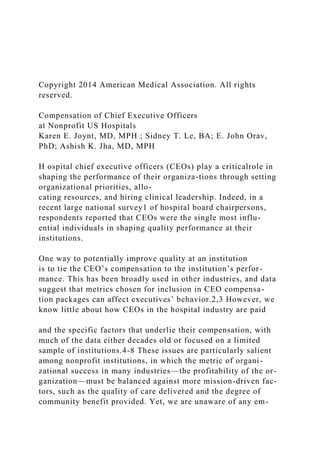
  • 10. the breadth of hospital care provided, we also created, as a sen- sitivity analysis, a 19-condition composite of medical and sur- gical mortality rates that comprise a large proportion of hospi- tal care20 (Supplement [eTable 6]). We compared the relationship between CEO pay and outcomes across these 19 conditions. We conducted additional sensitivity analyses. Because CEOs’ compensation might be based on improvement over time rather than performance in a single year, we conducted analyses using the change in financial performance and quality performance from 2006 to 2008 as our predictor; for patient satisfaction scores, which became publicly available in 2007, we used change from 2007 to 2008. Finally, because the data on CEO pay were some- what right-skewed and because the factors that affect CEO pay at wealthy hospitals may be different from those that affect CEO pay among low-paying hospitals, we repeated our analyses using quantile regression at the 25th, 50th, and 75th percentiles. We considered a 2-tailed value of P < .05 to be significant. Analyses were performed using commercial software (Stata, version 12.1; StataCorp). Results We identified 1877 executives responsible for 2681 hospitals. The CEOs had an unadjusted mean compensation of $595 781 Figure. Distribution of Chief Executive Officer Pay 0 <50 000 1 000 000 1 500 000
  • 11. 2 000 000 ≥3 000 000 10.0 9.0 Ex ec ut iv es , % Compensation, $ 8.0 7.0 6.0 5.0 4.0 3.0 2.0 1.0 500 000100 000 1 100 000 1 600 000
  • 12. 2 100 000 600 000200 000 1 200 000 1 700 000 2 200 000 700 000300 000 1 300 000 1 800 000 2 300 000 800 000400 000 1 400 000 1 900 000 2 400 000 900 000 2 500 000 2 700 000 2 800 000 2 900 000 2 600 000 Histogram of chief executive officer pay at US nonprofit hospitals in calendar year 2009. Compensation of CEOs at Nonprofit Hospitals Original Investigation Research jamainternalmedicine.com JAMA Internal Medicine January 2014 Volume 174, Number 1 63 Copyright 2014 American Medical Association. All rights reserved. Downloaded From: https://jamanetwork.com/ by Jennifer Naegele on 06/29/2020
  • 13. Copyright 2014 American Medical Association. All rights reserved. and a median compensation of $404 938 in 2009. Distribu- tion of the compensation is shown in the Figure. The CEOs in the lowest decile of compensation, with a median compensa- tion of $117 933, were largely responsible for small, nonteach- ing hospitals in rural areas, most frequently in the Midwest (Table 1). The CEOs in the highest decile of compensation, with a median compensation of $1 662 548, oversaw larger, urban hospitals, which were more often major or minor teaching hos- pitals. Overall median hospital margins were 3.5%, and me- dian occupancy rate was 63.0% (Table 2). Hospitals’ median performance on process measures was 93.4% and on patient satisfaction, 65.0%. Median charity care and other commu- nity benefit comprised 1.6% and 1.4% of total hospital expen- ditures, respectively. Hospital Characteristics and CEO Compensation In multivariable analyses, compensation was higher for CEOs managing more beds ($550 per additional bed; 95% CI, 429- 671; P < .001) (Table 3). Managing more hospitals was also as- sociated with higher pay ($32 609 per additional hospital; 95% CI, 5154-60 063; P = .02). The CEOs of major teaching hospi- tals were paid $425 078 more (95% CI, 315 238-534 918; P < .001) than were CEOs of nonteaching hospitals. The CEOs of hospi- tals with a higher proportion of poor patients and Medicare pa- tients were generally compensated less than were other CEOs (Table 3). Hospital Financial Performance and CEO Compensation Hospital financial performance was not significantly associ- ated with CEO compensation in our fully adjusted models
  • 14. (Table 4). High performers on total margins, for example, paid their CEOs similarly to poor performers (difference, $7045; 95% CI, −16 463 to 30 553; P = .56), and the relation- ships for liquidity, capitalization, and occupancy rate were also nonsignificant. Advanced Technologies and CEO Compensation The presence of higher levels of advanced technology, as measured by a technology index, was associated with sub- stantially higher CEO compensation. High performers on the technology index received $135 862 additional pay com- pared w ith poor performers (95% CI, 80 744-190 980; P < .001). Hospital Quality Performance and CEO Compensation We found no significant association between performance on process quality, risk-adjusted mortality, or readmission rates and CEO compensation (Table 4). High performers on mortal- ity rates paid their CEOs $4667 less than poor performers (95% CI, −27 457 to 18 123; P = .69). However, hospitals with higher patient satisfaction scores compensated their CEOs more than did hospitals with lower scores (difference, $51 706; 95% CI, 15 166 to 88 247; P = .006). Table 1. Characteristics of Hospitals Associated With Each Chief Executive Officer Characteristic Decile of Compensation Lowest 2-9 Highest No. of officers 188 1502 187 No. of hospitals 189 1841 651
  • 15. Total compensation, $ Median (IQR) 117 933 (89 221-136 390) 405 167 (264 196-635 226) 1 662 548 (1 358 702-2 327 567) Mean (SD) 106 324 (38 985) 469 096 (254 133) 2 105 394 (1 201 963) No. of beds Median (IQR) 39 (25-73) 136 (61-256) 234 (80-451) Mean (SD) 62 (76) 185 (169) 310 (290) Region, % Northeast 9.6 26.2 23.0 Midwest 50.5 34.0 32.1 South 23.4 26.4 31.5 West 16.5 13.4 13.4 Teaching, % Major 0.0 6.8 33.8 Minor 12.8 25.2 33.6 Nonteaching 87.2 68.0 32.6 Rural-urban commuting area, % Urban 12.8 53.9 88.7
  • 16. Suburban 3.7 4.4 0.9 Large rural town 8.5 19.2 6.6 Small town/isolated rural 75.0 22.5 3.7 Medicare patients, % 53.2 (49.0-67.2) 48.6 (42.9-54.6) 41.8 (38.0-48.5) Disproportionate share index 0.0 (0.0-0.0) 17.2 (3.6-26.3) 21.5 (12.2-30.3) Critical access hospital 69.7 18.3 2.8 Abbreviation: IQR, interquartile range. Research Original Investigation Compensation of CEOs at Nonprofit Hospitals 64 JAMA Internal Medicine January 2014 Volume 174, Number 1 jamainternalmedicine.com Copyright 2014 American Medical Association. All rights reserved. Downloaded From: https://jamanetwork.com/ by Jennifer Naegele on 06/29/2020 Copyright 2014 American Medical Association. All rights reserved. Community Benefit and CEO Compensation We found no association between charity care and CEO com- pensation (−$52 for high performers vs poor performers; 95%
  • 17. CI, −441 to 337; P = .79) or between community benefit and CEO compensation ($0 additional compensation for high perform- ers vs poor performers, 95% CI, −3 to 3; P = .88). Sensitivity Analysis When we substituted a 19-condition composite mortality rate into the model, we found no association with CEO pay (−$453 for high vs low performers; 95% CI, −35 992 to 35 086; P = .98) (Supplement [eTable 7]). Using changes in financial performance and quality performance from 2006 to 2008 as predictors, technology was the only factor sig- nificantly associated with CEO compensation (Supplement [eTable 8]). When we used quantile regression to examine the dis- tribution of CEO salaries based on varying levels of financial and quality performance, we found relatively similar results in all but 2 instances. Whereas we found little relationship between total margins and CEO pay in our overall analyses, we found that the 25th percentile and median CEO salaries were higher at high-margin hospitals compared with low- margin hospitals (Supplement [eTables 9 and 10]). There was no relationship between hospital total margin and CEO pay at the upper end of the pay scale (Supplement [eTable 11]). Similarly, we found that the 25th percentile of CEO compensation was somewhat higher among hospitals with high performance on process quality measures compared with hospitals with poor performance on the process quality measures. The difference in median salaries was even smaller and not statistically significant, and there was no significant difference based on process quality scores at the upper end of the CEO pay scale. Discussion
  • 18. We examined the compensation of CEOs of nonprofit US hos- pitals and found that executives who oversaw larger teaching hospitals were the most highly compensated. Furthermore, even after accounting for these and other structural factors, a higher level of advanced technologies was associated with sig- nificantly higher compensation. Although we found no rela- tionship with hospital performance on standard process or out- come metrics, patient satisfaction had a modest but significant relationship with CEO compensation. Finally, despite the fact that we examined nonprofit institutions whose tax-exempt sta- tus is based on their ability to demonstrate community ben- efit, we found no relationship between the degree of that ben- efit and CEO compensation. Among the quality metrics we examined, only patient sat- isfaction was consistently associated with CEO compensa- tion. The factors that shape the compensation package of CEOs likely reflect a combination of boards’ awareness of hospital performance on key metrics and its assessment of the ability of the CEO to influence those metrics. Boards may have an easier time assessing patient satisfaction than other quality metrics, such as risk-adjusted mortality rates, or may see pa- tient satisfaction as a key measure of organizational perfor- mance and marketability. Of course, it is possible that boards reward CEOs on other factors that we could not measure, such as staff satisfaction. Table 2. Hospital Performance Characteristic % Median (IQR) Hospital financial outcomes Total margins 3.5 (0.1-7.5) Liquidity 200.1 (135.3-298.4)
  • 19. Capitalization 51.6 (33.5-66.4) Occupancy rate 63.0 (50.3-72.8) Presence of advanced technologies Technology index 0.406 (0.246-0.609) Hospital quality Process measures, 2008 93.4 (89.7-95.5) Patient satisfaction, 2008 65.0 (60.0-70.0) Risk-adjusted mortality rates, 2008 12.2 (10.3-14.6) Risk-adjusted readmission rates, 2008 21.2 (18.8-24.3) Community benefit Charity care provided, % of total expenditures 1.6 (0.7-2.8) Other community benefit, % of total expenditures 1.4 (0.5-3.3) Abbreviation: IQR, interquartile range. Table 3. Hospital Characteristics and Chief Executive Officer Compensation Characteristic
  • 20. Additional Compensationa (95% CI) P Value Mean wage-adjusted compensation, $ 595 781 (not applicable) No. of beds, $ 550 (429 to 671) <.001 No. of hospitals, $ 32 609 (5154 to 60 063) .02 Region, $ Northeast Reference Midwest 29 206 (−36 476 to 94 888) .38 South 77 449 (9070 to 145 829) .03 West 32 533 (−51 917 to 116 983) .45 Teaching, $ Not teaching Reference Major 425 078 (315 238 to 534 918) <.001 Minor 151 352 (87 899 to 214 805) <.001 Rural-urban commuting area, $ Urban Reference
  • 21. Suburban −137 690 (−272 195 to −3184) .045 Large rural town −124 491 (−198 703 to −50 279) .001 Small town/isolated rural −195 553 (−284 305 to −106 801) <.001 Critical access hospital, $ −1156 (−136 390 to 134 078) .99 Disproportionate share index, $ −38 938 (−59 621 to −18 254) .000 Percent Medicare patients, $ −21 112 (−43 137 to 913) .060 a For continuous predictors, additional compensation represents the change in compensation associated with a 10% change in the independent variable. Model is adjusted for all listed covariates. Compensation of CEOs at Nonprofit Hospitals Original Investigation Research jamainternalmedicine.com JAMA Internal Medicine January 2014 Volume 174, Number 1 65 Copyright 2014 American Medical Association. All rights reserved. Downloaded From: https://jamanetwork.com/ by Jennifer Naegele on 06/29/2020 Copyright 2014 American Medical Association. All rights
  • 22. reserved. There was no consistent association between CEO pay and more traditional measures of quality, such as adherence to pro- cess measures or patient outcomes. In one set of sensitivity analyses, we found that the low end (25th percentile) of CEO pay at hospitals with better adherence to process measures was somewhat higher than at hospitals with worse adherence to process measures, although the difference was small. This could represent a chance finding, or it might suggest that at hospitals with lower-paid CEOs, there appears to be a little more attention given to process quality metrics. Given that hospital boards have a fiduciary responsibility to represent the welfare of the community, they could make the link between their CEO’s pay and hospital quality perfor- mance more explicit. It may be that they have not done so be- cause they may believe that these quality metrics are not ad- equate measures of CEO performance. Whether linking CEO compensation to quality metrics would lead to better care is unknown; an alternative possibility is that linking CEO com- pensation explicitly to quality metrics could have unin- tended consequences, such as reducing hospitals’ incentive to provide to medically or socially complex populations. We were surprised to find only weak nonsignificant rela- tionships between CEO pay and financial performance. How- ever, indirect measures of financial performance, including payer mix and advanced technology, were associated with CEO compensation. Furthermore, we found that at the lower half of the pay scale, there appeared to be a modest relationship between hospital total margins and CEO pay. It may be that total margins play a role in CEO salary up to a point, beyond which, as compensation rises, it has little bearing on measures of qual-
  • 23. ity or financial performance. The fact that hospitals with higher levels of technology paid their CEOs more has several poten- tial explanations. First, the advanced technologies may iden- tify hospitals that provide more “complex” care and there- fore need to pay more to attract a leader who can manage a complex organization. Alternatively, boards may value their hospitals being seen as technologic leaders in the commu- nity. Finally, high levels of technology may simply be a reflec- tion of financial health: hospitals with the resources and ac- cess to capital to purchase advanced technologies may be rewarding their CEOs for this success. Although there has been prior work21 examining the relationship between CEO pay and firm performance broadly, there have been few recent data on the compensa- tion of hospital CEOs. Four large studies using data from the 1990s found that CEO compensation was linked to hospital financial performance,4 profit status,5 size, and location6 and only somewhat to quality.22 Two recent studies of non- profit CEO compensation, one in Connecticut7 and one in New Hampshire,8 also found no relationship between CEO p ay a n d q u a l it y o r c o m m u n it y b e n e f it , a l t h o u g h t h e samples were small (29 and 23 hospitals, respectively). We are unaware of any recent data on national patterns of hos- pital CEO compensation. There are limitations to our study. To assess CEO com- pensation, we relied on data that, although audited, have not been extensively validated. Although the 990 forms are intended to include all compensation, even that which is indirect or in-kind, this type of compensation may be under- reported. Hospitals may not consistently use the same defi- nitions of uncompensated care or may inflate costs attrib-
  • 24. uted to charity by using list prices for this care.23 The quality measures we assessed were those that are publicly available and that are components of federal pay-for-performance programs but may have their own limitations. For example, patient satisfaction metrics represent a combination of hos- pital performance and patient expectations. Furthermore, our selected quality metrics, although likely reflective of overall quality at each hospital, are not exhaustive; it is pos- sible that hospitals track internal quality metrics, such as infection rates, and that these may be more closely corre- lated with financial remuneration. Our metrics of financial performance may not wholly reflect the financial health of the institution, although we aimed to include a set of met- Table 4. Hospital Financial Outcomes, Technology, Quality, and Community Benefit and Chief Executive Officer Compensationa Characteristic Low … SE571 Course Project: Security Assessment and Recommendations Scenarios Scenario One Company Overview Aircraft
  • 25. Solution s(AS)is a recognized leader in the design and fabrication of component products and services for companies in the electronics, commercial, defense, and aerospace industry. Located in Southern California, AS has a dedicated, trained workforce and maintains a large capacity plant and extensive equipment to meet customer requirements. Much of the equipment is automated to increase production while reducing costs. The company's workforce has a large skill base: design engineers, programmers, machinists, and assembly personnel to work its highly-automated production systems. The mission of AS is to provide customer success through machined products and related services, and to meet cost, quality, and schedule requirements. The company strategy is to offer low-cost design and computer- aided modeling packages to customers to reduce their development expenses. AS will help the customer through all phases of new product deployment, from initial prototypes through final large-volume production and assembly. By involving itself in all phases of customer product development, AS hopes to establish long-term relationships and secure repeated follow-on business with its customers. In addition, AS
  • 26. continues to invest heavily in workforce education and training, so as to improve capability to serve its customers. Company Geographic Layout Aircraft