Call Girls Ludhiana Just Call 9907093804 Top Class Call Girl Service Available
Socialogue,heart wired or hard-wired
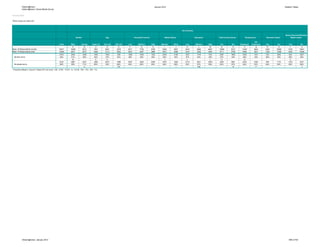
1. Global @dvisor January 2012 Detailed Tables
Global @dvisor: Social Media Survey
SOCIALOGUE
Which would you rather do?
All Countries
Senior Executive/Decision
Gender Age Household Income Marital Status Education Chief Income Earner Employment Business Owner Maker/Leader
Not
Total Male Female Under 35 35 to 49 50 to 64 Low Medium High Married Other Low Medium High Yes No Employed Employed Yes No Yes No
A B C D E F G H I J K L M N O P Q R S T U
Base: All Respondents (unwtd) 19271 10059 9212 7801 6591 4879 5571 7705 5785 9258 9507 5445 6859 6967 10958 8313 13427 5844 2363 16908 3720 15551
Base: All Respondents (wtd) 12500 6227 6273 5462 4113 2924 3833 4607 3889 5614 6386 4316 4349 3834 6711 5789 8469 4031 1494 11006 2252 10248
4376 2540 1836 1935 1503 939 1366 1603 1352 2044 2159 1607 1418 1351 2487 1889 3045 1331 543 3833 849 3527
Be tech savvy 35% 41% 29% 35% 37% 32% 36% 35% 35% 36% 34% 37% 33% 35% 37% 33% 36% 33% 36% 35% 38% 34%
B E E J L L O Q U
8124 3687 4437 3528 2610 1986 2467 3003 2538 3570 4228 2710 2931 2483 4223 3901 5424 2700 950 7174 1403 6721
Be people savvy 65% 59% 71% 65% 63% 68% 64% 65% 65% 64% 66% 63% 67% 65% 63% 67% 64% 67% 64% 65% 62% 66%
A CD I KM N P T
Proportions/Means: Columns Tested (5% risk level) - A/B - C/D/E - F/G/H - I/J - K/L/M - N/O - P/Q - R/S - T/U
Global @dvisor: January 2012 589 of 700
2. Global @dvisor January 2012 Detailed Tables
Global @dvisor: Social Media Survey
SOCIALOGUE
Which would you rather do?
Great Saudi United
Total Argentina Australia Belgium Brazil Canada China France Germany Britain Hungary India Indonesia Italy Japan Mexico Poland Russia Arabia South Africa South Korea Spain Sweden Turkey States Hong Kong
A B C D E F G H I J K L M N O P Q R S T U V W X Y
Base: All Respondents (unwtd) 19271 506 1005 508 1059 1014 1006 1023 1023 1017 1001 1003 509 1000 1028 502 506 504 506 520 500 1005 502 516 1005 503
Base: All Respondents (wtd) 12500 500 500 500 500 500 500 500 500 500 500 500 500 500 500 500 500 500 500 500 500 500 500 500 500 500
4376 177 160 141 220 124 269 132 122 164 153 269 195 211 207 237 153 163 173 165 171 160 135 179 157 140
Be tech savvy 35% 35% 32% 28% 44% 25% 54% 26% 24% 33% 31% 54% 39% 42% 41% 47% 31% 33% 35% 33% 34% 32% 27% 36% 31% 28%
CEGHVY EGH ABCEGHIJPQRSTUVXYABCDEGHIJLMNPQRSTUVWXY EGH EGH HIJLMNPQRS
CEGHIJPQUVXGHIJPQRSTU
E GHIJPQRSTU
GHIJLPQRSTU EH EGH EGH EH CEGHY EGH CEGHVY EGH
8124 323 340 359 280 376 231 368 378 336 347 231 305 289 293 263 347 337 327 335 329 340 365 321 343 360
Be people savvy 65% 65% 68% 72% 56% 75% 46% 74% 76% 67% 69% 46% 61% 58% 59% 53% 69% 67% 65% 67% 66% 68% 73% 64% 69% 72%
DFKMO DFKLMNO ADFKLMNOTW FK JKLMNOPQRSTUWX ABDFIJKLMNOQRT
JKLMNOPQRS DFKLMNO DFKLMNO FKO FK FK DFKLMNO DFKLMNO DFKMNO DFKMNO DFKMNO DFKLMNO ADFKLMNOW FKO DFKLMNO ADFKLMNOTW
Proportions/Means: Columns Tested (5% risk level) - A/B/C/D/E/F/G/H/I/J/K/L/M/N/O/P/Q/R/S/T/U/V/W/X/Y
Global @dvisor: January 2012 590 of 700
3. Global @dvisor January 2012 Detailed Tables
Global @dvisor: Social Media Survey
SOCIALOGUE
Which would you rather do?
North G-8 Middle
Total America LATAM Europe APAC Countries BRIC East/Africa
A B C D E F G
Base: All Respondents (unwtd) 19271 2019 2067 7585 5555 7614 3572 1542
Base: All Respondents (wtd) 12500 1000 1500 4500 3500 4000 2000 1500
4376 281 634 1370 1433 1280 921 518
Be tech savvy 35% 28% 42% 30% 41% 32% 46% 35%
ACEG ACEG A ACDEG AC
8124 719 866 3130 2067 2720 1079 982
Be people savvy 65% 72% 58% 70% 59% 68% 54% 65%
BDEFG BDFG F BDF BDF
Proportions/Means: Columns Tested (5% risk level) - A/B/C/D/E/F/G
Global @dvisor: January 2012 591 of 700
4. Global @dvisor January 2012 Detailed Tables
Global @dvisor: Social Media Survey
SOCIALOGUE
Which would you rather do?
Argentina
Senior Executive/Decision
Argentina Gender Age Household Income Marital Status Education Chief Income Earner Employment Business Owner Maker/Leader
Not
Total Male Female Under 35 35 to 49 50 to 64 Low Medium High Married Other Low Medium High Yes No Employed Employed Yes No Yes No
A B C D E F G H I J K L M N O P Q R S T U
Base: All Respondents (unwtd) 506 270 236 225 180 101 33 66 407 160 346 174 182 150 286 220 376 130 48 458 84 422
Base: All Respondents (wtd) 500 245 255 248 163 89* 44** 90* 366 150 350 327 119 55 255 245 329 171 40* 460 65* 435
177 100 77 112 46 18 19 27 132 43 134 121 43 14 84 94 104 73 14 163 16 161
Be tech savvy 35% 41% 30% 45% 29% 21% 43% 30% 36% 29% 38% 37% 36% 25% 33% 38% 32% 43% 36% 35% 25% 37%
B DE M M
323 145 178 136 117 70 25 63 234 107 216 205 76 41 172 151 224 98 26 297 49 274
Be people savvy 65% 59% 70% 55% 71% 79% 57% 70% 64% 71% 62% 63% 64% 75% 67% 62% 68% 57% 64% 65% 75% 63%
A C C KL
Proportions/Means: Columns Tested (5% risk level) - A/B - C/D/E - F/G/H - I/J - K/L/M - N/O - P/Q - R/S - T/U * small base; ** very small base (under 30) ineligible for sig testing
Global @dvisor: January 2012 592 of 700
5. Global @dvisor January 2012 Detailed Tables
Global @dvisor: Social Media Survey
SOCIALOGUE
Which would you rather do?
India
Senior Executive/Decision
India Gender Age Household Income Marital Status Education Chief Income Earner Employment Business Owner Maker/Leader
Not
Total Male Female Under 35 35 to 49 50 to 64 Low Medium High Married Other Low Medium High Yes No Employed Employed Yes No Yes No
A B C D E F G H I J K L M N O P Q R S T U
Base: All Respondents (unwtd) 1003 813 190 715 249 39 261 454 288 634 369 0 74 929 746 257 933 70 293 710 630 373
Base: All Respondents (wtd) 500 258 242 276 175 48** 132 210 158 297 203 -** 44* 456 290 210 433 67* 128 372 281 219
269 150 119 143 95 31 67 113 90 167 102 0 17 252 166 103 232 37 67 202 152 117
Be tech savvy 54% 58% 49% 52% 54% 63% 51% 54% 57% 56% 50% - 39% 55% 57% 49% 54% 55% 53% 54% 54% 54%
231 108 123 133 80 18 65 98 68 130 101 0 27 204 124 107 201 30 60 171 130 102
Be people savvy 46% 42% 51% 48% 46% 37% 49% 46% 43% 44% 50% - 61% 45% 43% 51% 46% 45% 47% 46% 46% 46%
Proportions/Means: Columns Tested (5% risk level) - A/B - C/D/E - F/G/H - I/J - K/L/M - N/O - P/Q - R/S - T/U * small base; ** very small base (under 30) ineligible for sig testing
Global @dvisor: January 2012 593 of 700
6. Global @dvisor January 2012 Detailed Tables
Global @dvisor: Social Media Survey
SOCIALOGUE
Which would you rather do?
Mexico
Senior Executive/Decision
Mexico Gender Age Household Income Marital Status Education Chief Income Earner Employment Business Owner Maker/Leader
Not
Total Male Female Under 35 35 to 49 50 to 64 Low Medium High Married Other Low Medium High Yes No Employed Employed Yes No Yes No
A B C D E F G H I J K L M N O P Q R S T U
Base: All Respondents (unwtd) 502 333 169 206 199 97 333 142 27 233 269 111 161 230 312 190 373 129 65 437 126 376
Base: All Respondents (wtd) 500 238 262* 270* 158* 72* 406 85* 9** 215* 285 321* 103 76 243 257* 314 186* 32* 468 73* 427
237 106 131 125 78 34 197 39 1 107 130 163 47 27 116 120 151 86 16 221 35 202
Be tech savvy 47% 44% 50% 46% 49% 48% 48% 46% 14% 50% 46% 51% 46% 35% 48% 47% 48% 46% 50% 47% 48% 47%
M
263 133 131 145 81 38 210 46 8 109 155 158 56 49 126 137 163 100 16 247 38 226
Be people savvy 53% 56% 50% 54% 51% 52% 52% 54% 86% 50% 54% 49% 54% 65% 52% 53% 52% 54% 50% 53% 52% 53%
K
Proportions/Means: Columns Tested (5% risk level) - A/B - C/D/E - F/G/H - I/J - K/L/M - N/O - P/Q - R/S - T/U * small base; ** very small base (under 30) ineligible for sig testing
Global @dvisor: January 2012 594 of 700
7. Global @dvisor January 2012 Detailed Tables
Global @dvisor: Social Media Survey
SOCIALOGUE
Which would you rather do?
Spain
Senior Executive/Decision
Spain Gender Age Household Income Marital Status Education Chief Income Earner Employment Business Owner Maker/Leader
Not
Total Male Female Under 35 35 to 49 50 to 64 Low Medium High Married Other Low Medium High Yes No Employed Employed Yes No Yes No
A B C D E F G H I J K L M N O P Q R S T U
Base: All Respondents (unwtd) 1005 464 541 389 381 235 611 334 60 453 552 657 76 272 544 461 654 351 92 913 116 889
Base: All Respondents (wtd) 500 252 248 205 181 114 296 174 31* 212 288 249 115* 137 276 224 321 179 46* 454 59* 441
160 101 59 80 56 24 98 52 9 68 92 78 37 45 89 71 98 62 12 148 18 142
Be tech savvy 32% 40% 24% 39% 31% 21% 33% 30% 30% 32% 32% 31% 32% 33% 32% 32% 30% 35% 26% 33% 31% 32%
B DE E
340 151 189 125 125 90 197 121 22 144 196 171 78 92 187 153 223 117 34 307 41 300
Be people savvy 68% 60% 76% 61% 69% 79% 67% 70% 70% 68% 68% 69% 68% 67% 68% 68% 70% 65% 74% 67% 69% 68%
A C CD
Proportions/Means: Columns Tested (5% risk level) - A/B - C/D/E - F/G/H - I/J - K/L/M - N/O - P/Q - R/S - T/U * small base
Global @dvisor: January 2012 595 of 700
8. Global @dvisor January 2012 Detailed Tables
Global @dvisor: Social Media Survey
SOCIALOGUE
Which would you rather do?
South Africa
Senior Executive/Decision
South Africa Gender Age Household Income Marital Status Education Chief Income Earner Employment Business Owner Maker/Leader
Not
Total Male Female Under 35 35 to 49 50 to 64 Low Medium High Married Other Low Medium High Yes No Employed Employed Yes No Yes No
A B C D E F G H I J K L M N O P Q R S T U
Base: All Respondents (unwtd) 520 240 280 133 224 163 17 98 405 314 206 191 168 161 317 203 463 57 152 368 205 315
Base: All Respondents (wtd) 500 240 260 286* 130 83 29** 111* 361 224 276* 194* 150* 156* 258 242* 414 86** 135* 365 181* 319
165 96 69 80 51 34 8 38 119 82 83 44 59 63 117 48 150 15 43 122 59 106
Be tech savvy 33% 40% 26% 28% 39% 41% 26% 35% 33% 36% 30% 23% 39% 40% 45% 20% 36% 17% 32% 33% 33% 33%
B K K O
335 144 191 206 79 50 21 72 242 142 193 150 91 94 141 194 264 71 91 244 122 213
Be people savvy 67% 60% 74% 72% 61% 59% 74% 65% 67% 64% 70% 77% 61% 60% 55% 80% 64% 83% 68% 67% 67% 67%
A LM N
Proportions/Means: Columns Tested (5% risk level) - A/B - C/D/E - F/G/H - I/J - K/L/M - N/O - P/Q - R/S - T/U * small base; ** very small base (under 30) ineligible for sig testing
Global @dvisor: January 2012 596 of 700
9. Global @dvisor January 2012 Detailed Tables
Global @dvisor: Social Media Survey
SOCIALOGUE
Which would you rather do?
Great Britain
Senior Executive/Decision
Great Britain Gender Age Household Income Marital Status Education Chief Income Earner Employment Business Owner Maker/Leader
Not
Total Male Female Under 35 35 to 49 50 to 64 Low Medium High Married Other Low Medium High Yes No Employed Employed Yes No Yes No
A B C D E F G H I J K L M N O P Q R S T U
Base: All Respondents (unwtd) 1017 488 529 328 368 321 226 626 165 446 571 315 341 361 637 380 653 364 96 921 126 891
Base: All Respondents (wtd) 500 246 254 185 167 148 112 308 80 210 290 154 170 177 306 194 317 183 46* 454 60 440
164 113 51 73 54 37 30 112 22 65 99 52 58 55 107 58 109 56 14 150 22 142
Be tech savvy 33% 46% 20% 40% 32% 25% 27% 36% 27% 31% 34% 34% 34% 31% 35% 30% 34% 30% 30% 33% 37% 32%
B E E FH
336 133 203 112 113 111 82 195 58 144 192 102 112 122 200 136 208 128 32 304 38 298
Be people savvy 67% 54% 80% 60% 68% 75% 73% 64% 73% 69% 66% 66% 66% 69% 65% 70% 66% 70% 70% 67% 63% 68%
A CD G G
Proportions/Means: Columns Tested (5% risk level) - A/B - C/D/E - F/G/H - I/J - K/L/M - N/O - P/Q - R/S - T/U * small base
Global @dvisor: January 2012 597 of 700
10. Global @dvisor January 2012 Detailed Tables
Global @dvisor: Social Media Survey
SOCIALOGUE
Which would you rather do?
US
Senior Executive/Decision
US Gender Age Household Income Marital Status Education Chief Income Earner Employment Business Owner Maker/Leader
Not
Total Male Female Under 35 35 to 49 50 to 64 Low Medium High Married Other Low Medium High Yes No Employed Employed Yes No Yes No
A B C D E F G H I J K L M N O P Q R S T U
Base: All Respondents (unwtd) 1005 442 563 320 317 368 158 266 581 584 421 467 301 237 479 526 611 394 133 872 144 861
Base: All Respondents (wtd) 500 247 253 182 148 169 76 110 315 284 216 232 127 141 244 256 309 191 69 431 77 423
157 90 67 58 50 49 27 36 94 86 71 72 40 45 85 72 100 57 19 138 22 136
Be tech savvy 31% 36% 27% 32% 34% 29% 35% 33% 30% 30% 33% 31% 32% 32% 35% 28% 32% 30% 28% 32% 28% 32%
B O
343 158 185 124 98 121 49 74 220 198 145 160 87 96 159 184 209 134 50 293 55 287
Be people savvy 69% 64% 73% 68% 66% 71% 65% 67% 70% 70% 67% 69% 68% 68% 65% 72% 68% 70% 72% 68% 72% 68%
A N
Proportions/Means: Columns Tested (5% risk level) - A/B - C/D/E - F/G/H - I/J - K/L/M - N/O - P/Q - R/S - T/U
Global @dvisor: January 2012 598 of 700
11. Global @dvisor January 2012 Detailed Tables
Global @dvisor: Social Media Survey
SOCIALOGUE
Which would you rather do?
Saudi Arabia
Senior Executive/Decision
Saudi Arabia Gender Age Household Income Marital Status Education Chief Income Earner Employment Business Owner Maker/Leader
Not
Total Male Female Under 35 35 to 49 50 to 64 Low Medium High Married Other Low Medium High Yes No Employed Employed Yes No Yes No
A B C D E F G H I J K L M N O P Q R S T U
Base: All Respondents (unwtd) 506 322 184 403 93 10 150 119 160 0 0 153 135 218 278 228 350 156 152 354 167 339
Base: All Respondents (wtd) 500 283 217 295 158* 47** 148* 104* 158* -** -** 147* 142* 211 258 242 307 193* 135 365 151* 349
173 97 76 107 47 19 41 34 72 0 0 63 40 70 94 79 115 58 54 119 58 115
Be tech savvy 35% 34% 35% 36% 30% 40% 28% 32% 45% - - 43% 28% 33% 37% 33% 37% 30% 40% 33% 38% 33%
F L
327 186 141 188 111 28 107 71 86 0 0 84 102 141 164 163 192 135 81 246 93 234
Be people savvy 65% 66% 65% 64% 70% 60% 72% 68% 55% - - 57% 72% 67% 63% 67% 63% 70% 60% 67% 62% 67%
H K
Proportions/Means: Columns Tested (5% risk level) - A/B - C/D/E - F/G/H - I/J - K/L/M - N/O - P/Q - R/S - T/U * small base; ** very small base (under 30) ineligible for sig testing
Global @dvisor: January 2012 599 of 700
12. Global @dvisor January 2012 Detailed Tables
Global @dvisor: Social Media Survey
SOCIALOGUE
Which would you rather do?
Canada
Senior Executive/Decision
Canada Gender Age Household Income Marital Status Education Chief Income Earner Employment Business Owner Maker/Leader
CANADA- NORTHWES
Not CANADA- CANADA- CANADA- BRITISH T CANADA- CANADA-
Total Male Female Under 35 35 to 49 50 to 64 Low Medium High Married Other Low Medium High Yes No Employed Employed Yes No Yes No PRAIRIES ATLANTIC ALBERTA COLUMBIA TERRITORIE ONTARIO QUEBEC
A B C D E F G H I J K L M N O P Q R S T U V W X Y Z a b
Base: All Respondents (unwtd) 1014 505 509 320 315 379 230 406 378 432 582 350 519 145 545 469 680 334 93 921 106 908 69 86 95 128 0 398 238
Base: All Respondents (wtd) 500 247 253 177 155 167 116 197 187 205 295 186 223 90 262 238 332 168 46* 454 52 448 34* 42* 46* 65 -** 196 117
124 68 56 45 40 39 30 48 46 50 74 48 50 25 71 53 85 38 8 116 11 113 8 10 10 15 0 51 30
Be tech savvy 25% 28% 22% 25% 26% 23% 26% 24% 24% 24% 25% 26% 22% 28% 27% 22% 26% 23% 17% 26% 21% 25% 24% 23% 21% 23% - 26% 26%
B
376 179 197 132 115 129 86 149 141 156 221 138 173 65 191 185 247 130 38 338 41 335 26 33 36 50 0 145 87
Be people savvy 75% 72% 78% 75% 74% 77% 74% 76% 76% 76% 75% 74% 78% 72% 73% 78% 74% 77% 83% 74% 79% 75% 76% 77% 79% 77% - 74% 74%
A
Proportions/Means: Columns Tested (5% risk level) - A/B - C/D/E - F/G/H - I/J - K/L/M - N/O - P/Q - R/S - T/U - V/W/X/Y/Z/a/b * small base; ** very small base (under 30) ineligible for sig testing
Global @dvisor: January 2012 600 of 700
13. Global @dvisor January 2012 Detailed Tables
Global @dvisor: Social Media Survey
SOCIALOGUE
Which would you rather do?
France
Senior Executive/Decision
France Gender Age Household Income Marital Status Education Chief Income Earner Employment Business Owner Maker/Leader
Not
Total Male Female Under 35 35 to 49 50 to 64 Low Medium High Married Other Low Medium High Yes No Employed Employed Yes No Yes No
A B C D E F G H I J K L M N O P Q R S T U
Base: All Respondents (unwtd) 1023 485 538 369 292 362 248 550 225 358 665 365 330 328 612 411 616 407 34 989 63 960
Base: All Respondents (wtd) 500 247 253 191 141 168 123 271 106 173 327 168 209 124 293 207 299 201 16* 484 28* 472
132 76 56 48 40 44 34 72 26 49 83 44 62 26 70 61 79 53 6 126 8 124
Be tech savvy 26% 31% 22% 25% 28% 26% 27% 27% 24% 28% 25% 26% 30% 21% 24% 30% 27% 26% 35% 26% 30% 26%
B M
368 171 197 142 102 125 89 199 80 125 243 124 146 98 222 146 219 149 11 358 19 349
Be people savvy 74% 69% 78% 75% 72% 74% 73% 73% 76% 72% 75% 74% 70% 79% 76% 70% 73% 74% 65% 74% 70% 74%
A L
Proportions/Means: Columns Tested (5% risk level) - A/B - C/D/E - F/G/H - I/J - K/L/M - N/O - P/Q - R/S - T/U * small base
Global @dvisor: January 2012 601 of 700
14. Global @dvisor January 2012 Detailed Tables
Global @dvisor: Social Media Survey
SOCIALOGUE
Which would you rather do?
Germany
Senior Executive/Decision
Germany Gender Age Household Income Marital Status Education Chief Income Earner Employment Business Owner Maker/Leader
Not
Total Male Female Under 35 35 to 49 50 to 64 Low Medium High Married Other Low Medium High Yes No Employed Employed Yes No Yes No
A B C D E F G H I J K L M N O P Q R S T U
Base: All Respondents (unwtd) 1023 502 521 269 428 326 375 332 316 444 579 238 643 142 640 383 590 433 71 952 137 886
Base: All Respondents (wtd) 500 253 247 172 188 140 186 159 154 199 301 113 285 101 307 193 286 214 34* 466 65 435
122 77 45 30 49 44 48 36 39 49 74 28 70 24 79 43 68 55 7 116 17 105
Be tech savvy 24% 31% 18% 17% 26% 31% 26% 23% 25% 24% 25% 25% 25% 24% 26% 23% 24% 25% 20% 25% 27% 24%
B C C
378 175 202 142 140 96 139 123 115 151 227 85 215 77 228 150 218 159 28 350 48 330
Be people savvy 76% 69% 82% 83% 74% 69% 74% 77% 75% 76% 75% 75% 75% 76% 74% 77% 76% 75% 80% 75% 73% 76%
A DE
Proportions/Means: Columns Tested (5% risk level) - A/B - C/D/E - F/G/H - I/J - K/L/M - N/O - P/Q - R/S - T/U * small base
Global @dvisor: January 2012 602 of 700
15. Global @dvisor January 2012 Detailed Tables
Global @dvisor: Social Media Survey
SOCIALOGUE
Which would you rather do?
Australia
Senior Executive/Decision
Australia Gender Age Household Income Marital Status Education Chief Income Earner Employment Business Owner Maker/Leader REGION
Not
Total Male Female Under 35 35 to 49 50 to 64 Low Medium High Married Other Low Medium High Yes No Employed Employed Yes No Yes No METRO NON-METRO VIC/TAS NSW/ACT QLD SA/NT WA
A B C D E F G H I J K L M N O P Q R S T U V W X Y Z a b
Base: All Respondents (unwtd) 1005 484 521 469 343 193 212 531 262 450 555 329 296 380 555 450 668 337 109 896 146 859 704 301 313 330 164 122 76
Base: All Respondents (wtd) 500 248 252 197 156 148 104 277 119 233 267 131 295 74 284 216 328 172 61* 439 76* 424 333 167 141 159 91 67* 42*
160 101 59 59 59 42 37 93 31 76 84 48 91 21 103 57 104 56 23 137 30 130 110 51 40 58 26 19 17
Be tech savvy 32% 41% 23% 30% 38% 29% 35% 33% 26% 33% 32% 36% 31% 28% 36% 27% 32% 32% 38% 31% 39% 31% 33% 30% 28% 37% 29% 28% 40%
B M O
340 147 193 138 97 105 67 184 88 157 183 84 203 53 182 158 224 116 38 302 46 294 223 116 101 101 65 48 25
Be people savvy 68% 59% 77% 70% 62% 71% 65% 67% 74% 67% 68% 64% 69% 72% 64% 73% 68% 68% 62% 69% 61% 69% 67% 70% 72% 63% 71% 72% 60%
A K N
Proportions/Means: Columns Tested (5% risk level) - A/B - C/D/E - F/G/H - I/J - K/L/M - N/O - P/Q - R/S - T/U - V/W - X/Y/Z/a/b * small base
Global @dvisor: January 2012 603 of 700
16. Global @dvisor January 2012 Detailed Tables
Global @dvisor: Social Media Survey
SOCIALOGUE
Which would you rather do?
Japan
Senior Executive/Decision
Japan Gender Age Household Income Marital Status Education Chief Income Earner Employment Business Owner Maker/Leader
Not
Total Male Female Under 35 35 to 49 50 to 64 Low Medium High Married Other Low Medium High Yes No Employed Employed Yes No Yes No
A B C D E F G H I J K L M N O P Q R S T U
Base: All Respondents (unwtd) 1028 525 503 370 332 326 617 351 60 583 445 330 239 459 470 558 656 372 120 908 139 889
Base: All Respondents (wtd) 500 251 249 186 150 165 299 171 30* 288 212 159 117 224 228 272 320 180 59 441 68 432
207 121 86 83 67 57 127 69 11 106 101 72 46 89 101 106 133 74 19 189 23 184
Be tech savvy 41% 48% 35% 45% 45% 35% 42% 41% 36% 37% 48% 45% 40% 40% 44% 39% 42% 41% 32% 43% 34% 43%
B E E I R T
293 130 163 103 83 108 172 102 19 182 111 88 70 135 127 166 187 106 40 253 45 248
Be people savvy 59% 52% 65% 55% 55% 65% 58% 59% 64% 63% 52% 55% 60% 60% 56% 61% 58% 59% 68% 57% 66% 57%
A CD J S U
Proportions/Means: Columns Tested (5% risk level) - A/B - C/D/E - F/G/H - I/J - K/L/M - N/O - P/Q - R/S - T/U * small base
Global @dvisor: January 2012 604 of 700
17. Global @dvisor January 2012 Detailed Tables
Global @dvisor: Social Media Survey
SOCIALOGUE
Which would you rather do?
South Korea
Senior Executive/Decision
South Korea Gender Age Household Income Marital Status Education Chief Income Earner Employment Business Owner Maker/Leader
Not
Total Male Female Under 35 35 to 49 50 to 64 Low Medium High Married Other Low Medium High Yes No Employed Employed Yes No Yes No
A B C D E F G H I J K L M N O P Q R S T U
Base: All Respondents (unwtd) 500 261 239 201 188 111 95 184 221 286 214 19 148 333 252 248 351 149 67 433 107 393
Base: All Respondents (wtd) 500 253 247 210 193 97 99* 187 214 276 224 21** 153 326 241 259 341 159 63* 437 102 398
171 102 69 68 74 29 35 67 69 93 78 9 50 112 92 79 121 50 21 150 36 135
Be tech savvy 34% 40% 28% 32% 38% 30% 35% 36% 32% 34% 35% 42% 33% 34% 38% 30% 36% 31% 33% 34% 35% 34%
B
329 150 179 142 119 68 64 120 145 184 146 12 103 214 149 180 220 109 43 287 66 263
Be people savvy 66% 60% 72% 68% 62% 70% 65% 64% 68% 66% 65% 58% 67% 66% 62% 70% 64% 69% 67% 66% 65% 66%
A
Proportions/Means: Columns Tested (5% risk level) - A/B - C/D/E - F/G/H - I/J - K/L/M - N/O - P/Q - R/S - T/U * small base; ** very small base (under 30) ineligible for sig testing
Global @dvisor: January 2012 605 of 700
18. Global @dvisor January 2012 Detailed Tables
Global @dvisor: Social Media Survey
SOCIALOGUE
Which would you rather do?
Russia
Senior Executive/Decision
Russia Gender Age Household Income Marital Status Education Chief Income Earner Employment Business Owner Maker/Leader
Not
Total Male Female Under 35 35 to 49 50 to 64 Low Medium High Married Other Low Medium High Yes No Employed Employed Yes No Yes No
A B C D E F G H I J K L M N O P Q R S T U
Base: All Respondents (unwtd) 504 258 246 194 199 111 18 50 436 246 258 100 279 125 290 214 457 47 36 468 76 428
Base: All Respondents (wtd) 500 240 260 211 184 105 18** 54* 428 236 264 146* 266 88 279 221 449 51* 33* 467 73* 427
163 92 71 69 60 33 7 20 136 88 75 53 89 21 86 77 140 23 9 154 20 143
Be tech savvy 33% 38% 28% 33% 33% 32% 37% 37% 32% 37% 29% 36% 33% 24% 31% 35% 31% 45% 29% 33% 27% 34%
B J
337 149 188 142 124 71 12 34 292 148 188 93 177 67 193 143 309 28 23 314 54 283
Be people savvy 67% 62% 72% 67% 67% 68% 63% 63% 68% 63% 71% 64% 67% 76% 69% 65% 69% 55% 71% 67% 73% 66%
A I
Proportions/Means: Columns Tested (5% risk level) - A/B - C/D/E - F/G/H - I/J - K/L/M - N/O - P/Q - R/S - T/U * small base; ** very small base (under 30) ineligible for sig testing
Global @dvisor: January 2012 606 of 700
19. Global @dvisor January 2012 Detailed Tables
Global @dvisor: Social Media Survey
SOCIALOGUE
Which would you rather do?
Sweden
Senior Executive/Decision
Sweden Gender Age Household Income Marital Status Education Chief Income Earner Employment Business Owner Maker/Leader
Not
Total Male Female Under 35 35 to 49 50 to 64 Low Medium High Married Other Low Medium High Yes No Employed Employed Yes No Yes No
A B C D E F G H I J K L M N O P Q R S T U
Base: All Respondents (unwtd) 502 273 229 159 154 189 208 252 42 139 363 331 78 93 341 161 316 186 47 455 64 438
Base: All Respondents (wtd) 500 253 247* 186* 158* 157* 192* 258 51** 155* 345 105 263* 133* 340 160* 360 140* 63** 437 83* 417
135 97 37 32 57 46 39 77 19 48 86 33 68 34 102 32 104 30 10 125 14 120
Be tech savvy 27% 38% 15% 17% 36% 29% 21% 30% 37% 31% 25% 31% 26% 25% 30% 20% 29% 22% 15% 29% 17% 29%
B C
365 156 209 154 100 111 152 181 32 107 258 72 194 99 238 127 256 110 54 312 68 297
Be people savvy 73% 62% 85% 83% 64% 71% 79% 70% 63% 69% 75% 69% 74% 75% 70% 80% 71% 78% 85% 71% 83% 71%
A D
Proportions/Means: Columns Tested (5% risk level) - A/B - C/D/E - F/G/H - I/J - K/L/M - N/O - P/Q - R/S - T/U * small base; ** very small base (under 30) ineligible for sig testing
Global @dvisor: January 2012 607 of 700
20. Global @dvisor January 2012 Detailed Tables
Global @dvisor: Social Media Survey
SOCIALOGUE
Which would you rather do?
Indonesia
Senior Executive/Decision
Indonesia Gender Age Household Income Marital Status Education Chief Income Earner Employment Business Owner Maker/Leader
Not
Total Male Female Under 35 35 to 49 50 to 64 Low Medium High Married Other Low Medium High Yes No Employed Employed Yes No Yes No
A B C D E F G H I J K L M N O P Q R S T U
Base: All Respondents (unwtd) 509 258 251 285 173 51 75 266 168 305 204 205 42 262 227 282 424 85 61 448 100 409
Base: All Respondents (wtd) 500 250 250 281 162 56* 80* 258 163 288 212 208 41* 250 216 284 407 93* 60* 440 96* 404
195 108 86 92 73 30 20 100 74 122 72 73 16 105 93 102 162 33 26 169 43 151
Be tech savvy 39% 43% 34% 33% 45% 53% 25% 39% 46% 42% 34% 35% 40% 42% 43% 36% 40% 36% 43% 38% 45% 37%
B C C F F
305 142 164 190 89 27 59 158 88 166 140 135 25 145 123 183 246 59 34 272 53 252
Be people savvy 61% 57% 66% 67% 55% 47% 75% 61% 54% 58% 66% 65% 60% 58% 57% 64% 60% 64% 57% 62% 55% 63%
A DE GH
Proportions/Means: Columns Tested (5% risk level) - A/B - C/D/E - F/G/H - I/J - K/L/M - N/O - P/Q - R/S - T/U * small base
Global @dvisor: January 2012 608 of 700