SlideShare une entreprise Scribd logo
1  sur  10
Télécharger pour lire hors ligne
ORIGINAL ARTICLE
Impact of Medication Adherence on Hospitalization Risk
and Healthcare Cost
Michael C. Sokol, MD, MS, Kimberly A. McGuigan, PhD, Robert R. Verbrugge, PhD,
and Robert S. Epstein, MD, MS
Objective: The objective of this study was to evaluate the impact of
medication adherence on healthcare utilization and cost for 4
chronic conditions that are major drivers of drug spending: diabetes,
hypertension, hypercholesterolemia, and congestive heart failure.
Research Design: The authors conducted a retrospective cohort
observation of patients who were continuously enrolled in medical
and prescription benefit plans from June 1997 through May 1999.
Patients were identified for disease-specific analysis based on claims
for outpatient, emergency room, or inpatient services during the first
12 months of the study. Using an integrated analysis of administra-
tive claims data, medical and drug utilization were measured during
the 12-month period after patient identification. Medication adher-
ence was defined by days’ supply of maintenance medications for
each condition.
Patients: The study consisted of a population-based sample of
137,277 patients under age 65.
Measures: Disease-related and all-cause medical costs, drug costs,
and hospitalization risk were measured. Using regression analysis,
these measures were modeled at varying levels of medication ad-
herence.
Results: For diabetes and hypercholesterolemia, a high level of
medication adherence was associated with lower disease-related
medical costs. For these conditions, higher medication costs were
more than offset by medical cost reductions, producing a net
reduction in overall healthcare costs. For diabetes, hypercholester-
olemia, and hypertension, cost offsets were observed for all-cause
medical costs at high levels of medication adherence. For all 4
conditions, hospitalization rates were significantly lower for patients
with high medication adherence.
Conclusions: For some chronic conditions, increased drug utiliza-
tion can provide a net economic return when it is driven by
improved adherence with guidelines-based therapy.
Key Words: adherence, drug utilization, healthcare costs,
hospitalization, pharmaceutical care
(Med Care 2005;43: 521–530)
Prescription drug expenditures are the fastest growing
component of healthcare costs in the United States.1,2
National outpatient drug spending has increased by 13% to
16% per year during the past few years,2
and it is expected to
continue to grow by 9% to 13% per year during the coming
decade.2
Much of the growth in drug spending is the result of
increased use (more drugs prescribed for more people for
more indications); this accounts for more than 50% of the
growth in drug spending for many common conditions, in-
cluding diabetes and hypercholesterolemia.1,3
In an effort to
manage this growth, health plan sponsors and plan managers
have responded with a variety of programs aimed at contain-
ing utilization and cost. Some patients in prescription benefit
plans have experienced higher copayments and tighter utili-
zation controls, and physicians have been under increasing
pressure to factor drug costs and coverage limits into their
treatment decisions. All of the participants in the healthcare
system face a common dilemma: are the benefits of prescrip-
tion drugs worth the increased cost?
For many medical conditions, there is strong evidence
that prescription drugs provide clinical value. Based on that
evidence, pharmacotherapy has become an integral compo-
nent of the treatment guidelines for many high-prevalence
diseases, including diabetes,4
hypertension,5
hypercholester-
olemia,6
and congestive heart failure (CHF).7
The more
difficult question is whether prescription drugs provide net
economic value to those who pay for health care. Does drug
treatment reduce overall healthcare costs by reducing pa-
tients’ need for expensive medical services such as hospital-
ization and emergency room (ER) treatment? Results of this
kind have been demonstrated for several medical condi-
From the Department of Medical Affairs, Medco Health Solutions, Inc.,
Franklin Lakes, New Jersey.
Dr. Sokol and Dr. McGuigan were full-time employees of Medco Health
Solutions, Inc., when the research was conducted and both have since
taken employment outside the company.
This research was designed and conducted by the authors as part of their
employment with Medco Health Solutions, Inc. The manuscript was
reviewed through an internal publications review process to ensure data
integrity and editorial quality. The research was not funded by, or subject
to the review of, any outside company or organization.
Reprints: Robert R. Verbrugge, PhD, Department of Medical Affairs, Medco
Health Solutions, Inc., 100 Parsons Pond Drive, Franklin Lakes, NJ
07417. E-mail: robert_verbrugge@medco.com.
Copyright © 2005 by Lippincott Williams & Wilkins
ISSN: 0025-7079/05/4306-0521
Medical Care • Volume 43, Number 6, June 2005 521
tions.8–13
For example, lipid-lowering drugs are generally
cost-effective in secondary prevention of heart disease; by
reducing the risk of cardiovascular events, they can produce a
net return on investment.10
This type of cost offset is a
welcome benefit, but it may not be found for all high-
prevalence conditions for which drug therapy is recom-
mended. Some drug treatments may show a medical cost
offset (in the short term or long term), and some may not
show an offset at all.14
The therapeutic and economic benefits of drug treat-
ment are often demonstrated in the controlled settings of
clinical trials. These benefits may not be realized in day-to-
day practice, especially for patients who are only partially
compliant with their prescribed therapy. Adherence with me-
dication therapy is generally low—approximately 50% to
65%, on average, for common chronic conditions such as
hypertension and diabetes.15,16
When conditions are treated
suboptimally, symptoms and complications may worsen,
leading to increased use of hospital and ER services, office
visits, and other medical resources.16,17
This suggests that
higher levels of medication adherence may have positive
economic value for some chronic conditions. Increased ad-
herence may generate medical savings that more than offset
the associated increases in drug costs. For some chronic
conditions, there is evidence to support this hypothesis.14,18–23
There has been relatively little research assessing the
cost impact of medication adherence for treatments provided
under benefit plans in population-based settings. Some stud-
ies have assessed how healthcare costs are affected when
patients reduce their drug use in response to coverage limits
or copayment requirements. In a study of coverage limits in
a Medicaid population, there was a net increase in total
healthcare costs when patients were limited to a maximum of
3 prescriptions per month; many patients cut back on medi-
cations for chronic conditions (such as diabetes and CHF),
and their use of medical services increased.24,25
Medical
utilization may also increase when patients cut back on drug
use in response to copayment requirements.26–29
These stud-
ies suggest that if patients’ adherence levels drop as a result
of benefit plan changes, medical utilization for some condi-
tions may increase, and the increased medical costs may
exceed the savings in drug costs.14
In this observational study, we evaluate the relation-
ships among medication adherence, medical utilization, and
healthcare cost in a large population of patients with com-
bined benefit eligibility for prescription drugs and medical
services. Drug cost, medical cost, and utilization are mea-
sured using pharmacy claims data and medical claims data,
integrated at the patient level. After adjusting for age, comor-
bidity, and other factors, we estimate healthcare cost and
hospitalization risk as a function of medication adherence.
The analysis covers 4 high-prevalence conditions for which
prescription drugs play a key role: diabetes, hypertension,
hypercholesterolemia, and CHF. These conditions are gener-
ally chronic in presentation and often require long-term
medication therapy.
METHODS
Study Population
Patients were participants in medical and drug benefit
plans sponsored by a large manufacturing employer. Patients
were initially identified for the study population if they had
continuous medical and drug benefit eligibility during the
period of the study, June 1997 through May 1999. Medi-
cal plan types included a health maintenance organization
(HMO), a preferred provider organization (PPO), and a tra-
ditional fee-for-service (FFS) plan; participants in a small,
capitated managed care plan were excluded because full
medical cost data were not available at the patient level.
Patients aged 65 and older (n ϭ 73,997) were excluded
because medical claims data were not available for their
primary benefit plan (Medicare). A total of 137,277 patients
(employees and dependents) met the inclusion criteria for the
final study population. Age in the study population was distrib-
uted as follows: 0–18 (20.0%), 19–39 (16.0%), and 40–64
(64.0%). The population was 48.9% female and 51.1% male.
Medical data for the study population were drawn from
an administrative claims database maintained by a health plan
organization for all medical plan types. Drug utilization data
were drawn from a prescription claims database maintained
by Medco Health, the pharmacy benefits management com-
pany that manages the prescription benefit plan for this
population.
Sample Selection
Separate study samples were drawn from the study
population for purposes of analysis. A study sample was
identified for each of the 4 conditions under study: diabetes,
hypertension, hypercholesterolemia, and CHF. Patients were
identified for a study sample if they used medical services for
the condition and if they received prescription drugs for the
condition. Patients were included in multiple study samples if
they met the inclusion criteria for more than 1 of the medical
conditions under study. Specific inclusion criteria were as
follows.
Medical Claims
Patients were initially identified for a study sample if
they received medical services for the condition during the
first 12 months of the study period. To minimize false-
positives, patients were identified for a study sample if they
had 2 or more medical claims for outpatient services on
different dates during the year, or if they had 1 or more claims
for hospitalization or ER service during the year; outpatient
services included physician office visits and outpatient de-
Sokol et al Medical Care • Volume 43, Number 6, June 2005
© 2005 Lippincott Williams & Wilkins522
partment visits. For each medical condition under study,
medical services were identified using primary and secondary
International Classification of Diseases, 9th Revision (ICD-9)
codes30
in patients’ claim records (Appendix).
Drug Claims
Patients were included in the final study sample if they
received 1 or more prescriptions for the target condition
during the 12 months after their first medical index claim (the
first of 2 or more dates of outpatient service for the target
condition, or the first of 1 or more dates of inpatient or ER
service). The study did not include patients who were diag-
nosed with a condition but who were not using medications to
treat it.
Data Collection
Utilization Data
Medical and drug claims were tracked concurrently
during a 12-month analysis period for the patients in each
study sample. For each patient, the analysis period began on
the date of the first index claim, as defined previously.
Sociodemographic Data
Data on age, sex, employment group, and medical plan
type were drawn from an eligibility database maintained by
the health plan organization. Employment group was hourly
or salaried (benefit plans differed for these 2 groups). Medical
plan type was HMO, PPO, or FFS.
Adherence
Medication adherence was measured by patients’ over-
all exposure to medications used to treat a given condition.
Adherence was defined as the percentage of days during the
analysis period that patients had a supply of 1 or more
maintenance medications for the condition (based on “days’
supply” data in patients’ prescription claim records). This
measurement strategy reduces the risk of overestimating
adherence (eg, in cases in which patients have overlapping
prescriptions as a result of a change in therapy). For prescrip-
tions extending beyond the end of the analysis period, days’
supply was truncated at the end of the period. Patients in each
study sample were stratified into 5 categories based on their
adherence score: 1–19%, 20–39%, 40–59%, 60–79%, or
80–100%.
Comorbidity
Two comorbidity scores were derived for the patients in
each study sample. The Charlson score was based on ICD-9
codes in patients’ medical claims during the analysis period;
it was computed using a Deyo-adapted Charlson scale.31
A
chronic disease index (CDI) was computed from patients’
prescription claims during the analysis period. The CDI is a
composite measure of drug use across a broad range of
chronic conditions; a related index has been validated in
previous studies.32,33
For each analysis, the CDI score ex-
cluded the target medications for the condition under study;
this precluded any confounding with the primary predictor of
interest (medication adherence). The 2 comorbidity scores
differ in their data source (medical vs. drug claims) and in the
medical conditions they assess. The measures are positively
correlated but not colinear. Significant positive correlations
were observed for all 4 study samples (r ϭ 0.40, diabetes;
0.42, hypertension; 0.38, hypercholesterolemia; 0.38, CHF;
P Ͻ 0.0001).
Disease Subtype
For each target condition, specific ICD-9 codes were
used as indicators of disease subtype. If any medical claim
during the follow-up period contained 1 of these codes, the
indicator was scored “1” for that patient; otherwise, it was
scored “0”. Scores were derived independently for each
indicator.
Outcome Measures
The primary economic measures were total medical
costs and prescription drug costs during the 12-month anal-
ysis period. Total healthcare costs were defined as the sum of
medical costs and drug costs. Medical costs included outpa-
tient services, ER services, and hospitalization; nursing home
and home care services were not included. Drug costs in-
cluded all ambulatory prescriptions (dispensed by outpatient,
community-based, or mail-service pharmacies). Cost was
defined as net cost to the plan sponsor; patient copayments
and deductibles were not included.
Two types of cost were measured from the claims data:
all-cause costs and disease-related costs. All-cause costs were
medical or drug costs associated with any condition during
the 12-month period. Disease-related costs were costs asso-
ciated with treatment of the target condition; they were a
subset of all-cause costs. For medical services, disease-re-
lated costs were identified by primary and secondary ICD-9
codes in medical claims data (Appendix). For hypertension
and hypercholesterolemia, disease-related medical costs were
identified by a broader set of cardiovascular codes that in-
cluded common sequelae of the target condition (such as
myocardial infarction or stroke). In many settings, these acute
sequelae are more likely to be used for diagnostic coding,
especially in cases of hospitalization or ER treatment. If
claims analysis is restricted to diagnostic codes for the un-
derlying condition (such as hypercholesterolemia), medical
utilization and cost can be seriously underestimated. For
drugs, disease-related costs were identified by drug classes in
prescription claims data (Appendix).
The primary measure of medical utilization was hospi-
talization risk. This was defined as the probability of 1 or
more hospitalizations during a 12-month period, expressed as
Medical Care • Volume 43, Number 6, June 2005 Impact of Medication Adherence
© 2005 Lippincott Williams & Wilkins 523
a percentage. Observed probability values were derived from
medical claims data during the analysis period.
Data Analysis
We used multiple linear regression to evaluate the
association between medication adherence and healthcare
costs for each target condition. Cost estimates were adjusted
for age, sex, comorbidity, disease subtype, employment
group, and medical plan type. The following primary covari-
ates were used in the regression model: age, sex, Charlson
score, CDI score, employment group, PPO participation,
HMO participation, and the ICD-9-based subtype indicators
for the target condition. To adjust for possible nonlinearities
in functional form, 3 interaction terms were used: age*age,
age*sex, and CDI-score*sex. For each study sample, separate
analyses were conducted for each category of cost (disease-
related medical, disease-related drug, all-cause medical, and
all-cause drug).
We used a logistic regression model to estimate the
relationship between medication adherence and hospitaliza-
tion risk for each target condition, adjusting for the same
covariates as in the cost models described previously. For
each condition, we estimated hospitalization risk as a func-
tion of adherence level.
Statistical Analysis
Overall fit of the regression models was tested using
F-value and adjusted r-square (cost models) and Wald ␹2
(hospitalization models). Differences between adherence lev-
els were evaluated for the 2 primary outcome measures:
medical cost and hospitalization risk. The statistical signifi-
cance of these differences was tested using 2-tailed t tests
(medical cost) and ␹2
tests (hospitalization risk). The out-
come for the highest adherence level (80–100%) was used as
the reference for each pairwise comparison. Correlations
among measures were evaluated using Pearson product mo-
ment correlation coefficients.
RESULTS
Patient Characteristics
The characteristics of patients in each study sample are
shown in Table 1.
Disease-Related Measures
Estimated disease-related outcomes are shown in Table
2 for each target condition and adherence level. These esti-
mates represent relative levels of cost and utilization after
adjustment for all covariates.
Disease-Related Costs
For diabetes and hypercholesterolemia, high levels of
medication adherence were associated with lower disease-
related medical costs. These differences were statistically
significant for most adherence levels when compared with the
highest level of adherence (P Ͻ 0.05). For both of these
conditions, total healthcare costs tended to decrease at high
levels of medication adherence, despite the increased drug
costs. For diabetes, disease-related healthcare costs decreased
monotonically as a function of exposure to diabetes medica-
tions (Fig. 1). For hypercholesterolemia, healthcare costs
were generally lowest for patients with 80% to 100% adher-
ence, although the results were more variable than for diabe-
tes. Medical costs for hypertension tended to be lowest at
80% to 100% adherence, but the differences were generally
not significant. Differences for CHF were not significant.
Hospitalization Risk
For all 4 conditions, patients who maintained 80% to
100% medication adherence were significantly less likely to
be hospitalized compared with patients with lower levels of
adherence. These differences were statistically significant for
most of the adherence levels tested (P Ͻ 0.05). For diabetes,
there was a monotonic decrease in hospitalization risk as
adherence to drug treatment increased (Fig. 1).
TABLE 1. Characteristics of Study Samples
Condition
Sample
Size (n)
Mean
Age (SD)
Percent
Female
Mean Comorbidity
Scores (SD) Plan Type
Percent
SalariedCharlson CDI
Percent
PPO
Percent
HMO
Diabetes 3260 53.9 (9.1) 45.4 4.4 (3.4) 0.6 (0.9) 10.0 11.0 32.3
Hypertension 7981 54.2 (7.7) 46.7 3.4 (2.9) 0.7 (1.0) 9.7 12.0 37.7
Hypercholesterolemia 2981 54.5 (7.5) 44.3 3.2 (2.9) 0.6 (0.9) 9.3 12.9 54.3
CHF 863 55.7 (7.9) 45.3 4.7 (3.1) 1.4 (1.2) 8.7 10.7 17.2
SD indicates standard deviation; CDI, chronic disease index; PPO, preferred provider organization; HMO, health maintenance organization; CHF,
congestive heart failure.
Sokol et al Medical Care • Volume 43, Number 6, June 2005
© 2005 Lippincott Williams & Wilkins524
All-Cause Measures
Estimated all-cause outcomes are shown in Table 3 for
each target condition and adherence level.
All-Cause Costs
For diabetes, hypertension, and hypercholesterol-
emia, high levels of adherence with condition-specific
drugs were associated with lower medical costs across all
of the patients’ treated conditions. These differences were
statistically significant for most adherence levels (P Ͻ
0.05). For all 3 conditions, total healthcare costs tended to
decrease at high levels of drug adherence, despite the
increased drug costs. For diabetes, all-cause healthcare
costs decreased monotonically with exposure to diabetes
medications. Similar, although less uniform, patterns were
observed for hypertension (Fig. 2) and hypercholesterol-
emia; healthcare costs were generally lowest for patients
with 80% to 100% adherence. Differences for CHF were
not significant.
Hospitalization Risk
For all 4 conditions, all-cause hospitalization rates
were lowest for patients who had the highest level of
medication adherence. These differences were statistically
significant for all adherence levels (P Ͻ 0.05). For diabetes
and hypertension, there was a monotonic decrease in
hospitalization rates as medication adherence increased
(Fig. 2, hypertension).
TABLE 2. Disease-Related Healthcare Costs and Hospitalization Risk at Varying Levels of Medication Adherence
Condition
Adherence
Level N Medical Cost ($) Drug Cost ($) Total Cost ($) Hospitalization Risk (%)
Diabetes 1–19 182 8812* 55 8867 30*
20–39 259 6959* 165 7124 26*
40–59 419 6237* 285 6522 25*
60–79 599 5887* 404 6291 20*
80–100 1801 3808 763 4570 13
F ‫؍‬ 36.62†
F ‫؍‬ 88.57†
␹2
(25 df) ‫؍‬ 543.6†
Adj. r2
‫؍‬ 0.18 Adj. r2
‫؍‬ 0.36
Hypertension 1–19 350 4847 31 4878 28*
20–39 344 5973* 89 6062 24*
40–59 562 5113 184 5297 24*
60–79 921 4977 285 5262 20
80–100 5804 4383 489 4871 19
F ‫؍‬ 46.44†
F ‫؍‬ 171.98†
␹2
(31 df) ‫؍‬ 1256.3†
Adj. r2
‫؍‬ 0.13 Adj. r2
‫؍‬ 0.37
Hypercholesterolemia 1–19 167 6810* 78 6888 15*
20–39 216 4786* 213 4999 13
40–59 324 3452 373 3825 15*
60–79 520 4938* 603 5541 14*
80–100 1754 3124 801 3924 12
F ‫؍‬ 18.99†
F ‫؍‬ 320.08†
␹2
(25 df) ‫؍‬ 474.7†
Adj. r2
‫؍‬ 0.10 Adj. r2
‫؍‬ 0.65
CHF 1–19 86 9826 15 9841 58
20–39 70 7643 90 7733 63*
40–59 82 11,244 134 11,378 65*
60–79 107 13,766 158 13,924 64*
80–100 518 12,261 437 12,698 57
F ‫؍‬ 5.33†
F ‫؍‬ 25.73†
␹2
(24 df) ‫؍‬ 169.7†
Adj. r2
‫؍‬ 0.08 Adj. r2
‫؍‬ 0.34
*Indicates that the outcome is significantly higher than the outcome for the 80–100% adherence group (P Ͻ 0.05). Differences were tested for medical
cost and hospitalization risk.
†
P Ͻ 0.0001.
CHF indicates congestive heart failure.
Medical Care • Volume 43, Number 6, June 2005 Impact of Medication Adherence
© 2005 Lippincott Williams & Wilkins 525
Covariates
Cost and hospitalization risk showed significant posi-
tive associations with Charlson score and CDI score in most
of the models tested (P Ͻ 0.05). Many of the disease subtype
indicators also contributed significantly to model fit in these
analyses. For most conditions, medical costs and hospitaliza-
tion risk were significantly higher for hourly employees (P Ͻ
0.05). Age, sex, medical plan type, and the interaction terms
generally had no effect on the outcome measures. CDI scores
showed significant positive correlations with adherence (r ϭ
0.15, diabetes; 0.28, hypertension; 0.16, hypercholesterol-
emia; 0.19, CHF; P Ͻ 0.0001). Correlations between Charlson
scores and adherence were generally weak and nonsignificant
(r ϭ 0.00–0.07).
DISCUSSION
For diabetes and hypercholesterolemia, high levels of
medication adherence are generally associated with a net
economic benefit in disease-related costs. Higher drug costs
are more than offset by reductions in medical costs, yielding
a net reduction in overall healthcare costs. This pattern is
observed at all adherence levels for diabetes and at most
adherence levels for hypercholesterolemia. These results are
consistent with earlier studies that have reported linkages
between medication adherence and health outcomes for these
conditions.21,34–37
For hypertension, medical costs tended to
be lowest at high levels of medication adherence, but offsets
in total healthcare costs were generally not found. The cost
impacts of adherence may be less salient for conditions like
hypertension, for which a large fraction of the treated popu-
lation has a relatively low risk of near-term complications.14
No significant associations between cost and adherence were
observed for CHF. Adherence-related differences in hospital-
ization risk were relatively small for these patients, and cost
variability in the CHF study sample was exceptionally high.
To our knowledge, the current study is the first to
demonstrate this pattern of cost offsets for diabetes and
hypercholesterolemia in a large benefit plan population.
Given the chronic nature of these conditions, it is likely that
most patients in these study samples had been receiving
medication treatment for an extended period before the anal-
ysis period began. The observed savings probably reflect the
cumulative effects of adherence levels sustained over several
years. Adherence rates in this study were typical of the rates
often reported for chronic conditions.15,16,34,38
Observed ad-
herence rates (defined as the proportion of patients with
80–100% adherence) ranged between 55% and 73% for the 4
conditions in this study.
Although a formal cost–benefit analysis is not possible
in an observational study of this type, the return on invest-
ment (ROI) can be estimated by comparing costs across
adherence ranges (quintiles) in the disease-related analyses.
For diabetes, the average incremental drug cost for a 20%
increase in drug utilization is $177 and the associated disease-
related medical cost reduction is $1251, for a net savings of
$1074 per patient (an average ROI of 7.1:1). For cardiovas-
cular conditions, the average ROI for a 20% increase in drug
utilization is 4.0:1 (hypertension) and 5.1:1 (hypercholester-
olemia). The results for diabetes (Fig. 1) suggest that there
may be an inverse linear relationship between adherence and
cost for some conditions; this should be tested systematically
in future research.
Medication adherence is associated with net savings in
all-cause healthcare costs for diabetes, hypertension, and
hypercholesterolemia. For people with diabetes, all-cause
medical costs decrease monotonically as adherence with
hypoglycemic drugs increases. These savings probably reflect
the effects of improved glycemic control on related condi-
tions (such as microvascular disease and neuropathy), reduc-
ing the need for medical services.39–42
Similarly, for the
cardiovascular conditions, the cost offsets at high levels of
medication adherence probably reflect the impact of cardio-
vascular medications on related conditions; for example,
improved control of hypertension can slow the progression of
renal disease.5
Adherence-based savings in medical costs appear to be
driven primarily by reductions in hospitalization rates at
higher levels of medication adherence. For all of the condi-
tions studied here, hospitalization rates were lowest for pa-
tients who had high levels of adherence. Hospitalization is the
largest component of medical costs in these study samples, so
it is likely that the changes in hospitalization risk are the
FIGURE 1. Diabetes: impact of medication adherence on dis-
ease-related healthcare costs and hospitalization risk.
Sokol et al Medical Care • Volume 43, Number 6, June 2005
© 2005 Lippincott Williams & Wilkins526
primary driver of the cost savings observed at higher levels of
adherence. This is consistent with results reported elsewhere
on the impact of pharmacotherapy on hospitalization
rates.8,12,43,44
This study was observational, so it is not possible to
draw definite conclusions about the causal relationships
among adherence, utilization, and cost. The cross-sectional
nature of the design also poses some interpretive problems,
because it yields some heterogeneity in the groups under
study; for example, the “low-adherence” groups may include
some patients who received short-term therapy or who started
drug therapy late in the analysis period. However, given the
chronic nature of the conditions under study, it is likely that
most patients were continuing medication users (ie, it is likely
that their treatment had started before the analysis period
began). In cohort-based samples of patients with chronic
conditions, most patients are prevalent (not incident) cases.
The study can provide a good indication of the typical
benefits of medication adherence in continuing patients with
chronic disease. The study was not designed to track the time
course of treatment of newly diagnosed patients, so it cannot
define how quickly after the start of therapy the benefits of
adherence begin to accrue.
The inclusion criteria for the study samples may limit
the generalizability of the findings reported here. To reduce
the risk of false-positives, at least 2 disease-specific claims
were required when patients were identified based on outpa-
tient claims. A single outpatient claim could indicate an office
visit for evaluation; 2 claims are more likely to indicate a
positive diagnosis. However, this selection methodology may
TABLE 3. All-Cause Healthcare Costs and Hospitalization Risk at Varying Levels of Medication Adherence
Condition
Adherence
Level N Medical Cost ($) Drug Cost ($) Total Cost ($) Hospitalization Risk (%)
Diabetes 1–19 182 15,186* 1312 16,498 55*
20–39 259 11,200* 1877 13,077 47*
40–59 419 11,008* 1970 12,978 42*
60–79 599 9363* 2121 11,484 39*
80–100 1801 6377 2510 8886 30
F ‫؍‬ 51.33†
F ‫؍‬ 51.38†
␹2
(25 df) ‫؍‬ 695.3†
Adj. r2
‫؍‬ 0.24 Adj. r2
‫؍‬ 0.24
Hypertension 1–19 350 8831* 916 9747 44*
20–39 344 10,286* 952 11,238 39*
40–59 562 8368* 1123 9491 36*
60–79 921 7658 1271 8929 30*
80–100 5804 6570 1817 8386 27
F ‫؍‬ 66.51†
F ‫؍‬ 50.94†
␹2
(31 df) ‫؍‬ 1573.2†
Adj. r2
‫؍‬ 0.18 Adj. r2
‫؍‬ 0.14
Hypercholesterolemia 1–19 167 9849* 1067 10,916 26*
20–39 216 6830* 1152 7982 18*
40–59 324 5509* 1247 6756 20*
60–79 520 6676* 1736 8412 21*
80–100 1754 4780 1972 6752 16
F ‫؍‬ 22.37†
F ‫؍‬ 101.14†
␹2
(25 df) ‫؍‬ 500.7†
Adj. r2
‫؍‬ 0.11 Adj. r2
‫؍‬ 0.37
CHF 1–19 86 22,003 1961 23,964 83*
20–39 70 17,133 2055 19,188 81*
40–59 82 24,103 2208 26,311 85*
60–79 107 26,373 3412 29,785 84*
80–100 518 19,056 3107 22,164 75
F ‫؍‬ 7.69†
F ‫؍‬ 11.71†
␹2
(24 df) ‫؍‬ 108.7†
Adj. r2
‫؍‬ 0.12 Adj. r2
‫؍‬ 0.18
*Indicates that the outcome is significantly higher than the outcome for the 80–100% adherence group (P Ͻ 0.05). Differences were tested for medical
cost and hospitalization risk.
†
P Ͻ 0.0001.
CHF indicates congestive heart failure.
Medical Care • Volume 43, Number 6, June 2005 Impact of Medication Adherence
© 2005 Lippincott Williams & Wilkins 527
produce a study sample that is weighted toward patients with
more advanced disease or higher comorbidity, because it may
exclude some patients who visit their doctors infrequently. A
selection effect of this kind is suggested by the relatively high
hospitalization rates for patients in these study samples; for
example, the average all-cause hospitalization risk for the
diabetes sample (35.9%) is higher than the rate reported in a
study of primary care patients (21.1%).45
The results of the
current study are indicative of the adherence-related effects
that may be expected for higher-cost patients with more
advanced disease. Cost offsets may not be as prominent for
healthier adults. Further research would be required to deter-
mine the applicability of the reported findings to other pop-
ulations.
Each study sample included some patients who had
more than 1 of the diseases under study. Including these
patients makes the samples more representative, because
combinations of these conditions (eg, diabetes and hyperten-
sion) are common. Excluding these patients would limit the
external validity of the results. However, a consequence of
including these patients is that the 4 study samples are not
strictly independent. The samples provide 4 intersecting (but
not fully independent) views of healthcare utilization in this
benefit plan population.
There are some inherent risks to the use of medical
claims data when measuring utilization and cost. In some
cases, ICD-9 codes on medical claims may not accurately or
completely reflect the patient’s diagnosis. In the current
study, medical chart data were not available to validate the
coding on the medical claims.
The regression models used multiple covariates to con-
trol for the effects of comorbidity on utilization and cost. In
most of the models, comorbidity was a significant predictor
of utilization and cost. It is possible that unmeasured aspects
of comorbidity risk could have biased the reported associa-
tions between adherence and cost. For example, if low-
adherence patients tend to be sicker, then the costs at
low adherence levels would be inflated if comorbidity is not
adequately controlled. However, in this study population,
there was a positive correlation between adherence and co-
morbidity (as measured by CDI scores)—the sicker patients
tended to be more adherent. In this case, if comorbidity is not
adequately controlled, it is more likely that the costs at high
adherence levels will be overestimated. To the degree there is
unmeasured comorbidity risk in this study, the models are
likely to underestimate the cost reductions associated with
high adherence.
CONCLUSION
Although the therapeutic benefits of pharmacotherapy
are well understood, the potential economic returns are often
missed in the public debate over rising prescription drug
costs. Increased drug utilization can provide a net economic
return when it is driven by improved adherence with guide-
lines-based therapy. Our results demonstrate that a net return
may be obtained for 3 chronic conditions that account for a
large share of long-term medication use—diabetes, hyperten-
sion, and hypercholesterolemia. Although drug costs are a
relatively small fraction of total healthcare costs for these
conditions, they have high leverage—a small increase in drug
costs (associated with improved adherence) can produce a
much larger reduction in medical costs. As more of these
medications become available in generic form, their leverage
will become even stronger; it will be possible to achieve the
same therapeutic value and medical cost offset at a signifi-
cantly lower drug cost. Because these benefits derive from
improved adherence, greater attention should be devoted to
educating patients on the value of their drug therapy and
motivating behavior changes that improve adherence.
ACKNOWLEDGMENTS
The authors thank Boris Fainstein, Joan Haynes, and
Rich Mountjoy for their assistance with the design and
conduct of the study; Qingshan Qian and Jianying Yao for
their assistance with the data analysis; and Lon Castle and
Les Paul for their assistance with revision of the manuscript.
REFERENCES
1. National Institute for Health Care Management. Prescription Drug
Expenditures in 2001: Another Year of Escalating Costs. Washing-
FIGURE 2. Hypertension: impact of medication adherence on
all-cause healthcare costs and hospitalization risk.
Sokol et al Medical Care • Volume 43, Number 6, June 2005
© 2005 Lippincott Williams & Wilkins528
ton, DC: National Institute for Health Care Management; May 6,
2002.
2. Centers for Medicare and Medicaid Services (CMS). National health
care expenditures projections: 2003–2013. Available at: http://www.
cms.hhs.gov/statistics/nhe/projections-2003/proj2003.pdf. Accessed Feb-
ruary 12, 2004.
3. Dubois RW, Chawla AJ, Neslusan CA, et al. Explaining drug spending
trends: does perception match reality? Health Aff (Millwood). 2000;19:
231–239.
4. American Diabetes Association. Medical Management of Type 2 Diabetes.
Alexandria, VA: American Diabetes Association; 1998.
5. National Heart, Lung, and Blood Institute. The Sixth Report of the Joint
National Committee on Prevention, Detection, Evaluation, and Treat-
ment of High Blood Pressure. Bethesda, MD: National Institutes of
Health; 1997. NIH publication 98–4080.
6. National Cholesterol Education Program. Third Report of the National
Cholesterol Education Program (NCEP) Expert Panel on Detection,
Evaluation, and Treatment of High Blood Cholesterol in Adults (Adult
Treatment Panel III): Executive Summary. Bethesda, MD: National
Heart, Lung, and Blood Institute; 2001. NIH publication 01–3670.
7. Hunt SA, Baker DW, Chin MH, et al. ACC/AHA Guidelines for the
Evaluation and Management of Chronic Heart Failure in the Adult: A
Report of the American College of Cardiology/American Heart Associ-
ation Task Force on Practice Guidelines (Committee to Revise the 1995
Guidelines for the Evaluation and Management of Heart Failure).
Bethesda, MD: American College of Cardiology; 2001. Publication
71–0216.
8. Balkrishnan R, Norwood GJ, Anderson A. Outcomes and cost ben-
efits associated with the introduction of inhaled corticosteroid ther-
apy in a Medicaid population of asthmatic patients. Clin Ther.
1998;20:567–580.
9. McCombs JS, Nichol MB, Stimmel GL, et al. The cost of antidepressant
drug therapy failure: a study of antidepressant use patterns in a Medicaid
population. J Clin Psychiatry. 1990;51(suppl):60–69.
10. Gotto AM Jr, Grundy SM. Lowering LDL cholesterol: questions from
recent meta-analyses and subset analyses of clinical trial data. Circula-
tion. 1999;99:E1–E7.
11. Lichtenberg FR. Do (more and better) drugs keep people out of hospi-
tals? Am Econ Rev. 1996;86:384–388.
12. Lichtenberg FR. The Benefits and Costs of Newer Drugs: Evidence from
the 1996 Medical Expenditure Panel Survey. Cambridge, MA: National
Bureau of Economic Research; 2001. Available at: http://www.nber.org/
papers/w8147.
13. Lichtenberg FR. Benefits and Costs of Newer Drugs: An Update.
Cambridge, MA: National Bureau of Economic Research; 2002. Avail-
able at: http://www.nber.org/papers/w8996.
14. Kleinke JD. The price of progress: prescription drugs in the health care
market. Health Aff (Millwood). 2001;20:43–60.
15. Nichol MB, Venturini F, Sung JCY. A critical evaluation of the meth-
odology of the literature on medication compliance. Ann Pharmacother.
1999;33:531–540.
16. Schlenk EA, Burke LE, Rand C. Behavioral strategies to improve
medication-taking compliance. In: Burke LE, Ockene IS, eds. Compli-
ance in Healthcare and Research. Armonk, NY: Futura Publishing Co;
2001:57–70.
17. Miller NH. Compliance with treatment regimens in chronic asymptom-
atic diseases. Am J Med. 1997;102:43–49.
18. Groban MD, Evans RM, Edgren B, et al. Clinical benefits and cost
reduction associated with a comprehensive asthma management pro-
gramme at a managed care organisation. Dis Manag Health Outcomes.
1998;4:93–100.
19. Thompson D, Hylan TR, McMullen W, et al. Predictors of a medical-
offset effect among patients receiving antidepressant therapy. Am J
Psychiatry. 1998;155:824–827.
20. McCulloch D. Managing diabetes for improved health and economic
outcomes. Am J Manag Care. 2000;6(suppl):S1089–S1095.
21. White TJ, Chang EY, Vanderplas AM. Impact of compliance on health
care cost and utilization in patients with diabetes mellitus and cardio-
vascular disease ͓Abstract͔. ASHP Midyear Clinical Meeting. 2001;36:
PPR-7. IPA Abstract 38–12727.
22. Rizzo JA, Simons WR. Variations in compliance among hypertensive
patients by drug class: implications for health care costs. Clin Ther.
1997;19:1446–1457.
23. Balkrishnan R, Christensen DB, Bowton DL. Self-reported health status,
prophylactic medication use, and healthcare costs in older adults with
asthma. J Am Geriatr Soc. 2002;50:924–929.
24. Soumerai SB, Avorn J, Ross-Degnan D, Gortmaker S. Payment restric-
tions for prescription drugs under Medicaid: effects on therapy, cost, and
equity. N Engl J Med. 1987;317:550–556.
25. Soumerai SB, Lipton HL. Computer-based drug-utilization review—
risk, benefit, or boondoggle? N Engl J Med. 1995;332:1641–
1645.
26. Tamblyn R, Laprise R, Hanley JA, et al. Adverse events associated with
prescription drug cost-sharing among poor and elderly persons. JAMA.
2001;285:421–429.
27. Steinwachs DM. Pharmacy benefit plans and prescription drug spending.
JAMA. 2002;288:1773–1774.
28. Stuart J, Zacker C. Who bears the burden of Medicaid drug copayment
policies? Health Aff (Millwood). 1999;18:201–212.
29. Heisler M, Langa KM, Eby EL, et al. The health effects of restricting
prescription medication use because of cost. Med Care. 2004;42:626–
634.
30. International Classification of Diseases, 9th Revision, Clinical Mod-
ification (ICD-9-CM). Chicago, IL: American Medical Association;
2003.
31. Deyo RA, Cherkin DC, Ciol MA. Adapting a clinical comorbidity index
for use with ICD-9-CM administrative databases. J Clin Epidemiol.
1992;45:613–619.
32. Von Korff M, Wagner EH, Saunders K. A chronic disease score from
automated pharmacy data. J Clin Epidemiol. 1992;45:197–
203.
33. Clark DO, Von Korff M, Saunders K, et al. A chronic disease score with
empirically derived weights. Med Care. 1995;33:783–795.
34. Cramer JA. A systematic review of adherence with medications for
diabetes. Diabetes Care. 2004;27:1218–1224.
35. Morris AD, Boyle DI, McMahon AD, et al. Adherence to insulin
treatment, glycaemic control, and ketoacidosis in insulin-dependent
diabetes mellitus. Lancet. 1997;350:1505–1510.
36. Tsuyuki RT, Bungard TJ. Poor adherence with hypolipidemic drugs: a
lost opportunity. Pharmacotherapy. 2001;21:576–582.
37. Olson KL, Bungard TJ, Tsuyuki RT. Cholesterol risk management: a
systematic examination of the gap from evidence to practice. Pharma-
cotherapy. 2001;21:807–817.
38. Avorn J, Monette J, Lacour A, et al. Persistence of use of lipid-
lowering medications: a cross-national study. JAMA. 1998;279:
1458–1462.
39. The Diabetes Control and Complications Trial Research Group. The
effect of intensive treatment of diabetes on the development and pro-
gression of long-term complications in insulin-dependent diabetes mel-
litus. N Engl J Med. 1993;329:977–986.
40. UK Prospective Diabetes Study Group. Tight blood pressure control and
risk of macrovascular and microvascular complications in type 2 diabe-
tes (UKPDS 38). BMJ. 1998;317:703–713.
41. Wagner EH, Sandhu N, Newton KM, et al. Effect of improved
glycemic control on health care costs and utilization. JAMA. 2001;
285:182–189.
42. Rubin R, Dietrich KA, Hawk AD. Clinical and economic impact of
implementing a comprehensive diabetes management program in man-
aged care. J Clin Endocrinol Metab. 1998;83:2635–2642.
43. SOLVD Investigators. Effect of enalapril on survival in patients with
reduced left-ventricular ejection fractions and congestive heart failure.
N Engl J Med. 1991;325:293–302.
44. SOLVD Investigators. Effect of enalapril on mortality and the develop-
ment of heart failure in asymptomatic patients with reduced left ven-
tricular ejection fractions. N Engl J Med. 1992;327:685–691.
45. Graber AL, Davidson FA, Brown MS, et al. Hospitalization of patients
with diabetes. Endocr Pract. 1995;1:399–403.
Medical Care • Volume 43, Number 6, June 2005 Impact of Medication Adherence
© 2005 Lippincott Williams & Wilkins 529
APPENDIX Diagnostic Indicators and Drug Classes Used for Patient Identification and Claims Analysis
Condition Patient Identification*
Disease Subtype
Indicators*
Analysis of Medical
Cost/Utilization* Drug Classes
Diabetes 250.xx, 357.2, 362.0x,
366.41, 648.0
250.1–250.9 250.xx, 357.2, 362.0x,
366.41, 648.0
Insulins
Oral hypoglycemics
Hypertension 401.xx–405.xx 401.x–405.x 401.xx–405.xx, 272.x,
410.xx–417.xx, 425.x,
428.xx, 429.0–429.3,
433.xx–438.xx, 440.x,
444.xx
Angiotensin-converting enzyme
(ACE) inhibitors
Angiotensin II receptor blockers
Alpha blockers, beta blockers
Calcium channel blockers
Vasodilators
Sympatholytic hypotensives
Diuretics
Hypercholesterolemia 272.x 272.1–272.9 272.x, 401.xx–405.xx,
410.xx–417.xx, 425.x,
428.xx, 429.0–429.3,
433.xx–438.xx, 440.x,
444.xx
HMG CoA reductase inhibitors
(statins)
Fibrates
Niacin preparations
Bile salt sequestrants
CHF 398.91, 402.01, 402.11,
402.91, 404.01,
404.03, 404.11,
404.13, 404.91,
404.93, 428.xx
402.x, 404.x, 428.0,
428.1, 428.9
398.91, 402.01, 402.11,
402.91, 404.01, 404.03,
404.11, 404.13, 404.91,
404.93, 428.xx
ACE inhibitors
Diuretics
Digitalis glycosides
Carvedilol
*ICD-9 codes (International Classification of Diseases—9th Revision).30
Where indicated, “x” takes any valid value.
Sokol et al Medical Care • Volume 43, Number 6, June 2005
© 2005 Lippincott Williams & Wilkins530

Contenu connexe

Tendances

Hyperglycemia in dm ada 2012
Hyperglycemia in dm ada 2012Hyperglycemia in dm ada 2012
Hyperglycemia in dm ada 2012Freids Mal
 
Medication Error as per 5th Edition Standard of NABH
Medication Error as per 5th Edition Standard of NABHMedication Error as per 5th Edition Standard of NABH
Medication Error as per 5th Edition Standard of NABHAbhishek Srivastava
 
Evaluations of and Interventions for Non Adherence to Oral Medications as a P...
Evaluations of and Interventions for Non Adherence to Oral Medications as a P...Evaluations of and Interventions for Non Adherence to Oral Medications as a P...
Evaluations of and Interventions for Non Adherence to Oral Medications as a P...NiyotiKhilare
 
Assessment and evaluation of poly pharmacy associating factors including anti...
Assessment and evaluation of poly pharmacy associating factors including anti...Assessment and evaluation of poly pharmacy associating factors including anti...
Assessment and evaluation of poly pharmacy associating factors including anti...MUSHTAQ AHMED
 
Polypharmacy resource_JAN 15_NINA BARNETT
Polypharmacy resource_JAN 15_NINA BARNETTPolypharmacy resource_JAN 15_NINA BARNETT
Polypharmacy resource_JAN 15_NINA BARNETTZeshan Ahmed
 
Assessment and evaluation of poly pharmacy associating factors including anti...
Assessment and evaluation of poly pharmacy associating factors including anti...Assessment and evaluation of poly pharmacy associating factors including anti...
Assessment and evaluation of poly pharmacy associating factors including anti...MUSHTAQ AHMED
 
Measurement of outcomes in epidemiology
Measurement of outcomes in epidemiologyMeasurement of outcomes in epidemiology
Measurement of outcomes in epidemiologyDr. Ankit Gaur
 
Dm management
Dm managementDm management
Dm managementsaadiarif
 
Knowledge and attitudes towards complementary and alternative medicine among ...
Knowledge and attitudes towards complementary and alternative medicine among ...Knowledge and attitudes towards complementary and alternative medicine among ...
Knowledge and attitudes towards complementary and alternative medicine among ...home
 
The international survey on the management of allergic rhinitis by physicians...
The international survey on the management of allergic rhinitis by physicians...The international survey on the management of allergic rhinitis by physicians...
The international survey on the management of allergic rhinitis by physicians...Georgi Daskalov
 
Medication Adherence in the Real World
Medication Adherence in the Real WorldMedication Adherence in the Real World
Medication Adherence in the Real WorldCognizant
 
Quality use medicine
Quality use medicineQuality use medicine
Quality use medicineFARAZULHODA
 
profile of adverse drug reactions in a rural tertiary care hospital
profile of adverse drug reactions in a rural tertiary care hospital profile of adverse drug reactions in a rural tertiary care hospital
profile of adverse drug reactions in a rural tertiary care hospital Naser Tadvi
 
Adherence to-selfcare-behaviours-and-knowledge-on-treatment-amongheart-failur...
Adherence to-selfcare-behaviours-and-knowledge-on-treatment-amongheart-failur...Adherence to-selfcare-behaviours-and-knowledge-on-treatment-amongheart-failur...
Adherence to-selfcare-behaviours-and-knowledge-on-treatment-amongheart-failur...Negese Sewagegn Semie
 

Tendances (19)

Hyperglycemia in dm ada 2012
Hyperglycemia in dm ada 2012Hyperglycemia in dm ada 2012
Hyperglycemia in dm ada 2012
 
1482469439(ijcpcr)
1482469439(ijcpcr)1482469439(ijcpcr)
1482469439(ijcpcr)
 
Medication Error as per 5th Edition Standard of NABH
Medication Error as per 5th Edition Standard of NABHMedication Error as per 5th Edition Standard of NABH
Medication Error as per 5th Edition Standard of NABH
 
Evaluations of and Interventions for Non Adherence to Oral Medications as a P...
Evaluations of and Interventions for Non Adherence to Oral Medications as a P...Evaluations of and Interventions for Non Adherence to Oral Medications as a P...
Evaluations of and Interventions for Non Adherence to Oral Medications as a P...
 
Assessment and evaluation of poly pharmacy associating factors including anti...
Assessment and evaluation of poly pharmacy associating factors including anti...Assessment and evaluation of poly pharmacy associating factors including anti...
Assessment and evaluation of poly pharmacy associating factors including anti...
 
Polypharmacy resource_JAN 15_NINA BARNETT
Polypharmacy resource_JAN 15_NINA BARNETTPolypharmacy resource_JAN 15_NINA BARNETT
Polypharmacy resource_JAN 15_NINA BARNETT
 
Modeling Opioid Risk
Modeling Opioid RiskModeling Opioid Risk
Modeling Opioid Risk
 
Assessment and evaluation of poly pharmacy associating factors including anti...
Assessment and evaluation of poly pharmacy associating factors including anti...Assessment and evaluation of poly pharmacy associating factors including anti...
Assessment and evaluation of poly pharmacy associating factors including anti...
 
Measurement of outcomes in epidemiology
Measurement of outcomes in epidemiologyMeasurement of outcomes in epidemiology
Measurement of outcomes in epidemiology
 
Dm management
Dm managementDm management
Dm management
 
Knowledge and attitudes towards complementary and alternative medicine among ...
Knowledge and attitudes towards complementary and alternative medicine among ...Knowledge and attitudes towards complementary and alternative medicine among ...
Knowledge and attitudes towards complementary and alternative medicine among ...
 
Costs of ADRs
Costs of ADRsCosts of ADRs
Costs of ADRs
 
Sore throat disease
Sore throat diseaseSore throat disease
Sore throat disease
 
The international survey on the management of allergic rhinitis by physicians...
The international survey on the management of allergic rhinitis by physicians...The international survey on the management of allergic rhinitis by physicians...
The international survey on the management of allergic rhinitis by physicians...
 
Medication Adherence in the Real World
Medication Adherence in the Real WorldMedication Adherence in the Real World
Medication Adherence in the Real World
 
Quality use medicine
Quality use medicineQuality use medicine
Quality use medicine
 
profile of adverse drug reactions in a rural tertiary care hospital
profile of adverse drug reactions in a rural tertiary care hospital profile of adverse drug reactions in a rural tertiary care hospital
profile of adverse drug reactions in a rural tertiary care hospital
 
PolyPharmacy Prevention in Older Populations
PolyPharmacy Prevention in Older Populations PolyPharmacy Prevention in Older Populations
PolyPharmacy Prevention in Older Populations
 
Adherence to-selfcare-behaviours-and-knowledge-on-treatment-amongheart-failur...
Adherence to-selfcare-behaviours-and-knowledge-on-treatment-amongheart-failur...Adherence to-selfcare-behaviours-and-knowledge-on-treatment-amongheart-failur...
Adherence to-selfcare-behaviours-and-knowledge-on-treatment-amongheart-failur...
 

En vedette (20)

El arte de no enfermarse
El arte de no enfermarseEl arte de no enfermarse
El arte de no enfermarse
 
97 2011
97 201197 2011
97 2011
 
Sonia
SoniaSonia
Sonia
 
Sistema operativo
Sistema operativoSistema operativo
Sistema operativo
 
inteligencias multiples
inteligencias multiplesinteligencias multiples
inteligencias multiples
 
Redes
RedesRedes
Redes
 
Ejemplo de alberto
Ejemplo de albertoEjemplo de alberto
Ejemplo de alberto
 
Tutorialparacinemagraph
TutorialparacinemagraphTutorialparacinemagraph
Tutorialparacinemagraph
 
Vehículo todoterreno
Vehículo todoterrenoVehículo todoterreno
Vehículo todoterreno
 
URL's de Ayuda!!
URL's de Ayuda!! URL's de Ayuda!!
URL's de Ayuda!!
 
Certs
CertsCerts
Certs
 
Tubular
TubularTubular
Tubular
 
Cecytem jocotitlán
Cecytem jocotitlánCecytem jocotitlán
Cecytem jocotitlán
 
Ejemplo miguel de cervantes
Ejemplo miguel de cervantesEjemplo miguel de cervantes
Ejemplo miguel de cervantes
 
Presentación1
Presentación1Presentación1
Presentación1
 
El metodo de proyectos
El metodo de proyectosEl metodo de proyectos
El metodo de proyectos
 
Decoraciones[1]
Decoraciones[1]Decoraciones[1]
Decoraciones[1]
 
LOS ANIMALES V
LOS ANIMALES VLOS ANIMALES V
LOS ANIMALES V
 
Hardware y software
Hardware y softwareHardware y software
Hardware y software
 
Certificate bypass: Hiding and executing malware from a digitally signed exec...
Certificate bypass: Hiding and executing malware from a digitally signed exec...Certificate bypass: Hiding and executing malware from a digitally signed exec...
Certificate bypass: Hiding and executing malware from a digitally signed exec...
 

Similaire à Physician Dispensing

Rebecca Ruggear Senior Thesis 2013
Rebecca Ruggear Senior Thesis 2013Rebecca Ruggear Senior Thesis 2013
Rebecca Ruggear Senior Thesis 2013Rebecca Ruggear
 
Clinical Pharmacists in Chronic Care
Clinical Pharmacists in Chronic CareClinical Pharmacists in Chronic Care
Clinical Pharmacists in Chronic Caresubmissionclinmedima
 
Cost burdenofchronic pain
Cost burdenofchronic painCost burdenofchronic pain
Cost burdenofchronic painPaul Coelho, MD
 
Cost burden of chronic pain
Cost burden of chronic painCost burden of chronic pain
Cost burden of chronic painPaul Coelho, MD
 
Measuring to Improve Medication Reconciliationin a Large Sub.docx
Measuring to Improve Medication Reconciliationin a Large Sub.docxMeasuring to Improve Medication Reconciliationin a Large Sub.docx
Measuring to Improve Medication Reconciliationin a Large Sub.docxalfredacavx97
 
Healthcare spending 1996 2013
Healthcare spending 1996 2013Healthcare spending 1996 2013
Healthcare spending 1996 2013Paul Coelho, MD
 
High Intensity Prescribers in the ED
High Intensity Prescribers in the EDHigh Intensity Prescribers in the ED
High Intensity Prescribers in the EDPaul Coelho, MD
 
Study of medication appropriateness during hospital stay and revisits in medi...
Study of medication appropriateness during hospital stay and revisits in medi...Study of medication appropriateness during hospital stay and revisits in medi...
Study of medication appropriateness during hospital stay and revisits in medi...iosrjce
 
IMPACT STUDY_12NOV2015
IMPACT STUDY_12NOV2015IMPACT STUDY_12NOV2015
IMPACT STUDY_12NOV2015Kim Kersten
 
Medication Adherence in the Real World
Medication Adherence in the Real WorldMedication Adherence in the Real World
Medication Adherence in the Real WorldCognizant
 
More Predictive Modeling of Total Healthcare Costs Using Pharmacy Claims Data
More Predictive Modeling of Total Healthcare Costs Using Pharmacy Claims DataMore Predictive Modeling of Total Healthcare Costs Using Pharmacy Claims Data
More Predictive Modeling of Total Healthcare Costs Using Pharmacy Claims DataM. Christopher Roebuck
 
Utilising the 7-step Polypharmacy Tool to Guide a Multi-Disciplinary Team Mee...
Utilising the 7-step Polypharmacy Tool to Guide a Multi-Disciplinary Team Mee...Utilising the 7-step Polypharmacy Tool to Guide a Multi-Disciplinary Team Mee...
Utilising the 7-step Polypharmacy Tool to Guide a Multi-Disciplinary Team Mee...Health Innovation Wessex
 
6e683e2f35c71f7f897b420db582aaf9a866.pdf
6e683e2f35c71f7f897b420db582aaf9a866.pdf6e683e2f35c71f7f897b420db582aaf9a866.pdf
6e683e2f35c71f7f897b420db582aaf9a866.pdfSestyRachmawati
 
Improving Medication Adherence among Type II Home Healthcare D
Improving Medication Adherence among Type II Home Healthcare DImproving Medication Adherence among Type II Home Healthcare D
Improving Medication Adherence among Type II Home Healthcare DMalikPinckney86
 
Post-Market Research to Create Treatment Guidelines Oriented to Patient Cente...
Post-Market Research to Create Treatment Guidelines Oriented to Patient Cente...Post-Market Research to Create Treatment Guidelines Oriented to Patient Cente...
Post-Market Research to Create Treatment Guidelines Oriented to Patient Cente...David Selkirk
 
Pharmaceutical care concepts - clinical pharmacy
Pharmaceutical care concepts - clinical pharmacy Pharmaceutical care concepts - clinical pharmacy
Pharmaceutical care concepts - clinical pharmacy ShaistaSumayya
 

Similaire à Physician Dispensing (20)

Rebecca Ruggear Senior Thesis 2013
Rebecca Ruggear Senior Thesis 2013Rebecca Ruggear Senior Thesis 2013
Rebecca Ruggear Senior Thesis 2013
 
Clinical Pharmacists in Chronic Care
Clinical Pharmacists in Chronic CareClinical Pharmacists in Chronic Care
Clinical Pharmacists in Chronic Care
 
Cost burdenofchronic pain
Cost burdenofchronic painCost burdenofchronic pain
Cost burdenofchronic pain
 
Cost burden of chronic pain
Cost burden of chronic painCost burden of chronic pain
Cost burden of chronic pain
 
Measuring to Improve Medication Reconciliationin a Large Sub.docx
Measuring to Improve Medication Reconciliationin a Large Sub.docxMeasuring to Improve Medication Reconciliationin a Large Sub.docx
Measuring to Improve Medication Reconciliationin a Large Sub.docx
 
Healthcare spending 1996 2013
Healthcare spending 1996 2013Healthcare spending 1996 2013
Healthcare spending 1996 2013
 
High Intensity Prescribers in the ED
High Intensity Prescribers in the EDHigh Intensity Prescribers in the ED
High Intensity Prescribers in the ED
 
Study of medication appropriateness during hospital stay and revisits in medi...
Study of medication appropriateness during hospital stay and revisits in medi...Study of medication appropriateness during hospital stay and revisits in medi...
Study of medication appropriateness during hospital stay and revisits in medi...
 
New study supports notion of skewed opioid prescribing
New study supports notion of skewed opioid prescribingNew study supports notion of skewed opioid prescribing
New study supports notion of skewed opioid prescribing
 
IMPACT STUDY_12NOV2015
IMPACT STUDY_12NOV2015IMPACT STUDY_12NOV2015
IMPACT STUDY_12NOV2015
 
ckd jnl-1.pptx
ckd jnl-1.pptxckd jnl-1.pptx
ckd jnl-1.pptx
 
Medication Adherence in the Real World
Medication Adherence in the Real WorldMedication Adherence in the Real World
Medication Adherence in the Real World
 
High Dose Initiation
High Dose InitiationHigh Dose Initiation
High Dose Initiation
 
More Predictive Modeling of Total Healthcare Costs Using Pharmacy Claims Data
More Predictive Modeling of Total Healthcare Costs Using Pharmacy Claims DataMore Predictive Modeling of Total Healthcare Costs Using Pharmacy Claims Data
More Predictive Modeling of Total Healthcare Costs Using Pharmacy Claims Data
 
Utilising the 7-step Polypharmacy Tool to Guide a Multi-Disciplinary Team Mee...
Utilising the 7-step Polypharmacy Tool to Guide a Multi-Disciplinary Team Mee...Utilising the 7-step Polypharmacy Tool to Guide a Multi-Disciplinary Team Mee...
Utilising the 7-step Polypharmacy Tool to Guide a Multi-Disciplinary Team Mee...
 
6e683e2f35c71f7f897b420db582aaf9a866.pdf
6e683e2f35c71f7f897b420db582aaf9a866.pdf6e683e2f35c71f7f897b420db582aaf9a866.pdf
6e683e2f35c71f7f897b420db582aaf9a866.pdf
 
Improving Medication Adherence among Type II Home Healthcare D
Improving Medication Adherence among Type II Home Healthcare DImproving Medication Adherence among Type II Home Healthcare D
Improving Medication Adherence among Type II Home Healthcare D
 
Post-Market Research to Create Treatment Guidelines Oriented to Patient Cente...
Post-Market Research to Create Treatment Guidelines Oriented to Patient Cente...Post-Market Research to Create Treatment Guidelines Oriented to Patient Cente...
Post-Market Research to Create Treatment Guidelines Oriented to Patient Cente...
 
Pharmaceutical care concepts - clinical pharmacy
Pharmaceutical care concepts - clinical pharmacy Pharmaceutical care concepts - clinical pharmacy
Pharmaceutical care concepts - clinical pharmacy
 
Emergency med pharmacist 2017 coralic a. et al
Emergency med pharmacist 2017 coralic a. et alEmergency med pharmacist 2017 coralic a. et al
Emergency med pharmacist 2017 coralic a. et al
 

Dernier

7.pdf This presentation captures many uses and the significance of the number...
7.pdf This presentation captures many uses and the significance of the number...7.pdf This presentation captures many uses and the significance of the number...
7.pdf This presentation captures many uses and the significance of the number...Paul Menig
 
A DAY IN THE LIFE OF A SALESMAN / WOMAN
A DAY IN THE LIFE OF A  SALESMAN / WOMANA DAY IN THE LIFE OF A  SALESMAN / WOMAN
A DAY IN THE LIFE OF A SALESMAN / WOMANIlamathiKannappan
 
M.C Lodges -- Guest House in Jhang.
M.C Lodges --  Guest House in Jhang.M.C Lodges --  Guest House in Jhang.
M.C Lodges -- Guest House in Jhang.Aaiza Hassan
 
It will be International Nurses' Day on 12 May
It will be International Nurses' Day on 12 MayIt will be International Nurses' Day on 12 May
It will be International Nurses' Day on 12 MayNZSG
 
FULL ENJOY Call Girls In Majnu Ka Tilla, Delhi Contact Us 8377877756
FULL ENJOY Call Girls In Majnu Ka Tilla, Delhi Contact Us 8377877756FULL ENJOY Call Girls In Majnu Ka Tilla, Delhi Contact Us 8377877756
FULL ENJOY Call Girls In Majnu Ka Tilla, Delhi Contact Us 8377877756dollysharma2066
 
Call Girls Jp Nagar Just Call 👗 7737669865 👗 Top Class Call Girl Service Bang...
Call Girls Jp Nagar Just Call 👗 7737669865 👗 Top Class Call Girl Service Bang...Call Girls Jp Nagar Just Call 👗 7737669865 👗 Top Class Call Girl Service Bang...
Call Girls Jp Nagar Just Call 👗 7737669865 👗 Top Class Call Girl Service Bang...amitlee9823
 
The Coffee Bean & Tea Leaf(CBTL), Business strategy case study
The Coffee Bean & Tea Leaf(CBTL), Business strategy case studyThe Coffee Bean & Tea Leaf(CBTL), Business strategy case study
The Coffee Bean & Tea Leaf(CBTL), Business strategy case studyEthan lee
 
Call Girls In DLf Gurgaon ➥99902@11544 ( Best price)100% Genuine Escort In 24...
Call Girls In DLf Gurgaon ➥99902@11544 ( Best price)100% Genuine Escort In 24...Call Girls In DLf Gurgaon ➥99902@11544 ( Best price)100% Genuine Escort In 24...
Call Girls In DLf Gurgaon ➥99902@11544 ( Best price)100% Genuine Escort In 24...lizamodels9
 
John Halpern sued for sexual assault.pdf
John Halpern sued for sexual assault.pdfJohn Halpern sued for sexual assault.pdf
John Halpern sued for sexual assault.pdfAmzadHosen3
 
Insurers' journeys to build a mastery in the IoT usage
Insurers' journeys to build a mastery in the IoT usageInsurers' journeys to build a mastery in the IoT usage
Insurers' journeys to build a mastery in the IoT usageMatteo Carbone
 
Boost the utilization of your HCL environment by reevaluating use cases and f...
Boost the utilization of your HCL environment by reevaluating use cases and f...Boost the utilization of your HCL environment by reevaluating use cases and f...
Boost the utilization of your HCL environment by reevaluating use cases and f...Roland Driesen
 
Organizational Transformation Lead with Culture
Organizational Transformation Lead with CultureOrganizational Transformation Lead with Culture
Organizational Transformation Lead with CultureSeta Wicaksana
 
Monthly Social Media Update April 2024 pptx.pptx
Monthly Social Media Update April 2024 pptx.pptxMonthly Social Media Update April 2024 pptx.pptx
Monthly Social Media Update April 2024 pptx.pptxAndy Lambert
 
0183760ssssssssssssssssssssssssssss00101011 (27).pdf
0183760ssssssssssssssssssssssssssss00101011 (27).pdf0183760ssssssssssssssssssssssssssss00101011 (27).pdf
0183760ssssssssssssssssssssssssssss00101011 (27).pdfRenandantas16
 
Famous Olympic Siblings from the 21st Century
Famous Olympic Siblings from the 21st CenturyFamous Olympic Siblings from the 21st Century
Famous Olympic Siblings from the 21st Centuryrwgiffor
 
Call Girls Pune Just Call 9907093804 Top Class Call Girl Service Available
Call Girls Pune Just Call 9907093804 Top Class Call Girl Service AvailableCall Girls Pune Just Call 9907093804 Top Class Call Girl Service Available
Call Girls Pune Just Call 9907093804 Top Class Call Girl Service AvailableDipal Arora
 
Yaroslav Rozhankivskyy: Три складові і три передумови максимальної продуктивн...
Yaroslav Rozhankivskyy: Три складові і три передумови максимальної продуктивн...Yaroslav Rozhankivskyy: Три складові і три передумови максимальної продуктивн...
Yaroslav Rozhankivskyy: Три складові і три передумови максимальної продуктивн...Lviv Startup Club
 
Cracking the Cultural Competence Code.pptx
Cracking the Cultural Competence Code.pptxCracking the Cultural Competence Code.pptx
Cracking the Cultural Competence Code.pptxWorkforce Group
 
How to Get Started in Social Media for Art League City
How to Get Started in Social Media for Art League CityHow to Get Started in Social Media for Art League City
How to Get Started in Social Media for Art League CityEric T. Tung
 
Mysore Call Girls 8617370543 WhatsApp Number 24x7 Best Services
Mysore Call Girls 8617370543 WhatsApp Number 24x7 Best ServicesMysore Call Girls 8617370543 WhatsApp Number 24x7 Best Services
Mysore Call Girls 8617370543 WhatsApp Number 24x7 Best ServicesDipal Arora
 

Dernier (20)

7.pdf This presentation captures many uses and the significance of the number...
7.pdf This presentation captures many uses and the significance of the number...7.pdf This presentation captures many uses and the significance of the number...
7.pdf This presentation captures many uses and the significance of the number...
 
A DAY IN THE LIFE OF A SALESMAN / WOMAN
A DAY IN THE LIFE OF A  SALESMAN / WOMANA DAY IN THE LIFE OF A  SALESMAN / WOMAN
A DAY IN THE LIFE OF A SALESMAN / WOMAN
 
M.C Lodges -- Guest House in Jhang.
M.C Lodges --  Guest House in Jhang.M.C Lodges --  Guest House in Jhang.
M.C Lodges -- Guest House in Jhang.
 
It will be International Nurses' Day on 12 May
It will be International Nurses' Day on 12 MayIt will be International Nurses' Day on 12 May
It will be International Nurses' Day on 12 May
 
FULL ENJOY Call Girls In Majnu Ka Tilla, Delhi Contact Us 8377877756
FULL ENJOY Call Girls In Majnu Ka Tilla, Delhi Contact Us 8377877756FULL ENJOY Call Girls In Majnu Ka Tilla, Delhi Contact Us 8377877756
FULL ENJOY Call Girls In Majnu Ka Tilla, Delhi Contact Us 8377877756
 
Call Girls Jp Nagar Just Call 👗 7737669865 👗 Top Class Call Girl Service Bang...
Call Girls Jp Nagar Just Call 👗 7737669865 👗 Top Class Call Girl Service Bang...Call Girls Jp Nagar Just Call 👗 7737669865 👗 Top Class Call Girl Service Bang...
Call Girls Jp Nagar Just Call 👗 7737669865 👗 Top Class Call Girl Service Bang...
 
The Coffee Bean & Tea Leaf(CBTL), Business strategy case study
The Coffee Bean & Tea Leaf(CBTL), Business strategy case studyThe Coffee Bean & Tea Leaf(CBTL), Business strategy case study
The Coffee Bean & Tea Leaf(CBTL), Business strategy case study
 
Call Girls In DLf Gurgaon ➥99902@11544 ( Best price)100% Genuine Escort In 24...
Call Girls In DLf Gurgaon ➥99902@11544 ( Best price)100% Genuine Escort In 24...Call Girls In DLf Gurgaon ➥99902@11544 ( Best price)100% Genuine Escort In 24...
Call Girls In DLf Gurgaon ➥99902@11544 ( Best price)100% Genuine Escort In 24...
 
John Halpern sued for sexual assault.pdf
John Halpern sued for sexual assault.pdfJohn Halpern sued for sexual assault.pdf
John Halpern sued for sexual assault.pdf
 
Insurers' journeys to build a mastery in the IoT usage
Insurers' journeys to build a mastery in the IoT usageInsurers' journeys to build a mastery in the IoT usage
Insurers' journeys to build a mastery in the IoT usage
 
Boost the utilization of your HCL environment by reevaluating use cases and f...
Boost the utilization of your HCL environment by reevaluating use cases and f...Boost the utilization of your HCL environment by reevaluating use cases and f...
Boost the utilization of your HCL environment by reevaluating use cases and f...
 
Organizational Transformation Lead with Culture
Organizational Transformation Lead with CultureOrganizational Transformation Lead with Culture
Organizational Transformation Lead with Culture
 
Monthly Social Media Update April 2024 pptx.pptx
Monthly Social Media Update April 2024 pptx.pptxMonthly Social Media Update April 2024 pptx.pptx
Monthly Social Media Update April 2024 pptx.pptx
 
0183760ssssssssssssssssssssssssssss00101011 (27).pdf
0183760ssssssssssssssssssssssssssss00101011 (27).pdf0183760ssssssssssssssssssssssssssss00101011 (27).pdf
0183760ssssssssssssssssssssssssssss00101011 (27).pdf
 
Famous Olympic Siblings from the 21st Century
Famous Olympic Siblings from the 21st CenturyFamous Olympic Siblings from the 21st Century
Famous Olympic Siblings from the 21st Century
 
Call Girls Pune Just Call 9907093804 Top Class Call Girl Service Available
Call Girls Pune Just Call 9907093804 Top Class Call Girl Service AvailableCall Girls Pune Just Call 9907093804 Top Class Call Girl Service Available
Call Girls Pune Just Call 9907093804 Top Class Call Girl Service Available
 
Yaroslav Rozhankivskyy: Три складові і три передумови максимальної продуктивн...
Yaroslav Rozhankivskyy: Три складові і три передумови максимальної продуктивн...Yaroslav Rozhankivskyy: Три складові і три передумови максимальної продуктивн...
Yaroslav Rozhankivskyy: Три складові і три передумови максимальної продуктивн...
 
Cracking the Cultural Competence Code.pptx
Cracking the Cultural Competence Code.pptxCracking the Cultural Competence Code.pptx
Cracking the Cultural Competence Code.pptx
 
How to Get Started in Social Media for Art League City
How to Get Started in Social Media for Art League CityHow to Get Started in Social Media for Art League City
How to Get Started in Social Media for Art League City
 
Mysore Call Girls 8617370543 WhatsApp Number 24x7 Best Services
Mysore Call Girls 8617370543 WhatsApp Number 24x7 Best ServicesMysore Call Girls 8617370543 WhatsApp Number 24x7 Best Services
Mysore Call Girls 8617370543 WhatsApp Number 24x7 Best Services
 

Physician Dispensing

  • 1. ORIGINAL ARTICLE Impact of Medication Adherence on Hospitalization Risk and Healthcare Cost Michael C. Sokol, MD, MS, Kimberly A. McGuigan, PhD, Robert R. Verbrugge, PhD, and Robert S. Epstein, MD, MS Objective: The objective of this study was to evaluate the impact of medication adherence on healthcare utilization and cost for 4 chronic conditions that are major drivers of drug spending: diabetes, hypertension, hypercholesterolemia, and congestive heart failure. Research Design: The authors conducted a retrospective cohort observation of patients who were continuously enrolled in medical and prescription benefit plans from June 1997 through May 1999. Patients were identified for disease-specific analysis based on claims for outpatient, emergency room, or inpatient services during the first 12 months of the study. Using an integrated analysis of administra- tive claims data, medical and drug utilization were measured during the 12-month period after patient identification. Medication adher- ence was defined by days’ supply of maintenance medications for each condition. Patients: The study consisted of a population-based sample of 137,277 patients under age 65. Measures: Disease-related and all-cause medical costs, drug costs, and hospitalization risk were measured. Using regression analysis, these measures were modeled at varying levels of medication ad- herence. Results: For diabetes and hypercholesterolemia, a high level of medication adherence was associated with lower disease-related medical costs. For these conditions, higher medication costs were more than offset by medical cost reductions, producing a net reduction in overall healthcare costs. For diabetes, hypercholester- olemia, and hypertension, cost offsets were observed for all-cause medical costs at high levels of medication adherence. For all 4 conditions, hospitalization rates were significantly lower for patients with high medication adherence. Conclusions: For some chronic conditions, increased drug utiliza- tion can provide a net economic return when it is driven by improved adherence with guidelines-based therapy. Key Words: adherence, drug utilization, healthcare costs, hospitalization, pharmaceutical care (Med Care 2005;43: 521–530) Prescription drug expenditures are the fastest growing component of healthcare costs in the United States.1,2 National outpatient drug spending has increased by 13% to 16% per year during the past few years,2 and it is expected to continue to grow by 9% to 13% per year during the coming decade.2 Much of the growth in drug spending is the result of increased use (more drugs prescribed for more people for more indications); this accounts for more than 50% of the growth in drug spending for many common conditions, in- cluding diabetes and hypercholesterolemia.1,3 In an effort to manage this growth, health plan sponsors and plan managers have responded with a variety of programs aimed at contain- ing utilization and cost. Some patients in prescription benefit plans have experienced higher copayments and tighter utili- zation controls, and physicians have been under increasing pressure to factor drug costs and coverage limits into their treatment decisions. All of the participants in the healthcare system face a common dilemma: are the benefits of prescrip- tion drugs worth the increased cost? For many medical conditions, there is strong evidence that prescription drugs provide clinical value. Based on that evidence, pharmacotherapy has become an integral compo- nent of the treatment guidelines for many high-prevalence diseases, including diabetes,4 hypertension,5 hypercholester- olemia,6 and congestive heart failure (CHF).7 The more difficult question is whether prescription drugs provide net economic value to those who pay for health care. Does drug treatment reduce overall healthcare costs by reducing pa- tients’ need for expensive medical services such as hospital- ization and emergency room (ER) treatment? Results of this kind have been demonstrated for several medical condi- From the Department of Medical Affairs, Medco Health Solutions, Inc., Franklin Lakes, New Jersey. Dr. Sokol and Dr. McGuigan were full-time employees of Medco Health Solutions, Inc., when the research was conducted and both have since taken employment outside the company. This research was designed and conducted by the authors as part of their employment with Medco Health Solutions, Inc. The manuscript was reviewed through an internal publications review process to ensure data integrity and editorial quality. The research was not funded by, or subject to the review of, any outside company or organization. Reprints: Robert R. Verbrugge, PhD, Department of Medical Affairs, Medco Health Solutions, Inc., 100 Parsons Pond Drive, Franklin Lakes, NJ 07417. E-mail: robert_verbrugge@medco.com. Copyright © 2005 by Lippincott Williams & Wilkins ISSN: 0025-7079/05/4306-0521 Medical Care • Volume 43, Number 6, June 2005 521
  • 2. tions.8–13 For example, lipid-lowering drugs are generally cost-effective in secondary prevention of heart disease; by reducing the risk of cardiovascular events, they can produce a net return on investment.10 This type of cost offset is a welcome benefit, but it may not be found for all high- prevalence conditions for which drug therapy is recom- mended. Some drug treatments may show a medical cost offset (in the short term or long term), and some may not show an offset at all.14 The therapeutic and economic benefits of drug treat- ment are often demonstrated in the controlled settings of clinical trials. These benefits may not be realized in day-to- day practice, especially for patients who are only partially compliant with their prescribed therapy. Adherence with me- dication therapy is generally low—approximately 50% to 65%, on average, for common chronic conditions such as hypertension and diabetes.15,16 When conditions are treated suboptimally, symptoms and complications may worsen, leading to increased use of hospital and ER services, office visits, and other medical resources.16,17 This suggests that higher levels of medication adherence may have positive economic value for some chronic conditions. Increased ad- herence may generate medical savings that more than offset the associated increases in drug costs. For some chronic conditions, there is evidence to support this hypothesis.14,18–23 There has been relatively little research assessing the cost impact of medication adherence for treatments provided under benefit plans in population-based settings. Some stud- ies have assessed how healthcare costs are affected when patients reduce their drug use in response to coverage limits or copayment requirements. In a study of coverage limits in a Medicaid population, there was a net increase in total healthcare costs when patients were limited to a maximum of 3 prescriptions per month; many patients cut back on medi- cations for chronic conditions (such as diabetes and CHF), and their use of medical services increased.24,25 Medical utilization may also increase when patients cut back on drug use in response to copayment requirements.26–29 These stud- ies suggest that if patients’ adherence levels drop as a result of benefit plan changes, medical utilization for some condi- tions may increase, and the increased medical costs may exceed the savings in drug costs.14 In this observational study, we evaluate the relation- ships among medication adherence, medical utilization, and healthcare cost in a large population of patients with com- bined benefit eligibility for prescription drugs and medical services. Drug cost, medical cost, and utilization are mea- sured using pharmacy claims data and medical claims data, integrated at the patient level. After adjusting for age, comor- bidity, and other factors, we estimate healthcare cost and hospitalization risk as a function of medication adherence. The analysis covers 4 high-prevalence conditions for which prescription drugs play a key role: diabetes, hypertension, hypercholesterolemia, and CHF. These conditions are gener- ally chronic in presentation and often require long-term medication therapy. METHODS Study Population Patients were participants in medical and drug benefit plans sponsored by a large manufacturing employer. Patients were initially identified for the study population if they had continuous medical and drug benefit eligibility during the period of the study, June 1997 through May 1999. Medi- cal plan types included a health maintenance organization (HMO), a preferred provider organization (PPO), and a tra- ditional fee-for-service (FFS) plan; participants in a small, capitated managed care plan were excluded because full medical cost data were not available at the patient level. Patients aged 65 and older (n ϭ 73,997) were excluded because medical claims data were not available for their primary benefit plan (Medicare). A total of 137,277 patients (employees and dependents) met the inclusion criteria for the final study population. Age in the study population was distrib- uted as follows: 0–18 (20.0%), 19–39 (16.0%), and 40–64 (64.0%). The population was 48.9% female and 51.1% male. Medical data for the study population were drawn from an administrative claims database maintained by a health plan organization for all medical plan types. Drug utilization data were drawn from a prescription claims database maintained by Medco Health, the pharmacy benefits management com- pany that manages the prescription benefit plan for this population. Sample Selection Separate study samples were drawn from the study population for purposes of analysis. A study sample was identified for each of the 4 conditions under study: diabetes, hypertension, hypercholesterolemia, and CHF. Patients were identified for a study sample if they used medical services for the condition and if they received prescription drugs for the condition. Patients were included in multiple study samples if they met the inclusion criteria for more than 1 of the medical conditions under study. Specific inclusion criteria were as follows. Medical Claims Patients were initially identified for a study sample if they received medical services for the condition during the first 12 months of the study period. To minimize false- positives, patients were identified for a study sample if they had 2 or more medical claims for outpatient services on different dates during the year, or if they had 1 or more claims for hospitalization or ER service during the year; outpatient services included physician office visits and outpatient de- Sokol et al Medical Care • Volume 43, Number 6, June 2005 © 2005 Lippincott Williams & Wilkins522
  • 3. partment visits. For each medical condition under study, medical services were identified using primary and secondary International Classification of Diseases, 9th Revision (ICD-9) codes30 in patients’ claim records (Appendix). Drug Claims Patients were included in the final study sample if they received 1 or more prescriptions for the target condition during the 12 months after their first medical index claim (the first of 2 or more dates of outpatient service for the target condition, or the first of 1 or more dates of inpatient or ER service). The study did not include patients who were diag- nosed with a condition but who were not using medications to treat it. Data Collection Utilization Data Medical and drug claims were tracked concurrently during a 12-month analysis period for the patients in each study sample. For each patient, the analysis period began on the date of the first index claim, as defined previously. Sociodemographic Data Data on age, sex, employment group, and medical plan type were drawn from an eligibility database maintained by the health plan organization. Employment group was hourly or salaried (benefit plans differed for these 2 groups). Medical plan type was HMO, PPO, or FFS. Adherence Medication adherence was measured by patients’ over- all exposure to medications used to treat a given condition. Adherence was defined as the percentage of days during the analysis period that patients had a supply of 1 or more maintenance medications for the condition (based on “days’ supply” data in patients’ prescription claim records). This measurement strategy reduces the risk of overestimating adherence (eg, in cases in which patients have overlapping prescriptions as a result of a change in therapy). For prescrip- tions extending beyond the end of the analysis period, days’ supply was truncated at the end of the period. Patients in each study sample were stratified into 5 categories based on their adherence score: 1–19%, 20–39%, 40–59%, 60–79%, or 80–100%. Comorbidity Two comorbidity scores were derived for the patients in each study sample. The Charlson score was based on ICD-9 codes in patients’ medical claims during the analysis period; it was computed using a Deyo-adapted Charlson scale.31 A chronic disease index (CDI) was computed from patients’ prescription claims during the analysis period. The CDI is a composite measure of drug use across a broad range of chronic conditions; a related index has been validated in previous studies.32,33 For each analysis, the CDI score ex- cluded the target medications for the condition under study; this precluded any confounding with the primary predictor of interest (medication adherence). The 2 comorbidity scores differ in their data source (medical vs. drug claims) and in the medical conditions they assess. The measures are positively correlated but not colinear. Significant positive correlations were observed for all 4 study samples (r ϭ 0.40, diabetes; 0.42, hypertension; 0.38, hypercholesterolemia; 0.38, CHF; P Ͻ 0.0001). Disease Subtype For each target condition, specific ICD-9 codes were used as indicators of disease subtype. If any medical claim during the follow-up period contained 1 of these codes, the indicator was scored “1” for that patient; otherwise, it was scored “0”. Scores were derived independently for each indicator. Outcome Measures The primary economic measures were total medical costs and prescription drug costs during the 12-month anal- ysis period. Total healthcare costs were defined as the sum of medical costs and drug costs. Medical costs included outpa- tient services, ER services, and hospitalization; nursing home and home care services were not included. Drug costs in- cluded all ambulatory prescriptions (dispensed by outpatient, community-based, or mail-service pharmacies). Cost was defined as net cost to the plan sponsor; patient copayments and deductibles were not included. Two types of cost were measured from the claims data: all-cause costs and disease-related costs. All-cause costs were medical or drug costs associated with any condition during the 12-month period. Disease-related costs were costs asso- ciated with treatment of the target condition; they were a subset of all-cause costs. For medical services, disease-re- lated costs were identified by primary and secondary ICD-9 codes in medical claims data (Appendix). For hypertension and hypercholesterolemia, disease-related medical costs were identified by a broader set of cardiovascular codes that in- cluded common sequelae of the target condition (such as myocardial infarction or stroke). In many settings, these acute sequelae are more likely to be used for diagnostic coding, especially in cases of hospitalization or ER treatment. If claims analysis is restricted to diagnostic codes for the un- derlying condition (such as hypercholesterolemia), medical utilization and cost can be seriously underestimated. For drugs, disease-related costs were identified by drug classes in prescription claims data (Appendix). The primary measure of medical utilization was hospi- talization risk. This was defined as the probability of 1 or more hospitalizations during a 12-month period, expressed as Medical Care • Volume 43, Number 6, June 2005 Impact of Medication Adherence © 2005 Lippincott Williams & Wilkins 523
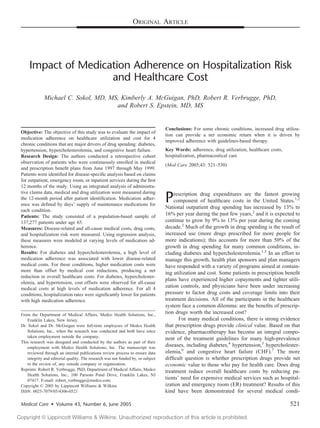
  • 4. a percentage. Observed probability values were derived from medical claims data during the analysis period. Data Analysis We used multiple linear regression to evaluate the association between medication adherence and healthcare costs for each target condition. Cost estimates were adjusted for age, sex, comorbidity, disease subtype, employment group, and medical plan type. The following primary covari- ates were used in the regression model: age, sex, Charlson score, CDI score, employment group, PPO participation, HMO participation, and the ICD-9-based subtype indicators for the target condition. To adjust for possible nonlinearities in functional form, 3 interaction terms were used: age*age, age*sex, and CDI-score*sex. For each study sample, separate analyses were conducted for each category of cost (disease- related medical, disease-related drug, all-cause medical, and all-cause drug). We used a logistic regression model to estimate the relationship between medication adherence and hospitaliza- tion risk for each target condition, adjusting for the same covariates as in the cost models described previously. For each condition, we estimated hospitalization risk as a func- tion of adherence level. Statistical Analysis Overall fit of the regression models was tested using F-value and adjusted r-square (cost models) and Wald ␹2 (hospitalization models). Differences between adherence lev- els were evaluated for the 2 primary outcome measures: medical cost and hospitalization risk. The statistical signifi- cance of these differences was tested using 2-tailed t tests (medical cost) and ␹2 tests (hospitalization risk). The out- come for the highest adherence level (80–100%) was used as the reference for each pairwise comparison. Correlations among measures were evaluated using Pearson product mo- ment correlation coefficients. RESULTS Patient Characteristics The characteristics of patients in each study sample are shown in Table 1. Disease-Related Measures Estimated disease-related outcomes are shown in Table 2 for each target condition and adherence level. These esti- mates represent relative levels of cost and utilization after adjustment for all covariates. Disease-Related Costs For diabetes and hypercholesterolemia, high levels of medication adherence were associated with lower disease- related medical costs. These differences were statistically significant for most adherence levels when compared with the highest level of adherence (P Ͻ 0.05). For both of these conditions, total healthcare costs tended to decrease at high levels of medication adherence, despite the increased drug costs. For diabetes, disease-related healthcare costs decreased monotonically as a function of exposure to diabetes medica- tions (Fig. 1). For hypercholesterolemia, healthcare costs were generally lowest for patients with 80% to 100% adher- ence, although the results were more variable than for diabe- tes. Medical costs for hypertension tended to be lowest at 80% to 100% adherence, but the differences were generally not significant. Differences for CHF were not significant. Hospitalization Risk For all 4 conditions, patients who maintained 80% to 100% medication adherence were significantly less likely to be hospitalized compared with patients with lower levels of adherence. These differences were statistically significant for most of the adherence levels tested (P Ͻ 0.05). For diabetes, there was a monotonic decrease in hospitalization risk as adherence to drug treatment increased (Fig. 1). TABLE 1. Characteristics of Study Samples Condition Sample Size (n) Mean Age (SD) Percent Female Mean Comorbidity Scores (SD) Plan Type Percent SalariedCharlson CDI Percent PPO Percent HMO Diabetes 3260 53.9 (9.1) 45.4 4.4 (3.4) 0.6 (0.9) 10.0 11.0 32.3 Hypertension 7981 54.2 (7.7) 46.7 3.4 (2.9) 0.7 (1.0) 9.7 12.0 37.7 Hypercholesterolemia 2981 54.5 (7.5) 44.3 3.2 (2.9) 0.6 (0.9) 9.3 12.9 54.3 CHF 863 55.7 (7.9) 45.3 4.7 (3.1) 1.4 (1.2) 8.7 10.7 17.2 SD indicates standard deviation; CDI, chronic disease index; PPO, preferred provider organization; HMO, health maintenance organization; CHF, congestive heart failure. Sokol et al Medical Care • Volume 43, Number 6, June 2005 © 2005 Lippincott Williams & Wilkins524
  • 5. All-Cause Measures Estimated all-cause outcomes are shown in Table 3 for each target condition and adherence level. All-Cause Costs For diabetes, hypertension, and hypercholesterol- emia, high levels of adherence with condition-specific drugs were associated with lower medical costs across all of the patients’ treated conditions. These differences were statistically significant for most adherence levels (P Ͻ 0.05). For all 3 conditions, total healthcare costs tended to decrease at high levels of drug adherence, despite the increased drug costs. For diabetes, all-cause healthcare costs decreased monotonically with exposure to diabetes medications. Similar, although less uniform, patterns were observed for hypertension (Fig. 2) and hypercholesterol- emia; healthcare costs were generally lowest for patients with 80% to 100% adherence. Differences for CHF were not significant. Hospitalization Risk For all 4 conditions, all-cause hospitalization rates were lowest for patients who had the highest level of medication adherence. These differences were statistically significant for all adherence levels (P Ͻ 0.05). For diabetes and hypertension, there was a monotonic decrease in hospitalization rates as medication adherence increased (Fig. 2, hypertension). TABLE 2. Disease-Related Healthcare Costs and Hospitalization Risk at Varying Levels of Medication Adherence Condition Adherence Level N Medical Cost ($) Drug Cost ($) Total Cost ($) Hospitalization Risk (%) Diabetes 1–19 182 8812* 55 8867 30* 20–39 259 6959* 165 7124 26* 40–59 419 6237* 285 6522 25* 60–79 599 5887* 404 6291 20* 80–100 1801 3808 763 4570 13 F ‫؍‬ 36.62† F ‫؍‬ 88.57† ␹2 (25 df) ‫؍‬ 543.6† Adj. r2 ‫؍‬ 0.18 Adj. r2 ‫؍‬ 0.36 Hypertension 1–19 350 4847 31 4878 28* 20–39 344 5973* 89 6062 24* 40–59 562 5113 184 5297 24* 60–79 921 4977 285 5262 20 80–100 5804 4383 489 4871 19 F ‫؍‬ 46.44† F ‫؍‬ 171.98† ␹2 (31 df) ‫؍‬ 1256.3† Adj. r2 ‫؍‬ 0.13 Adj. r2 ‫؍‬ 0.37 Hypercholesterolemia 1–19 167 6810* 78 6888 15* 20–39 216 4786* 213 4999 13 40–59 324 3452 373 3825 15* 60–79 520 4938* 603 5541 14* 80–100 1754 3124 801 3924 12 F ‫؍‬ 18.99† F ‫؍‬ 320.08† ␹2 (25 df) ‫؍‬ 474.7† Adj. r2 ‫؍‬ 0.10 Adj. r2 ‫؍‬ 0.65 CHF 1–19 86 9826 15 9841 58 20–39 70 7643 90 7733 63* 40–59 82 11,244 134 11,378 65* 60–79 107 13,766 158 13,924 64* 80–100 518 12,261 437 12,698 57 F ‫؍‬ 5.33† F ‫؍‬ 25.73† ␹2 (24 df) ‫؍‬ 169.7† Adj. r2 ‫؍‬ 0.08 Adj. r2 ‫؍‬ 0.34 *Indicates that the outcome is significantly higher than the outcome for the 80–100% adherence group (P Ͻ 0.05). Differences were tested for medical cost and hospitalization risk. † P Ͻ 0.0001. CHF indicates congestive heart failure. Medical Care • Volume 43, Number 6, June 2005 Impact of Medication Adherence © 2005 Lippincott Williams & Wilkins 525
  • 6. Covariates Cost and hospitalization risk showed significant posi- tive associations with Charlson score and CDI score in most of the models tested (P Ͻ 0.05). Many of the disease subtype indicators also contributed significantly to model fit in these analyses. For most conditions, medical costs and hospitaliza- tion risk were significantly higher for hourly employees (P Ͻ 0.05). Age, sex, medical plan type, and the interaction terms generally had no effect on the outcome measures. CDI scores showed significant positive correlations with adherence (r ϭ 0.15, diabetes; 0.28, hypertension; 0.16, hypercholesterol- emia; 0.19, CHF; P Ͻ 0.0001). Correlations between Charlson scores and adherence were generally weak and nonsignificant (r ϭ 0.00–0.07). DISCUSSION For diabetes and hypercholesterolemia, high levels of medication adherence are generally associated with a net economic benefit in disease-related costs. Higher drug costs are more than offset by reductions in medical costs, yielding a net reduction in overall healthcare costs. This pattern is observed at all adherence levels for diabetes and at most adherence levels for hypercholesterolemia. These results are consistent with earlier studies that have reported linkages between medication adherence and health outcomes for these conditions.21,34–37 For hypertension, medical costs tended to be lowest at high levels of medication adherence, but offsets in total healthcare costs were generally not found. The cost impacts of adherence may be less salient for conditions like hypertension, for which a large fraction of the treated popu- lation has a relatively low risk of near-term complications.14 No significant associations between cost and adherence were observed for CHF. Adherence-related differences in hospital- ization risk were relatively small for these patients, and cost variability in the CHF study sample was exceptionally high. To our knowledge, the current study is the first to demonstrate this pattern of cost offsets for diabetes and hypercholesterolemia in a large benefit plan population. Given the chronic nature of these conditions, it is likely that most patients in these study samples had been receiving medication treatment for an extended period before the anal- ysis period began. The observed savings probably reflect the cumulative effects of adherence levels sustained over several years. Adherence rates in this study were typical of the rates often reported for chronic conditions.15,16,34,38 Observed ad- herence rates (defined as the proportion of patients with 80–100% adherence) ranged between 55% and 73% for the 4 conditions in this study. Although a formal cost–benefit analysis is not possible in an observational study of this type, the return on invest- ment (ROI) can be estimated by comparing costs across adherence ranges (quintiles) in the disease-related analyses. For diabetes, the average incremental drug cost for a 20% increase in drug utilization is $177 and the associated disease- related medical cost reduction is $1251, for a net savings of $1074 per patient (an average ROI of 7.1:1). For cardiovas- cular conditions, the average ROI for a 20% increase in drug utilization is 4.0:1 (hypertension) and 5.1:1 (hypercholester- olemia). The results for diabetes (Fig. 1) suggest that there may be an inverse linear relationship between adherence and cost for some conditions; this should be tested systematically in future research. Medication adherence is associated with net savings in all-cause healthcare costs for diabetes, hypertension, and hypercholesterolemia. For people with diabetes, all-cause medical costs decrease monotonically as adherence with hypoglycemic drugs increases. These savings probably reflect the effects of improved glycemic control on related condi- tions (such as microvascular disease and neuropathy), reduc- ing the need for medical services.39–42 Similarly, for the cardiovascular conditions, the cost offsets at high levels of medication adherence probably reflect the impact of cardio- vascular medications on related conditions; for example, improved control of hypertension can slow the progression of renal disease.5 Adherence-based savings in medical costs appear to be driven primarily by reductions in hospitalization rates at higher levels of medication adherence. For all of the condi- tions studied here, hospitalization rates were lowest for pa- tients who had high levels of adherence. Hospitalization is the largest component of medical costs in these study samples, so it is likely that the changes in hospitalization risk are the FIGURE 1. Diabetes: impact of medication adherence on dis- ease-related healthcare costs and hospitalization risk. Sokol et al Medical Care • Volume 43, Number 6, June 2005 © 2005 Lippincott Williams & Wilkins526
  • 7. primary driver of the cost savings observed at higher levels of adherence. This is consistent with results reported elsewhere on the impact of pharmacotherapy on hospitalization rates.8,12,43,44 This study was observational, so it is not possible to draw definite conclusions about the causal relationships among adherence, utilization, and cost. The cross-sectional nature of the design also poses some interpretive problems, because it yields some heterogeneity in the groups under study; for example, the “low-adherence” groups may include some patients who received short-term therapy or who started drug therapy late in the analysis period. However, given the chronic nature of the conditions under study, it is likely that most patients were continuing medication users (ie, it is likely that their treatment had started before the analysis period began). In cohort-based samples of patients with chronic conditions, most patients are prevalent (not incident) cases. The study can provide a good indication of the typical benefits of medication adherence in continuing patients with chronic disease. The study was not designed to track the time course of treatment of newly diagnosed patients, so it cannot define how quickly after the start of therapy the benefits of adherence begin to accrue. The inclusion criteria for the study samples may limit the generalizability of the findings reported here. To reduce the risk of false-positives, at least 2 disease-specific claims were required when patients were identified based on outpa- tient claims. A single outpatient claim could indicate an office visit for evaluation; 2 claims are more likely to indicate a positive diagnosis. However, this selection methodology may TABLE 3. All-Cause Healthcare Costs and Hospitalization Risk at Varying Levels of Medication Adherence Condition Adherence Level N Medical Cost ($) Drug Cost ($) Total Cost ($) Hospitalization Risk (%) Diabetes 1–19 182 15,186* 1312 16,498 55* 20–39 259 11,200* 1877 13,077 47* 40–59 419 11,008* 1970 12,978 42* 60–79 599 9363* 2121 11,484 39* 80–100 1801 6377 2510 8886 30 F ‫؍‬ 51.33† F ‫؍‬ 51.38† ␹2 (25 df) ‫؍‬ 695.3† Adj. r2 ‫؍‬ 0.24 Adj. r2 ‫؍‬ 0.24 Hypertension 1–19 350 8831* 916 9747 44* 20–39 344 10,286* 952 11,238 39* 40–59 562 8368* 1123 9491 36* 60–79 921 7658 1271 8929 30* 80–100 5804 6570 1817 8386 27 F ‫؍‬ 66.51† F ‫؍‬ 50.94† ␹2 (31 df) ‫؍‬ 1573.2† Adj. r2 ‫؍‬ 0.18 Adj. r2 ‫؍‬ 0.14 Hypercholesterolemia 1–19 167 9849* 1067 10,916 26* 20–39 216 6830* 1152 7982 18* 40–59 324 5509* 1247 6756 20* 60–79 520 6676* 1736 8412 21* 80–100 1754 4780 1972 6752 16 F ‫؍‬ 22.37† F ‫؍‬ 101.14† ␹2 (25 df) ‫؍‬ 500.7† Adj. r2 ‫؍‬ 0.11 Adj. r2 ‫؍‬ 0.37 CHF 1–19 86 22,003 1961 23,964 83* 20–39 70 17,133 2055 19,188 81* 40–59 82 24,103 2208 26,311 85* 60–79 107 26,373 3412 29,785 84* 80–100 518 19,056 3107 22,164 75 F ‫؍‬ 7.69† F ‫؍‬ 11.71† ␹2 (24 df) ‫؍‬ 108.7† Adj. r2 ‫؍‬ 0.12 Adj. r2 ‫؍‬ 0.18 *Indicates that the outcome is significantly higher than the outcome for the 80–100% adherence group (P Ͻ 0.05). Differences were tested for medical cost and hospitalization risk. † P Ͻ 0.0001. CHF indicates congestive heart failure. Medical Care • Volume 43, Number 6, June 2005 Impact of Medication Adherence © 2005 Lippincott Williams & Wilkins 527
  • 8. produce a study sample that is weighted toward patients with more advanced disease or higher comorbidity, because it may exclude some patients who visit their doctors infrequently. A selection effect of this kind is suggested by the relatively high hospitalization rates for patients in these study samples; for example, the average all-cause hospitalization risk for the diabetes sample (35.9%) is higher than the rate reported in a study of primary care patients (21.1%).45 The results of the current study are indicative of the adherence-related effects that may be expected for higher-cost patients with more advanced disease. Cost offsets may not be as prominent for healthier adults. Further research would be required to deter- mine the applicability of the reported findings to other pop- ulations. Each study sample included some patients who had more than 1 of the diseases under study. Including these patients makes the samples more representative, because combinations of these conditions (eg, diabetes and hyperten- sion) are common. Excluding these patients would limit the external validity of the results. However, a consequence of including these patients is that the 4 study samples are not strictly independent. The samples provide 4 intersecting (but not fully independent) views of healthcare utilization in this benefit plan population. There are some inherent risks to the use of medical claims data when measuring utilization and cost. In some cases, ICD-9 codes on medical claims may not accurately or completely reflect the patient’s diagnosis. In the current study, medical chart data were not available to validate the coding on the medical claims. The regression models used multiple covariates to con- trol for the effects of comorbidity on utilization and cost. In most of the models, comorbidity was a significant predictor of utilization and cost. It is possible that unmeasured aspects of comorbidity risk could have biased the reported associa- tions between adherence and cost. For example, if low- adherence patients tend to be sicker, then the costs at low adherence levels would be inflated if comorbidity is not adequately controlled. However, in this study population, there was a positive correlation between adherence and co- morbidity (as measured by CDI scores)—the sicker patients tended to be more adherent. In this case, if comorbidity is not adequately controlled, it is more likely that the costs at high adherence levels will be overestimated. To the degree there is unmeasured comorbidity risk in this study, the models are likely to underestimate the cost reductions associated with high adherence. CONCLUSION Although the therapeutic benefits of pharmacotherapy are well understood, the potential economic returns are often missed in the public debate over rising prescription drug costs. Increased drug utilization can provide a net economic return when it is driven by improved adherence with guide- lines-based therapy. Our results demonstrate that a net return may be obtained for 3 chronic conditions that account for a large share of long-term medication use—diabetes, hyperten- sion, and hypercholesterolemia. Although drug costs are a relatively small fraction of total healthcare costs for these conditions, they have high leverage—a small increase in drug costs (associated with improved adherence) can produce a much larger reduction in medical costs. As more of these medications become available in generic form, their leverage will become even stronger; it will be possible to achieve the same therapeutic value and medical cost offset at a signifi- cantly lower drug cost. Because these benefits derive from improved adherence, greater attention should be devoted to educating patients on the value of their drug therapy and motivating behavior changes that improve adherence. ACKNOWLEDGMENTS The authors thank Boris Fainstein, Joan Haynes, and Rich Mountjoy for their assistance with the design and conduct of the study; Qingshan Qian and Jianying Yao for their assistance with the data analysis; and Lon Castle and Les Paul for their assistance with revision of the manuscript. REFERENCES 1. National Institute for Health Care Management. Prescription Drug Expenditures in 2001: Another Year of Escalating Costs. Washing- FIGURE 2. Hypertension: impact of medication adherence on all-cause healthcare costs and hospitalization risk. Sokol et al Medical Care • Volume 43, Number 6, June 2005 © 2005 Lippincott Williams & Wilkins528
  • 9. ton, DC: National Institute for Health Care Management; May 6, 2002. 2. Centers for Medicare and Medicaid Services (CMS). National health care expenditures projections: 2003–2013. Available at: http://www. cms.hhs.gov/statistics/nhe/projections-2003/proj2003.pdf. Accessed Feb- ruary 12, 2004. 3. Dubois RW, Chawla AJ, Neslusan CA, et al. Explaining drug spending trends: does perception match reality? Health Aff (Millwood). 2000;19: 231–239. 4. American Diabetes Association. Medical Management of Type 2 Diabetes. Alexandria, VA: American Diabetes Association; 1998. 5. National Heart, Lung, and Blood Institute. The Sixth Report of the Joint National Committee on Prevention, Detection, Evaluation, and Treat- ment of High Blood Pressure. Bethesda, MD: National Institutes of Health; 1997. NIH publication 98–4080. 6. National Cholesterol Education Program. Third Report of the National Cholesterol Education Program (NCEP) Expert Panel on Detection, Evaluation, and Treatment of High Blood Cholesterol in Adults (Adult Treatment Panel III): Executive Summary. Bethesda, MD: National Heart, Lung, and Blood Institute; 2001. NIH publication 01–3670. 7. Hunt SA, Baker DW, Chin MH, et al. ACC/AHA Guidelines for the Evaluation and Management of Chronic Heart Failure in the Adult: A Report of the American College of Cardiology/American Heart Associ- ation Task Force on Practice Guidelines (Committee to Revise the 1995 Guidelines for the Evaluation and Management of Heart Failure). Bethesda, MD: American College of Cardiology; 2001. Publication 71–0216. 8. Balkrishnan R, Norwood GJ, Anderson A. Outcomes and cost ben- efits associated with the introduction of inhaled corticosteroid ther- apy in a Medicaid population of asthmatic patients. Clin Ther. 1998;20:567–580. 9. McCombs JS, Nichol MB, Stimmel GL, et al. The cost of antidepressant drug therapy failure: a study of antidepressant use patterns in a Medicaid population. J Clin Psychiatry. 1990;51(suppl):60–69. 10. Gotto AM Jr, Grundy SM. Lowering LDL cholesterol: questions from recent meta-analyses and subset analyses of clinical trial data. Circula- tion. 1999;99:E1–E7. 11. Lichtenberg FR. Do (more and better) drugs keep people out of hospi- tals? Am Econ Rev. 1996;86:384–388. 12. Lichtenberg FR. The Benefits and Costs of Newer Drugs: Evidence from the 1996 Medical Expenditure Panel Survey. Cambridge, MA: National Bureau of Economic Research; 2001. Available at: http://www.nber.org/ papers/w8147. 13. Lichtenberg FR. Benefits and Costs of Newer Drugs: An Update. Cambridge, MA: National Bureau of Economic Research; 2002. Avail- able at: http://www.nber.org/papers/w8996. 14. Kleinke JD. The price of progress: prescription drugs in the health care market. Health Aff (Millwood). 2001;20:43–60. 15. Nichol MB, Venturini F, Sung JCY. A critical evaluation of the meth- odology of the literature on medication compliance. Ann Pharmacother. 1999;33:531–540. 16. Schlenk EA, Burke LE, Rand C. Behavioral strategies to improve medication-taking compliance. In: Burke LE, Ockene IS, eds. Compli- ance in Healthcare and Research. Armonk, NY: Futura Publishing Co; 2001:57–70. 17. Miller NH. Compliance with treatment regimens in chronic asymptom- atic diseases. Am J Med. 1997;102:43–49. 18. Groban MD, Evans RM, Edgren B, et al. Clinical benefits and cost reduction associated with a comprehensive asthma management pro- gramme at a managed care organisation. Dis Manag Health Outcomes. 1998;4:93–100. 19. Thompson D, Hylan TR, McMullen W, et al. Predictors of a medical- offset effect among patients receiving antidepressant therapy. Am J Psychiatry. 1998;155:824–827. 20. McCulloch D. Managing diabetes for improved health and economic outcomes. Am J Manag Care. 2000;6(suppl):S1089–S1095. 21. White TJ, Chang EY, Vanderplas AM. Impact of compliance on health care cost and utilization in patients with diabetes mellitus and cardio- vascular disease ͓Abstract͔. ASHP Midyear Clinical Meeting. 2001;36: PPR-7. IPA Abstract 38–12727. 22. Rizzo JA, Simons WR. Variations in compliance among hypertensive patients by drug class: implications for health care costs. Clin Ther. 1997;19:1446–1457. 23. Balkrishnan R, Christensen DB, Bowton DL. Self-reported health status, prophylactic medication use, and healthcare costs in older adults with asthma. J Am Geriatr Soc. 2002;50:924–929. 24. Soumerai SB, Avorn J, Ross-Degnan D, Gortmaker S. Payment restric- tions for prescription drugs under Medicaid: effects on therapy, cost, and equity. N Engl J Med. 1987;317:550–556. 25. Soumerai SB, Lipton HL. Computer-based drug-utilization review— risk, benefit, or boondoggle? N Engl J Med. 1995;332:1641– 1645. 26. Tamblyn R, Laprise R, Hanley JA, et al. Adverse events associated with prescription drug cost-sharing among poor and elderly persons. JAMA. 2001;285:421–429. 27. Steinwachs DM. Pharmacy benefit plans and prescription drug spending. JAMA. 2002;288:1773–1774. 28. Stuart J, Zacker C. Who bears the burden of Medicaid drug copayment policies? Health Aff (Millwood). 1999;18:201–212. 29. Heisler M, Langa KM, Eby EL, et al. The health effects of restricting prescription medication use because of cost. Med Care. 2004;42:626– 634. 30. International Classification of Diseases, 9th Revision, Clinical Mod- ification (ICD-9-CM). Chicago, IL: American Medical Association; 2003. 31. Deyo RA, Cherkin DC, Ciol MA. Adapting a clinical comorbidity index for use with ICD-9-CM administrative databases. J Clin Epidemiol. 1992;45:613–619. 32. Von Korff M, Wagner EH, Saunders K. A chronic disease score from automated pharmacy data. J Clin Epidemiol. 1992;45:197– 203. 33. Clark DO, Von Korff M, Saunders K, et al. A chronic disease score with empirically derived weights. Med Care. 1995;33:783–795. 34. Cramer JA. A systematic review of adherence with medications for diabetes. Diabetes Care. 2004;27:1218–1224. 35. Morris AD, Boyle DI, McMahon AD, et al. Adherence to insulin treatment, glycaemic control, and ketoacidosis in insulin-dependent diabetes mellitus. Lancet. 1997;350:1505–1510. 36. Tsuyuki RT, Bungard TJ. Poor adherence with hypolipidemic drugs: a lost opportunity. Pharmacotherapy. 2001;21:576–582. 37. Olson KL, Bungard TJ, Tsuyuki RT. Cholesterol risk management: a systematic examination of the gap from evidence to practice. Pharma- cotherapy. 2001;21:807–817. 38. Avorn J, Monette J, Lacour A, et al. Persistence of use of lipid- lowering medications: a cross-national study. JAMA. 1998;279: 1458–1462. 39. The Diabetes Control and Complications Trial Research Group. The effect of intensive treatment of diabetes on the development and pro- gression of long-term complications in insulin-dependent diabetes mel- litus. N Engl J Med. 1993;329:977–986. 40. UK Prospective Diabetes Study Group. Tight blood pressure control and risk of macrovascular and microvascular complications in type 2 diabe- tes (UKPDS 38). BMJ. 1998;317:703–713. 41. Wagner EH, Sandhu N, Newton KM, et al. Effect of improved glycemic control on health care costs and utilization. JAMA. 2001; 285:182–189. 42. Rubin R, Dietrich KA, Hawk AD. Clinical and economic impact of implementing a comprehensive diabetes management program in man- aged care. J Clin Endocrinol Metab. 1998;83:2635–2642. 43. SOLVD Investigators. Effect of enalapril on survival in patients with reduced left-ventricular ejection fractions and congestive heart failure. N Engl J Med. 1991;325:293–302. 44. SOLVD Investigators. Effect of enalapril on mortality and the develop- ment of heart failure in asymptomatic patients with reduced left ven- tricular ejection fractions. N Engl J Med. 1992;327:685–691. 45. Graber AL, Davidson FA, Brown MS, et al. Hospitalization of patients with diabetes. Endocr Pract. 1995;1:399–403. Medical Care • Volume 43, Number 6, June 2005 Impact of Medication Adherence © 2005 Lippincott Williams & Wilkins 529
  • 10. APPENDIX Diagnostic Indicators and Drug Classes Used for Patient Identification and Claims Analysis Condition Patient Identification* Disease Subtype Indicators* Analysis of Medical Cost/Utilization* Drug Classes Diabetes 250.xx, 357.2, 362.0x, 366.41, 648.0 250.1–250.9 250.xx, 357.2, 362.0x, 366.41, 648.0 Insulins Oral hypoglycemics Hypertension 401.xx–405.xx 401.x–405.x 401.xx–405.xx, 272.x, 410.xx–417.xx, 425.x, 428.xx, 429.0–429.3, 433.xx–438.xx, 440.x, 444.xx Angiotensin-converting enzyme (ACE) inhibitors Angiotensin II receptor blockers Alpha blockers, beta blockers Calcium channel blockers Vasodilators Sympatholytic hypotensives Diuretics Hypercholesterolemia 272.x 272.1–272.9 272.x, 401.xx–405.xx, 410.xx–417.xx, 425.x, 428.xx, 429.0–429.3, 433.xx–438.xx, 440.x, 444.xx HMG CoA reductase inhibitors (statins) Fibrates Niacin preparations Bile salt sequestrants CHF 398.91, 402.01, 402.11, 402.91, 404.01, 404.03, 404.11, 404.13, 404.91, 404.93, 428.xx 402.x, 404.x, 428.0, 428.1, 428.9 398.91, 402.01, 402.11, 402.91, 404.01, 404.03, 404.11, 404.13, 404.91, 404.93, 428.xx ACE inhibitors Diuretics Digitalis glycosides Carvedilol *ICD-9 codes (International Classification of Diseases—9th Revision).30 Where indicated, “x” takes any valid value. Sokol et al Medical Care • Volume 43, Number 6, June 2005 © 2005 Lippincott Williams & Wilkins530