Uae mantzorou grey
•Télécharger en tant que PPTX, PDF•
0 j'aime•377 vues

How do non-native shrimp species ‘fit’ into the Thames food web - Poster for the British Hydrological Society meeting on Urban Aquatic Ecosystems

Recommandé
Contenu connexe
En vedette
Plus de Lancaster University
Plus de Lancaster University (20)
Uae mantzorou grey
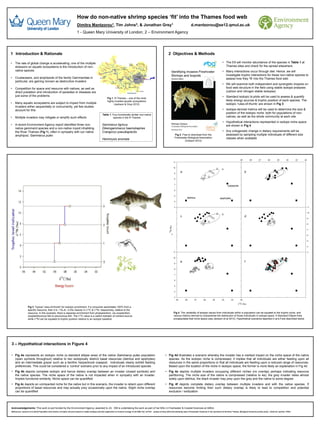
- 1. How do non-native shrimp species ‘fit’ into the Thames food web Dimitra Mantzorou1, Tim Johns2, & Jonathan Grey1 d.mantzorou@se12.qmul.ac.uk 1 - Queen Mary University of London; 2 – Environment Agency 1 Introduction & Rationale 2 Objectives & Methods • The rate of global change is accelerating; one of the multiple • The EA will monitor abundance of the species in Table 1 at stressors on aquatic ecosystems is the introduction of non- Thames sites and check for the spread elsewhere native species • Many interactions occur through diet. Hence, we will investigate trophic interactions for these non-native species to • Crustaceans, and amphipods of the family Gammaridae in assess how they ‘fit’ into the Thames food web particular, are gaining renown as destructive invaders • We will examine both independent and synergistic impacts on • Competition for space and resource with natives, as well as food web structure in the field using stable isotope analyses direct predation and introduction of parasites or diseases are (carbon and nitrogen stable isotopes) just some of the problems • Standard isotopic bi-plots will be used to assess & quantify Fig 1. R Thames – one of the most highly invaded aquatic ecosystems likely energy sources & trophic position of each species. The • Many aquatic ecosystems are subject to impact from multiple (Jackson & Grey 2012) isotopic ‘rules-of-thumb’ are shown in Fig 3 invaders either sequentially or concurrently, yet few studies account for this • Isotope-derived metrics will be used to determine the size & position of the isotopic niche, both for populations of non- Table 1. Four functionally similar non-native • Multiple invaders may mitigate or amplify such effects species in the R Thames natives, as well as the whole community at each site • Hypothetical interactions represented in isotope niche space • A recent Environment Agency report identified three non- Gammarus tigrinus are shown in Fig 4 native gammarid species and a non-native mysid inhabiting Dikerogammarus haemobaphes the River Thames (Fig 1), often in sympatry with our native Crangonyx pseudogracilis • Any ontogenetic change in dietary requirements will be amphipod, Gammarus pulex Fig 2. Free to download from the assessed by sampling multiple individuals of different size Freshwater Biological Association classes when available Hemimysis anomala (Dobson 2012) -29 -28 -27 -26 -25 -24 -23 -22 11 10 9 a b 8 7 copepods 6 5 detritus epiphytes 4 3 11 10 c d 9 8 N (‰) 7 15 6 5 4 11 3 10 e f 9 8 7 6 5 4 3 -29 -28 -27 -26 -25 -24 -23 -22 13 C (‰) Fig 3. Typical ‘rules-of-thumb’ for isotopic enrichment. If a consumer assimilates 100% from a specific resource, then it is ~1‰ & ~3.4‰ heavier in 13C & 15N, respectively, relative to the resource. In this example, there is stepwise enrichment from phytoplankton, via zooplankton, Fig 4. The variability of isotope values from individuals within a population can be equated to the trophic niche, and zooplanktivorous fish to piscivorous fish. The 13C value is a useful indicator of nutrient source, various metrics derived to characterise the distribution of those individuals in isotope space. A Standard Ellipse Area while 15N can be equated to trophic position relative to an isotopic baseline encapsulates that niche space (see Jackson et al 2012). Hypothetical scenarios depicted in a to f are described below 3 – Hypothetical interactions in Figure 4 • Fig 4a represents an isotopic niche (a standard ellipse area) of the native Gammarus pulex population • Fig 4d illustrates a scenario whereby the invader has a marked impact on the niche space of the native (open symbols throughout) relative to two isotopically distinct basal resources (detritus and epiphytes) species. As the isotopic niche is compressed, it implies that all individuals are either feeding upon all and an intermediate grazer such as a benthic harpacticoid copepod. Individuals clearly exhibit feeding resources in the same proportions or that all individuals are feeding upon a reduced range of resources. preferences. This could be considered a ‘control’ scenario prior to any impact of an introduced species Based upon the location of the niche in isotopic space, the former is more likely an explanation in Fig 4d • Fig 4b depicts complete isotopic and hence dietary overlap between an invader (closed symbols) and • Fig 4e depicts multiple invaders occupying different niches (no overlap) perhaps indicating resource the native species. The niche space of the native is not impacted when in sympatry with an invader. partitioning. The niche size of the native is compressed (relative to 4a); the grey invader relies almost Implies functional similarity. Niche space can be quantified solely upon detritus; the black invader may prey upon the grey and the native to some degree • Fig 4c depicts an unimpacted niche for the native but in this scenario, the invader is reliant upon different • Fig 4f depicts complete dietary overlap between multiple invaders and with the native species. If proportions of basal resources and may actually prey occasionally upon the native. Slight niche overlap resources become limiting then such dietary overlap is likely to lead to competition and potential can be quantified exclusion / extirpation Acknowledgements: This work is part funded by the Environment Agency, awarded to JG. DM is undertaking the work as part of her MSc in Freshwater & Coastal Sciences at QMUL References: Jackson et al (2012) Population level metrics of trophic structure based on stable isotopes and their application to invasion ecology. PLoS ONE 7(2): e31757; Jackson & Grey (2012) Accelerating rates of freshwater invasions in the catchment of the River Thames. Biological Invasions (online early) – Email for reprints / PDFs