

Recommandé
Contenu connexe
Tendances
Tendances (20)
Similaire à 08c vision processing steriopsis
Similaire à 08c vision processing steriopsis (7)
Plus de PS Deb
Plus de PS Deb (20)
Dernier
Dernier (20)
08c vision processing steriopsis
- 2. Convergence of lower receptive field at Visual Cortex
- 3. Simple Cell
- 5. Complex Cell
- 8. How we See
- 12. Convergence of Receptive Field
- 14. Organization of Visual Cortex
- 18. Blobs
- 26. Motion in the visual field
- 28. PET scan of MT area for Motion Processing
- 30. MT lesions in Monkey and Man with altered Motion Perception
- 31. Depth of vision
- 32. Neuronal basis of stereoscopic vision
Notes de l'éditeur
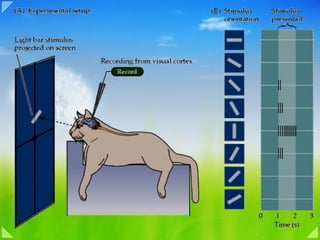
- Figure 27-11 Receptive field of a simple cell in the primary visual cortex. The receptive field of a cell in the visual system is determined by recording activity in the cell while spots and bars of light are projected onto the visual field at an appropriate distance from the fovea. The records shown here are for a single cell. Duration of illumination is indicated by a line above each record of action potentials. (Adapted from Hubel and Wiesel 1959 and Zeki 1993.) 1. The cell's response to a bar of light is strongest if the bar of light is vertically oriented in the center of its receptive field. 2. Spots of light consistently elicit weak responses or no response. A small spot in the excitatory center of the field elicits only a weak excitatory response ( a ). A small spot in the inhibitory area elicits a weak inhibitory response ( b ). Diffuse light produces no response ( c ). 3. By using spots of light, the excitatory or “on” areas (+) and inhibitory or “off” areas (-) can be mapped. The map of the responses reveals an elongated “on” area and a surrounding “off” area, consistent with the optimal response of the cell to a vertical bar of light. Simple and Complex Cells Decompose the Outlines of a Visual Image Into Short Line Segments of Various Orientations How is the complexity of the circuitry in the cerebral cortex reflected in the response properties of cortical cells? Hubel, Wiesel, and their colleagues found that most cells above and below layer 4 respond optimally to stimuli that are substantially more complex than those that excite cells in the retina and lateral geniculate nucleus. Their most unexpected finding was that small spots of light—which are so effective in the retina, lateral geniculate nucleus, and in the input layer of the cortex 4C—are much less effective in all other layers of the visual cortex except possibly the blob regions in the superficial layers. Instead, cells respond best to stimuli that have linear properties, such as a line or bar. These cells belong to two major groups, simple and complex. Figure 12.9. Neurons in the primary visual cortex respond selectively to oriented edges. (A) An anesthetized animal is fitted with contact lenses to focus the eyes on a screen, where images can be projected; an extracellualr electrode records the neuronal responses. (B) Neurons in visual cortex typically respond vigorously to a bar of light oriented at a particular angle and weakly—or not at all—to other orientations. The Functional Organization of the Striate Cortex Much in the same way that Stephen Kuffler explored the response properties of individual retinal ganglion cells (see Chapter 11 ), David Hubel and Torsten Wiesel used microelectrode recordings to examine the properties of neurons in more central visual structures. The responses of neurons in the lateral geniculate nucleus were found to be remarkably similar to those in the retina, with a center-surround receptive field organization and selectivity for luminance increases or decreases. However, the small spots of light that were so effective stimulating neurons in the retina and lateral geniculate nucleus were largely ineffective in visual cortex. Instead, most cortical neurons in cats and monkeys were found to respond vigorously to light-dark bars or edges, and only if the bars were presented at a particular range of orientations within the cell's receptive field ( Figure 12.9 ). The responses of cortical neurons are thus tuned to the orientation of edges, much like cone receptors are tuned to the wavelength of light; the peak in the tuning curve (the orientation to which a cell is most responsive) is referred to as the neuron's preferred orientation. By sampling the responses of a large number of single cells, Hubel and Weisel demonstrated that all edge orientations were roughly equally represented in visual cortex. As a result, a given orientation in a visual scene appears to be “encoded” in the activity of a distinct population of orientation-selective neurons . Hubel and Wiesel also found that there are subtly different subtypes within a class of neurons that preferred the same orientation. For example, the receptive fields of some cortical cells, which they called simple cells , were composed of spatially separate “on” and “off” response zones, as if the “on” and “off” centers of lateral geniculate cells that supplied these neurons were arrayed in separate parallel bands. Other neurons, referred to as complex cells , exhibited mixed “on” and “off” responses throughout their receptive field, as if they received their inputs from a number of simple cells. Further analysis uncovered cortical neurons sensitive to the length of the bar of light that was moved across their receptive field, decreasing their rate of response when the bar exceeded a certain length. Still other cells responded selectively to the direction in which an edge moved across their receptive field. Although the mechanisms responsible for generating these selective responses are still not well understood, there is little doubt that the specificity of the receptive field properties of neurons in the striate cortex (and beyond) plays an important role in determining the basic attributes of visual scenes. Another feature that distinguishes the responses of neurons in the striate cortex from those at earlier stages in the primary visual pathway is binocularity . Although the lateral geniculate nucleus receives inputs from both eyes, the axons terminate in separate layers, so that individual geniculate neurons are monocular, driven by either the left or right eye but not by both ( Figure 12.10 ; see also Figure 12.14 ). In some species, including most (but not all) primates, inputs from the left and right eyes remain segregated to some degree even beyond the geniculate because the axons of geniculate neurons terminate in alternating eye-specific columns within cortical layer IV—the so-called ocular dominance columns (see the next section). Beyond this point, the signals from the two eyes are combined at the cellular level. Thus, most cortical neurons have binocular receptive fields, and these fields are almost identical, having the same size, shape, preferred orientation, and roughly the same position in the visual field of each eye. Bringing together the inputs from the two eyes at the level of the striate cortex provides a basis for stereopsis , the special sensation of depth that arises from viewing nearby objects with two eyes instead of one. Because the two eyes look at the world from slightly different angles, objects that lie in front of or behind the plane of fixation project to noncorresponding points on the two retinas. To convince yourself of this fact, hold your hand at arm's length and fixate on the tip of one finger. Maintain fixation on the finger as you hold a pencil in your other hand about half as far away. At this distance, the image of the pencil falls on noncorresponding points on the two retinas and will therefore be perceived as two separate pencils (a phenomenon called double vision, or diplopia ). If the pencil is now moved toward the finger (the point of fixation), the two images of the pencil fuse and a single pencil is seen in front of the finger. Thus, for a small distance on either side of the plane of fixation, where the disparity between the two views of the world remains modest, a single image is perceived; the disparity between the two eye views of objects nearer or farther than the point of fixation is interpreted as depth ( Figure 12.11 ). Although the neurophysiological basis of stereopsis is not understood, some neurons in the striate cortex and in other visual cortical areas have receptive field properties that make them good candidates for extracting information about binocular disparity. Unlike many binocular cells whose monocular receptive fields sample the same region of visual space, these neurons have monocular fields that are slightly displaced (or perhaps differ in their internal organization) so that the cell is maximally activated by stimuli that fall on noncorresponding parts of the retinas. Some of these neurons (so-called far cells ) discharge to disparities beyond the plane of fixation, while others ( near cells ) respond to disparities in front of the plane of fixation. The pattern of activity in these different classes of neurons seems likely to contribute to sensations of stereoscopic depth ( Box B ). Interestingly, the preservation of the binocular responses of cortical neurons is contingent on the normal activity from the two eyes during early postnatal life. Anything that creates an imbalance in the activity of the two eyes—for example, the clouding of one lens or the abnormal alignment of the eyes during infancy (strabismus)—can permanently reduce the effectiveness of one eye in driving cortical neurons, and thus impair the ability to use binocular information as a cue for depth. Early detection and correction of visual problems is therefore essential for normal visual function in maturity (see Chapter 24 ).
- The simple cell receptive fields in the primary visual cortex are thought to be the result of the convergence of several adjacent receptive fields of cells in the relay that precedes it, the lateral geniculate nucleus . Note, by the way, that the receptive fields of this nucleus are still circular, like those of its source, the ganglion neurons in the retina. Other cells in the primary visual cortex have "complex" and "hypercomplex" receptive fields with properties that are even more selective.
- Figure 27-12 The receptive fields of simple cells in the primary visual cortex are different and more varied than those of the neurons in the retina and lateral geniculate nucleus. A. Cells of the retina and lateral geniculate nucleus fall into two classes: on-center and offcenter. The receptive fields of these neurons have a center-surround organization due to antagonistic excitatory (+) and inhibitory (-) regions. B. The receptive fields of simple cells in the primary visual cortex have narrow elongated zones with either excitatory (+) or inhibitory (-) flanking areas. Despite the variety, the receptive fields of simple cells share three features: (1) specific retinal position, (2) discrete excitatory and inhibitory zones, and (3) a specific axis of orientation. C. Model of the organization of inputs in the receptive field of simple cells proposed by Hubel and Wiesel. According to this model, a simple cortical neuron in the primary visual cortex receives convergent excitatory connections from three or more on-center cells that together represent light falling along a straight line in the retina. As a result, the receptive field of the simple cortical cell has an elongated excitatory region, indicated by the colored outline in the receptive field diagram. The inhibitory surround of the simple cortical cells is probably provided by off-center cells whose receptive fields (not shown) are adjacent to those of the on-center cells. (Adapted from Hubel and Wiesel 1962).
- In addition to the simple cells found mainly in layer IV of the visual cortex, there are other cells, outside of layer IV, that respond to a light stimulus only if it has a particular orientation and is moving. These are called complex cells . They detect movement through two mechanisms. First, when the axons of many simple cells with the same orientation and adjacent but not identical receptive fields converge on a complex cell, it can detect movement from the differences between these fields. Second, complex cells can detect movement through the phenomenon of temporal summation: if a cell that has already been excited once is excited again shortly afterward, its membrane is still depolarized enough that a stimulus that would not normally suffice to trigger another action potential can do so. Thus, when a moving light beam activates several simple cells in succession, the temporal summation of the stimuli applied to them causes the complex cell to respond to the movement. Complex cells also frequently display selectivity for direction, responding only when the stimulus is moving in one direction and not in the other. And unlike simple cells, complex cells are not fussy about where the band of light is located in their receptive field. Complex cells represent a further level of visual information processing, but certainly not the ultimate one, because researchers have also discovered the existence of hypercomplex cells
- Figure 27-13 The receptive field of a complex cell in the primary visual cortex has no clearly excitatory or inhibitory zones. Orientation of the light stimulus is important, but position within the receptive field is not. (Adapted from Hubel and Wiesel 1962). A. In this example the cell responds best to a vertical edge moving across the receptive field from left to right. This figure shows the patterns of action potentials fired by the cell in response to two types of variation in the stimulus: differences in orientation and differences in position. The line above each record indicates the period of illumination. Different orientations of the light stimulus produce different rates of firing in the cell. A vertical bar of light on the left of the receptive field produces a strong excitatory response (a). Orientations other than vertical are less effective ( b-d ). The position of the border of the light within the receptive field affects the type of response in the cell. If the edge of the light comes from any point on the right within the receptive field, the stimulus produces an excitatory response ( a-d ). If the edge comes from the left, the stimulus produces an inhibitory response ( f-i ). Illumination of the entire receptive field produces no response ( e ). B. According to Hubel and Wiesel, the receptive fields of complex cells are determined by the pattern of inputs. Each complex cell receives convergent excitatory input from several simple cortical cells, each of which has a receptive field with the same organization: a central rectilinear excitation zone (+) and flanking inhibitory regions (-). In this way the receptive field of a complex cell is built up from the individual fields of the presynaptic cells. The simple cells respond best to a bar of light with a specific orientation. For example, a cell that responds best to a vertical bar will not respond, or respond only weakly, to a bar that is horizontal or even oblique (Figure 27-11). Thus, an array of cells in the cortex, all receiving impulses from the same point on the retina but with rectilinear receptive fields with different axes of orientation, is able to represent every axis of rotation for that point on the retina. Simple cells also have excitatory and inhibitory zones in their receptive fields, although these zones are slightly larger than those for lateral geniculate cells (Figure 27-12A, B). For example, a cell may have a rectilinear excitatory zone (with its long axis running from 12 to 6 o'clock such as in Figure 27-12B upper right). For a cell with such a field, an effective stimulus must excite the specific segment of the retina innervated by receptors in the excitatory zone and have the correct linear properties (in this case an edge) and have a specific axis of orientation (in this case vertical, running from 12 to 6 o'clock). Rectilinear receptive fields could be built up from many circular fields if the presynaptic connections from the lateral geniculate nucleus were appropriately arrayed on the simple cell (Figure 27-12C). Indeed, experiments have indicated that the excitatory (“on”) regions in the receptive field of simple cells largely represent the input from on-center lateral geniculate cells while the inhibitory (“off”) regions represent inputs from off- center lateral geniculate cells. The receptive fields of complex cells in the cortex are usually larger than those of simple cells. These fields also have a critical axis of orientation, but the precise position of the stimulus within the receptive field is less crucial because there are no clearly defined on or off zones (Figure 27-13A). Thus, movement across the receptive field is a particularly effective stimulus for certain complex cells. Although some complex cells have direct connections with cells of layer 4C, Hubel and Wiesel proposed that a significant input to complex cells comes from a group of simple cortical cells with the same axis of orientation but with slightly offset receptive field positions (Figure 27-13B). Some Feature Abstraction Is Accomplished by Progressive Convergence The pattern of convergence of inputs throughout the pathway that leads to the complex cells suggests that each complex cell surveys the activity of a group of simple cells, each simple cell surveys the activity of a group of geniculate cells, and each geniculate cell surveys the activity of a group of retinal ganglion cells. The ganglion cells survey the activity of bipolar cells that, in turn, survey an array of receptors. At each level each cell has a greater capacity for abstraction than cells At each level of the afferent pathway the stimulus properties that activate a cell become more specific. Retinal ganglion and geniculate neurons respond primarily to contrast. This elementary information is transformed in the simple and complex cells of the cortex, through the pattern of excitation in their rectilinear fields, into relatively precise line segments and boundaries. Hubel and Wiesel suggest that this processing is an important step in analyzing the contours of objects. In fact, contour information may be sufficient to recognize an object. Monotonous interior or background surfaces contain no critical visual information! David Hubel describes this unexpected feature of perception: Many people, including myself, still have trouble accepting the idea that the interior of a form… does not itself excite cells in our brain,… that our awareness of the interior as black or white. … depends only on cells' sensitivity to the borders. The intellectual argument is that perception of an evenly lit interior depends on the activation of cells having fields at the borders and on the absence of activation of cells whose fields are within the borders, since such activation would indicate that the interior is not evenly lit. So our perception of the interior as black, white, gray or green has nothing to do with cells whose fields are in the interior—hard as that may be to swallow.… What happens at the borders is the only information you need to know: the interior is boring. It is the information carried by edges that allows us to recognize objects in a picture readily even when the objects are sketched only in rough outline (see Figure 25-3). Since simple and complex cells in V1 receive input from both the M and P pathways, both pathways could contribute to what the theoretical biologist David Marr called the primal sketch , the initial two-dimensional approximation of the shape of a stimulus. We will return in Chapter 28 to the fate of the P and M pathways.
- Horace Barlow and William Levick proposed this circuit to explain directional selectivity. Synapses from purple to green are excitatory, and from green to white, inhibitory. We suppose the three white cells at the bottom converge on a single master cell. In the visual cortex, in addition to the simple and complex cells in the primary visual area (V1, also known as Area 17 or the striate cortex) and in secondary visual area 18 (V2), there are hypercomplex cells in secondary visual area 19 (V5 or MT) that respond only if a light stimulus presents a given ratio of lit surface to dark surface, or is coming from a given angle, or includes moving shapes. Some of these hypercomplex cells also are sensitive only to lines of a certain length, so that if the stimulus extends beyond this length, the cells' response is reduced. Hypercomplex cells occur when axons from several complex cells with different orientations and adjacent visual fields converge on a single neuron. These hypercomplex cells provide yet another level of information processing. At every level, each cell "sees" more than the cells at the levels below it, and the highest-level cells have the greatest power of abstraction. This capability is generated by the neuronal connections at every stage along the visual pathways from the eyes right up to the various visual cortexes in the brain.
- THE SIGNIFICANCE OF MOVEMENT-SENSITIVE CELLS, INCLUDING SOME COMMENTS ON HOW WE SEE Why are movement-sensitive cells so common? An obvious first guess is that they tell us if the visual landscape contains a moving object. To animals, ourselves included, changes in the outside world are far more important than static conditions, for the survival of predator and prey alike. It is therefore no wonder that most cortical cells respond better to a moving object than to a stationary one. Having carried the logic this far, you may now begin to wonder how we analyze a stationary landscape at all if, in the interests of having high movement sensitivity, so many oriented cells are insensitive to stationary contours. The answer requires a short digression, which takes us to some basic, seemingly counterintuitive facts about how we see. First, you might expect that in exploring our visual surroundings, we let our eyes freely rove around in smooth, continuous movement. What our two eyes in fact do is fixate on an object: we first adjust the positions of our eyes so that the images of the object fall on the two foveas; then we hold that position for a brief period, say, half a second; then our eyes suddenly jump to a new position by fixating on a new target whose presence somewhere out in the visual field has asserted itself, either by moving slightly, by contrasting with the background, or by presenting an interesting shape. During the jump, or saccade, which is French for "jolt", or "jerk" (the verb), the eyes move so rapidly that our visual system does not even respond to the resulting movement of the scene across the retina; we are altogether unaware of the violent change. (Vision may also in some sense be turned off during saccades by a complex circuit linking eye-movement centers with the visual path.) Exploring a visual scene, in reading or just looking around, is thus a process of having our eyes jump in rapid succession from one place to another. Detailed monitoring of eye movements shows vividly how unaware we are of any of this. To monitor eye movements we first attach a tiny mirror to a contact lens, at the side, where it does not block vision; we then reflect a spot of light off the mirror onto a screen. Or, using a more modern version invented by David Robinson at the Wilmer Institute at Johns Hopkins, we can mount a tiny coil of wire around the rim of a contact lens, with the subject seated between two orthogonal pairs of bicycle-wheel size hoops containing coils of wire; currents in these coils induce currents in the contact-lens coil, which can be calibrated to give precise monitoring of eye movements. Neither method is what you would call a picnic for the poor subject. In 1957, Russian psychophysicist A. L. Yarbus recorded eye movements of subjects as they explored various images, such as a woods or female faces (see the illustrations below), by showing the stopping places of a subject's gaze as dots joined by lines indicating the eyes' trajectory during the jumps. A glance at these amazing pictures gives us a world of information about our vision—even about the objects and details that interest us in our environment. So the first counterintuitive fact is that in visual exploration our eyes jump around from one point of interest to another: we cannot explore a stationary scene by swinging our eyes past it in continuous movements. The visual system seems intent instead on keeping the image of a scene anchored on our retinas, on preventing it from sliding around. If the whole scene moves by, as occurs when we look out a train window, we follow it by fixating on an object and maintaining fixation by moving our eyes until the object gets out of range, whereupon we make a saccade to a new object. This whole sequence— following with smooth pursuit, say, to the right, then making a saccade to the left—is called nystagmus . You can observe the sequence—perhaps next time you are in a moving train or streetcar—by looking at your neighbor's eyes as he or she looks out a window at the passing scene—taking care not to have your attentions misunderstood! The process of making visual saccades to items of interest, in order to get their images on the fovea, is carried out largely by the superior colliculus, as Peter Schiller at MIT showed in an impressive series of papers in the 1970s. The second set of facts about how we see is even more counterintuitive. When we look at a stationary scene by fixating on some point of interest, our eyes lock onto that point, as just described, but the locking is not absolute. Despite any efforts we may make, the eyes do not hold perfectly still but make constant tiny movements called microsaccades ; these occur several times per second and are more or less random in direction and about1 to 2 minutes of arc in amplitude. In 1952 Lorrin Riggs and Floyd Ratliff, at Brown University, and R. W. Ditchburn and B. L. Ginsborg, at Reading University, simultaneously and independently found that if an image is optically artificially stabilized on the retina, eliminating any movement relative to the retina, vision fades away after about a second and the scene becomes quite blank! (The simplest way of stabilizing is to attach a tiny spotlight to a contact lens; as the eye moves, the spot moves too, and quickly fades.) Artificially moving the image on the retina, even by a tiny amount, causes the spot to reappear at once. Evidently, microsaccades are necessary for us to continue to see stationary objects. It is as if the visual system, after going to the trouble to make movement a powerful stimulus—wiring up cells so as to be insensitive to stationary objects—had then to invent microsaccades to make stationary objects visible. We can guess that cortical complex cells, with their very high sensitivity to movement, are involved in this process. Directional selectivity is probably not involved, because microsaccadic movements are apparently random in direction. On the other hand, directional selectivity would seem very useful for detecting movements ot objects against a stationary background, by telling us that a movement is taking place and in what direction. To follow a moving object against a stationary background, we have to lock onto the object and track it with our eyes; the rest of the scene then slips across the retina, an event that otherwise occurs only rarely. Such slippage, with every contour in the scene moving across the retina, must produce a tremendous storm of activity in our cortex.
- RECEPTIVE FIELDS, FROM THE RETINA TO THE CORTEX Bipolar cells have centre-surround receptive fields . The centre of each such field receives direct connections from a small number of photoreceptors, while the surrounding area (called the "surround") receives inputs from a larger set of photoreceptors whose activity is relayed by the horizontal cells . Light shining on the centre of a bipolar cell's receptive field and light shining on the surround produce opposite changes in the cell's membrane potential. The diagram here uses an ON-centre bipolar cell as an example. If light is shined on the centre of this cell's receptive field, the first change is a hyperpolarization of the photoreceptor cell, causing depolarization of the bipolar cell, because of the inhibitory nature of the synapse between them . This depolarization in turn excites the following cell, a ganglion cell, causing it to emit action potentials at a higher frequency. Source: Adapted from J.E. Dowling Conversely, if light were shined on the surround of the receptive field of this same ON-centre bipolar cell, it would become hyperpolarized. In contrast, another kind of bipolar cell becomes depolarized when an area of darkness strikes the centre of its receptive field, and hyperpolarized when it strikes the surround. Bipolar cells of this kind are called OFF-centre cells.
- THE TARGETS OF THE OPTIC NERVE The axons of the retina's ganglion cells pass through the optic nerve, the optic chiasm, and the optic tractus . They wrap around the midbrain and cross the medial surface of the temporal lobe, and 80% of them then terminate in a synaptic relay called the lateral geniculate nucleus (LGN), located in the dorsal part of the thalamus. The LGN is thus the major target for each optic tract. In cross-section, the left and right LGNs are seen to be organized into six distinct cell layers. When examined in three dimensions, these six layers look like a stack of pancakes folded around the optic tract in a way that resembles a knee joint, whence the name "geniculate", from the Latin for knee. The distribution of the LGN's neurons into various layers suggests that some distinct aspects of the visual information from the retina may be processed separately in this synaptic relay. And that is exactly what has been demonstrated experimentally. Because the right LGN processes all of the visual signals from the left visual field (and vice versa for the left LGN), it receives axons from the left nasal retina and the right temporal retina. Research has shown that the axons from the ipsilateral eye (in this case, the right eye) synapse on cell layers 2, 3, and 5 in the LGN, whereas those from the contralateral eye (here, the left one) project to layers 1, 4, and 6. Examination reveals that the LGN's ventral layers (1 and 2) contain larger neurons than its more dorsal layers (3, 4, 5, and 6). The two ventral layers are therefore called magnocellular (M) layers, while the four others are called parvocellular (P) layers, just like the type M and type P ganglion cells . In fact, it has been shown that it is precisely these type M ganglion cells that project to the magnocellular layers of the LGN, and the type P ganglion cells that project to its parvocellular layers. The parallel processing in distinct information channels that begins in the retina thus seems to be maintained through the LGN. Even the small neurons that form the koniocellular layers on the ventral side of each of the six numbered layers of the LGN receive connections from the non-M non-P ganglion cells in the retina. This observation confirms the segregation of information from different types of ganglion cells. Despite the great influence that innervation from the retina has on the structure of the LGN, about 80% of the excitatory inputs to the LGN come not from the retina but from the primary visual cortex! The primary visual cortex thus appears to exert a significant feedback effect on the LGN . In other words, the LGN's main target may in turn modify the LGN's own visual responses. Another observation lends weight to the idea that the LGN, just like the other subcortical structures involved in vision , does more than just passively relay information from the retina to the cortex: the LGN may be activated by brainstem neurons whose activity is associated with vigilance and with processes related to attentiveness. These neurons seem to modulate the response of the LGN neurons, which tends to confirm that the LGN is actually the first location on the visual pathway where particular mental states can influence our visual perception. RESPONSES OF LATERAL GENICULATE CELLS The fibers corning to the brain from each eye pass uninterrupted through the optic chiasm (from chi, X, the Greek letter whose shape is a cross). There, about half the fibers cross to the side of the brain opposite the eye of origin, and half stay on the same side. From the chiasm the fibers continue to several destinations in the brain. Some go to structures that have to do with such specific functions as eye movements and the pupillary light reflex, but most terminate in the two lateral geniculate bodies. Compared with the cerebral cortex or with many other parts of the brain, the lateral geniculates are simple structures: all or almost all of the roughly one and one half million cells in each geniculate nucleus receive input directly from optic-nerve fibers, and most (not all) of the cells send axons on to the cerebral cortex. In this sense, the lateral geniculate bodies contain only one synaptic stage, but it would be a mistake to think of them as mere relay stations. They receive fibers not only from the optic nerves but also back from the cerebral cortex, to which they project, and from the brainstem reticular formation, which plays some role in attention or arousal. Some geniculate cells with axons less than a millimeter long do not leave the geniculate but synapse locally on other geniculate cells. Despite these complicating features, single cells in the geniculate respond to light in much the same way as retinal ganglion cells, with similar on-center and off-center receptive fields and similar responses to color. In terms of visual information, then, the lateral geniculate bodies do not seem to be exerting any profound transformation, and we simply don't yet know what to make of the nonvisual inputs and the local synaptic interconnection.
- LAYERING OF THE LATERAL GENICULATE Each lateral geniculate body is composed of six layers of cells stacked one on the other like a club sandwich. Each layer is made up of cells piled four to ten or more deep. The whole sandwich is folded along a fore-and-aft axis, giving the cross-sectional appearance shown in the illustration on the top of the next page. The six cell layers show clearly in the left lateral geniculate body of a macaque monkey, seen in a section cut parallel to the face. The section is stained to show cell bodies, each of which appears as a dot. The stacked-plate organization is preserved in going from retina to geniculate, except that the fibers from the retinas are bundled into a cable and splayed out again, in an orderly way, at their geniculate destination. In the scheme in which one plate projects to the next, an important complication arises in the transition from retina to geniculate; here the two eyes join up, with the two separate plates of retinal ganglion cells projecting to the sextuple geniculate plate. A single cell in the lateral geniculate body does not receive convergent input from the two eyes: a cell is a right-eye cell or a left-eye cell. These two sets of cells are segregated into separate layers, so that all the cells in any one layer get input from one eye only. The layers are stacked in such a way that the eyes alternate. In the left lateral geniculate body, the sequence in going from layer to layer, from above downwards, is right, left, right, left, left, right. It is not at all clear why the sequence reverses between the fourth and fifth layers—sometimes I think it is just to make it harder to remember. We really have no good idea why there is a sequence at all. As a whole, the sextuple-plate structure has just one topography. Thus the two left half-retinal surfaces project to one sextuple plate, the left lateral geniculate (see the bottom figure on the previous page). Similarly, the right half-retinas project to the right geniculate. Any single point in one layer corresponds to a point in the layer implies movement in the visual field along some path dictated by the visual-field-to-geniculate map. If we move instead in a direction perpendicular to the layers—for example, along the radial line in the figure on the top of the previous page—as the electrode passes from one layer to the next, the receptive fields stay in the same part of the visual field but the eyes switch—except, of course, where the sequence reverses. The half visual field maps onto each geniculate six times, three for each eye, with the maps in precise register. The lateral geniculate body seems to be two organs in one. With some justification we can consider the ventral, or bottom, two layers {ventral means "belly") as an entity because the cells they contain are different from the cells in the other four layers: they are bigger and respond differently to visual stimuli. We should also consider the four dorsal , or upper, layers {dorsal means "back" as opposed to "belly") as a separate structure because they are histologically and physiologically so similar to each other. Because of the different sizes of their cells, these two sets of layers are called magnocellular (ventral) and parvocellular (dorsal). Fibers from the six layers combine in a broad band called the optic radiations , which ascends to the primary visual cortex (see the illustration on page 2.) There, the fibers fan out in a regular way and distribute themselves so as to make a single orderly map, just as the optic nerve did on reaching the geniculate. This brings us, finally, to the cortex.
- Figure 27-9 Each half of the visual field is represented in the contralateral primary visual cortex. In humans the primary visual cortex is located at the posterior pole of the cerebral hemisphere and lies almost exclusively on the medial surface. (In some individuals it is shifted so that part of it extends onto the lateral surface.) Areas in the primary visual cortex are devoted to specific parts of the visual field, as indicated by the corresponding numbers. The upper fields are mapped below the calcarine fissure, and the lower fields above it. The striking aspect of this map is that about half of the neural mass is devoted to representation of the fovea and the region just around it. This area has the greatest visual acuity. The Primary Visual Cortex Organizes Simple Retinal Inputs Into the Building Blocks of Visual Images The first point in the visual pathway where the receptive fields of cells are significantly different from those of cells in the retina is the primary visual cortex, also called visual area 1 (abbreviated V1). This region of cortex, Brodmann's area 17, is also called the striate cortex because it contains a prominent stripe of white matter in layer 4, the stria of Gennari , consisting of myelinated axons. Like the lateral geniculate nucleus and superior colliculus, the primary visual cortex in each cerebral hemisphere receives information exclusively from the contralateral half of the visual field (Figure 27-9). Organization and Function of the Visual Cortex Figures 51–2 and 51–3 show the visual cortex located primarily on the medial aspect of the occipital lobes. Like the cortical representations of the other sensory systems, the visual cortex is divided into a primary visual cortex and secondary visual areas. Primary Visual Cortex. The primary visual cortex (see Figure 51–2) lies in the calcarine fissure area, extending forward from the occipital pole on the medial aspect of each occipital cortex. This area is the terminus of direct visual signals from the eyes. Signals from the macular area of the retina terminate near the occipital pole, as shown in Figure 51–2, while signals from the more peripheral retina terminate at or in concentric half circles anterior to the pole but still along the calcarine fissure on the medial occipital lobe. The upper portion of the retina is represented superiorly and the lower portion inferiorly. Note in the figure the especially large area that represents the macula. It is to this region that the retinal fovea transmits its signals. The fovea is responsible for the highest degree of visual acuity. Based on retinal area, the fovea has several hundred times as much representation in the primary visual cortex as do the most peripheral portions of the retina. The primary visual cortex is also called visual area I . Still another name is the striate cortex because this area has a grossly striated appearance. Secondary Visual Areas of the Cortex. The secondary visual areas, also called visual association areas, lie lateral, anterior, superior, and inferior to the primary visual cortex. Most of these areas also fold outward over the lateral surfaces of the occipital and parietal cortex, as shown in Figure 51–3. Secondary signals are transmitted to these areas for analysis of visual meanings. For instance, on all sides of the primary visual cortex is Brodmann’s area 18 (see Figure 51–3), which is where virtually all signals from the primary visual cortex pass next. Therefore, Brodmann’s area 18 is called visual area II, or simply V-2.The other, more distant secondary visual areas have specific designations—V-3, V-4, and so forth—up to more than a dozen areas. The importance of all these areas is that various aspects of the visual image are progressively dissected and analyzed. Two Major Pathways for Analysis of Visual Information— (1) The Fast “Position” and “Motion” Pathway; (2) The Accurate Color Pathway Figure 51–3 shows that after leaving the primary visual cortex, the visual information is analyzed in two major pathways in the secondary visual areas. 1. Analysis of Third-Dimensional Position, Gross Form, and Motion of Objects. One of the analytical pathways, demonstrated in Figure 51–3 by the black arrows, analyzes the third-dimensional positions of visual objects in the space around the body. This pathway also analyzes the gross physical form of the visual scene as well as motion in the scene. In other words, this pathway tells where every object is during each instant and whether it is moving. After leaving the primary visual cortex, the signals flow generally into the posterior midtemporal area and upward into the broad occipitoparietal cortex. At the anterior border of the parietal cortex, the signals overlap with signals from the posterior somatic association areas that analyze threedimensional aspects of somatosensory signals. The signals transmitted in this position-form-motion pathway are mainly from the large Y optic nerve fibers of the retinal Y ganglion cells, transmitting rapid signals but depicting only black and white with no color. 2. Analysis of Visual Detail and Color. The red arrows in Figure 51–3, passing from the primary visual cortex into secondary visual areas of the inferior, ventral, and medial regions of the occipital and temporal cortex, show the principal pathway for analysis of visual detail. Separate portions of this pathway specifically dissect out color as well. Therefore, this pathway is concerned with such visual feats as recognizing letters, reading, determining the texture of surfaces, determining detailed colors of objects, and deciphering from all this information what the object is and what it means.
- In the visual cortex, the cell bodies of the neurons are divided into six layers that typify the primate neocortex . In this thin envelope of grey matter , about 2 mm thick, the six layers are numbered from I to VI, in Roman numerals, starting from the outside (the layer in contact with the meninges ). Each layer is distinguished both by the type of neurons that it contains and by the connections that it makes with other areas of the brain. Layer IV, for example, contains numerous stellate cells , small neurons with dendrites that radiate out around the cell body and receive connections from the lateral geniculate nucleus . Thus this layer specializes largely in receiving information. Pyramidal cells are found in several layers of the visual cortex and are the only type of neurons that project axons outside it. Each pyramidal cell has one large dendrite, called the apical dendrite, that branches upward into the higher layers of the cortex, and other dendrites that emerge from the base of the cell. Of course, each pyramidal cell also has an axon, which may be very long to reach distant areas of the brain. Layers III, V, and VI contain large numbers of pyramidal cells and consequently serve as output pathways for the visual cortex. Layer I contains very few neurons. It is composed of axons and dendrites from cells in the other layers. With the development of improved staining methods, some of the six layers in the visual cortex have now been classified into sub-layers .
- THE CELLULAR STRUCTURE OF THE VISUAL CORTEX The primary visual cortex, like all the other parts of the neocortex , has a stratified cellular structure. Layers I to VI, originally described by Brodmann, had to be further subdivided as more was learned about the input and output pathways of the visual cortex. First, layer IV was divided into three sublayers designated IV A, IV B, and IV C. Then layer IV C was itself subdivided into IV Ca and IV Cb when a difference was found between the connectivities of the cells of the upper and lower parts of this sublayer. The axons of the cells of the lateral geniculate nucleus transmit information from the eye along various pathways that project mainly into layer IV C. In addition, the neighbouring cells in this layer receive receive information from neighbouring areas of the retina, thus preserving a retinotopic structure. We also know that the information flows emerging from the lateral geniculate nucleus use separate channels arising from its internal structure . In layer IV C, these information streams are received by the stellate cells , whose axons pass them on to the dendrites of the pyramidal cells in layers IV B and III. These pyramidal cells then project their axons to other areas of the cortex. As for the other output pathways from the primary visual cortex, we know that the pyramidal cells in layer V project to the superior colliculus and the pons at the subcortical level, and that the axons from layer VI return massively to the lateral geniculate nucleus, thus exerting a feedback effect on this structure. This stratification of the visual cortex into horizontal layers can be readily revealed through simple staining of its neurons. But the visual cortex is also organized into vertical columns, which were not detected until electrophysiological recordings were made of these neurons. David Hubel and Torsten Wiesel were the first scientists to propose this columnar structure superimposed on the horizontal layers. Using microelectrodes to explore the receptive fields of the neurons of the visual cortex, they showed that this cortex can be regarded as a collection of essentially identical columns. The difference from one column to the next comes simply from the portion of the visual field that is assigned to each of them. The succession of functions of the various layers from the top of the column to the bottom remains the same, but each column processes a characteristic (contrast, colour, orientation, movement, etc.) of a different part of the visual field .
- Figure 27-16 The ocular dominance columns. A. This autoradiograph of the primary visual cortex of an adult monkey shows the ocular dominance columns as alternating white and dark (labeled and unlabeled) patches in layer 4 of the cortex, below the pial surface. One eye of the monkey was injected with a cell label, which over the course of 2 weeks was transported to the lateral geniculate nucleus and then across synapses to the geniculocortical relay cells, whose axons terminate in layer 4 of the visual cortex. Areas of layer 4 that receive input from the injected eye are heavily labeled and appear white; the alternating unlabeled patches receive input from the uninjected eye. In all, some 56 columns can be counted in layer 4C. The underlying white matter appears white because it contains the labeled axons of geniculate cells. (From Hubel and Wiesel 1979.) B. The scheme of inputs to the alternating ocular dominance columns in layer 4 of the primary visual cortex. Inputs from the contralateral ( C ) and ipsilateral ( I ) eyes arise in different layers in the lateral geniculate nucleus ( LGN ), identified in Figure 27-5, and project to different subdivisions of layer 4.
- Figure 27-15 Organization of blobs in the visual cortex. A. Blobs are visible as dark patches in this photograph of a single 40μm thick layer of upper cortex that has been processed histochemically to reveal the density of cytochrome oxidase, a mitochondrial enzyme involved in energy production. The heightened enzymatic activity in the blobs is thought to represent heightened neural activity. The cortex was sectioned tangentially. (Courtesy of D. Ts'o, C. Gilbert, and T. Wiesel.) B. Organization of the blobs in relation to the orientation columns. Only the upper layers of the cortex are shown with the blobs extending though these layers. The blobs interrupt the pattern of the orientation columns. In addition to columns of cells responsive to axis of orientation and blobs related to color processing, a third system of alternating columns processes separate inputs from each eye. These ocular dominance columns, which we shall consider again in Chapter 56, represent an orderly arrangement of cells that receive inputs only from the left or right eye and are important for binocular interaction. The ocular dominance columns have been visualized using transsynaptic transport of radiolabeled amino acids injected into one eye. In autoradiographs of sections of cortex cut perpendicular to the layers, patches in layer 4 that receive input from the injected eye are heavily labeled, and they alternate with unlabeled patches that mediate input from the uninjected eye (Figure 27-16).
- Figure 27-17 Organization of orientation columns, ocular dominance columns, and blobs in primary visual cortex. A. An array of functional columns of cells in the visual cortex contains the neural machinery necessary to analyze a discrete region of the visual field and can be thought of as a functional module. Each module contains one complete set of orientation columns, one set of ocular dominance columns (right and left eye), and several blobs (regions of the cortex associated with color processing). The entire visual field can be represented in the visual cortex by a regular array of such modules. B. Images depicting ocular dominance columns, orientation columns, and blobs from the same region of primary visual cortex. (Courtesy of Gary Blasdel.) 1. Images of ocular dominance columns were obtained using optical imaging and independently stimulating the left and right ocular dominance columns in a particular region. Because neural activity decreases cortical reflectance, the subtraction of one left eye image from one right eye image produces the characteristic pattern of dark and light bands, representing the right and left eyes respectively. 2. In this image the borders of the ocular dominance columns shown in 1 appear as black lines superimposed on the pattern of orientation-specific columns depicted in Figure 27-14. 3. The borders of the ocular dominance columns shown in 1 are superimposed on tissue reacted for cytochrome oxidase, which visualizes the blobs. The blobs are thus seen localized in the centers of the ocular dominance columns. A Hypercolumn Represents the Visual Properties of One Region of the Visual Field Hubel and Wiesel introduced the term hypercolumn to refer to a set of columns responsive to lines of all orientations from a particular region in space. The relationship between the orientation columns, the independent ocular dominance columns, and the blobs within a module is illustrated in Figure 27-17. A complete sequence of ocular dominance columns and orientation columns is repeated regularly and precisely over the surface of the primary visual cortex, each occupying a region of about 1 mm2. This repeating organization is a striking illustration of the modular organization characteristic of the cerebral cortex. Each module acts as a window on the visual field and each window represents only a tiny part of the visual field, but the whole field is covered by many such windows. Within the processing module all information about that part of the visual world is processed. From what we know now, that includes orientation, binocular interaction, color, and motion. Each module has a variety of outputs originating in different cortical layers. The organization of the output connections from the primary visual cortex is similar to that of the somatic sensory cortex in that there are outputs from all layers except 4C, and in each layer the principal output cells are the pyramidal cells (see Figure 27-10C). The axons of cells above layer 4C project to other cortical areas; those of cells below 4C project to subcortical areas. The cells in layers 2 and 3 send their output to other higher visual cortical regions, such as Brodmann's area 18 (V2, V3, and V4). They also make connections via the corpus callosum to anatomically symmetrical cortical areas on the other side of the brain. Cells in layer 4B project to the middle temporal area (V5 or MT). Cells in layer 5 project to the superior colliculus, the pons, and the pulvinar. Cells in layer 6 project back to the lateral geniculate nucleus and to the claustrum. Since cells in each layer of the visual cortex probably perform a different task, the laminar position of a cell determines its functional properties.
- Figure 27-18 Columns of cells in the visual cortex with similar function are linked through horizontal connections. A. A camera lucida reconstruction of a pyramidal cell injected with horseradish peroxidase in layers 2 and 3 in a monkey. Several axon collaterals branch off the descending axon near the dendritic tree and in three other clusters (arrows). The clustered collaterals project vertically into several layers at regular intervals, consistent with the sequence of functional columns of cells. (From McGuire et al. 1991.) B. The horizontal connections of a pyramidal cell, such as that shown in A, are functionally specific. The axon of the pyramidal cell forms synapses on other pyramidal cells in the immediate vicinity as well as pyramidal cells some distance away. Recordings of cell activity demonstrate that the axon makes connections only with cells that have the same functional specificity (in this case, responsiveness to a vertical line). (Adapted from Ts'o et al. 1986.) C. 1. A section of cortex labeled with 2-deoxyglucose shows a pattern of stripes representing columns of cells that respond to a stimulus with a particular orientation. 2. Microbeads injected into the same site as in 1 are taken up by the terminals of neurons and transported to the cell bodies. 3. Superimposition of the images in 1 and 2. The clusters of bead-labeled cells lie directly over the 2-deoxyglucose-labeled areas, showing that groups of cells in different columns with the same axis of orientation are connected. (From Gilbert and Wiesel 1989.) Columnar Units Are Linked by Horizontal Connections As we have seen, three major vertically oriented systems crossing the layers of primary visual cortex have been delineated: (1) orientation columns, which contain the neurons that respond selectively to light bars with specific axes of orientation; (2) blobs, peg-shaped patches in upper layers (but not layer 4) that contain cells that are more concerned with color than orientation; and (3) ocular dominance columns, which receive inputs from one or the other eye. These units are organized into hypercolumns that monitor small areas of the visual field. These vertically oriented systems communicate with one another by means of horizontal connections that link cells within a layer. Axon collaterals of individual pyramidal cells in layers 3 and 5 run long distances, parallel with the layers, and give rise to clusters of axon terminals at regular intervals that approximate the width of a hypercolumn (Figure 27-18A). Horseradish peroxidase injected into focal regions within superficial cortical layers (2, 3) reveals an elaborate lattice of labeled cells and axons that encloses unlabeled patches about 500 μm in diameter. Similarly, tracers injected into sites corresponding to blobs label other blobs, producing a honeycomb image. A honeycomb array also appears after labeling the nonblob cortex. To examine these horizontal connections, recordings were made from pairs of cells in blob regions; each pair was separated by about 1 mm, the distance that typically separates the lattice arrays described above (Figure 27-18B). Many cell pairs were found to fire simultaneously in response to stimuli with a specific orientation and direction of movement. Thus, colorselective cells in one blob are linked to cells with similar responses in other blobs. Additional evidence that horizontal connections tie together cells with similar response properties in different columns comes from injection of radiolabeled 2-deoxyglucose and fluorescently labeled microbeads into a column containing cells that respond to a specific orientation. The beads are taken up by axon terminals at the injection site and transported back to the cell bodies. In sections tangential to the pia the overall pattern of cells labeled with the microbeads closely resembles the lattice described above. In fact, the pattern labeled with 2-deoxyglucose is congruent with the pattern obtained with the microbeads (Figure 27-18C). Thus, both anatomical and metabolic studies establish that cortical cells having receptive fields with the same orientation are connected by means of a horizontal network. The visual cortex, then, is organized functionally into two sets of intersecting connections, one vertical, consisting of functional columns spanning the different cortical layers, and the other horizontal, connecting functional columns with the same response properties. What is the functional importance of the horizontal connections? Recent studies indicate that these connections integrate information over many millimeters of cortex. As a result, a cell can be influenced by stimuli outside its normal receptive field. Indeed, a cell's axis of orientation is not completely invariant but is dependent on the context on which the feature is embedded. The psycho-physical principle of contextual effect , whereby we evaluate objects in the context in which we see them, is thought to be mediated by the horizontal connections between the functional columns of the visual cortex.
- Figure 27-10 The primary visual cortex has distinct anatomical layers, each with characteristic synaptic connections. (Adapted from Lund 1988.) A. Most afferent fibers from the lateral geniculate nucleus terminate in layer 4. The axons of cells in the parvocellular layers ( P ) terminate primarily in layer 4Cβ, with minor inputs to 4A and 1, while the axons of cells in the magnocellular layers ( M ) terminate primarily in layer 4Cα. Collaterals of both types of cells also terminate in layer 6. Cells of the intralaminar regions ( I ) of the lateral geniculate nucleus terminate in the blob regions of layers 2 and 3. B. Several types of neurons make up the primary visual cortex. Spiny stellate and pyramidal cells, both of which have spiny dendrites, are excitatory. Smooth stellate cells are inhibitory. Pyramidal cells project out of the cortex, whereas both types of stellate cells are local neurons. C. Conception of information flow based on anatomical connections. ( LGN = lateral geniculate nucleus; MT = middle temporal area.) Inputs. Axons from M and P cells in the lateral geniculate nucleus end on spiny stellate cells in the sublayers of 4C, and these cells project axons to layer 4B or the upper layers 2 and 3. Axons from cells in the intralaminar zones of the lateral geniculate nucleus project directly to layers 2 and 3. Intracortical connections. Axon collaterals of pyramidal cells in layers 2 and 3 project to layer 5 pyramidal cells, whose axon collaterals project both to layer 6 pyramidal cells and back to cells in layers 2 and 3. Axon collaterals of layer 6 pyramidal cells then make a loop back to layer 4C onto smooth stellate cells. Output. Each layer, except for 4C, has outputs for V1 and each is different. The cells in layers 2, 3, and 4B project to extrastriate visual cortical areas. Cells in layer 5 project to the superior colliculus, the pons, and the pulvinar. Cells in layer 6 project back to the lateral geniculate nucleus and the claustrum. Layered Structure of the Primary Visual Cortex Like almost all other portions of the cerebral cortex, the primary visual cortex has six distinct layers, as shown in Figure 51–4. Also, as is true for the other sensory systems, the geniculocalcarine fibers terminate mainly in layer IV. But this layer, too, is organized into subdivisions.The rapidly conducted signals from the Y retinal ganglion cells terminate in layer IVca, and from there they are relayed vertically both outward toward the cortical surface and inward toward deeper levels. The visual signals from the medium-sized optic nerve fibers, derived from the X ganglion cells in the retina, also terminate in layer IV, but at points different from the Y signals. They terminate in layers IVa and IVcb, the shallowest and deepest portions of layer IV, shown to the right in Figure 51–4. From there, these signals are transmitted vertically both toward the surface of the cortex and to deeper layers. It is these X ganglion pathways that transmit the accurate pointto- point type of vision as well as color vision. Vertical Neuronal Columns in the Visual Cortex. The visual cortex is organized structurally into several million vertical columns of neuronal cells, each column having a diameter of 30 to 50 micrometers. The same vertical columnar organization is found throughout the cerebral cortex for the other senses as well (and also in the motor and analytical cortical regions). Each column represents a functional unit. One can roughly calculate that each of the visual vertical columns has perhaps 1000 or more neurons. After the optic signals terminate in layer IV, they are further processed as they spread both outward and inward along each vertical column unit. This processing is believed to decipher separate bits of visual information at successive stations along the pathway. The signals that pass outward to layers I, II, and III eventually transmit signals for short distances laterally in the cortex. Conversely, the signals that pass inward to layers V and VI excite neurons that transmit signals much greater distances. “ Color Blobs” in the Visual Cortex. Interspersed among the primary visual columns as well as among the columns of some of the secondary visual areas are special column-like areas called color blobs. They receive lateral signals from adjacent visual columns and are activated specifically by color signals. Therefore, it is presumed that these blobs are the primary areas for deciphering color. Interaction of Visual Signals from the Two Separate Eyes. Recall that the visual signals from the two separate eyes are relayed through separate neuronal layers in the lateral geniculate nucleus. These signals still remain separated from each other when they arrive in layer IV of the primary visual cortex. In fact, layer IV is interlaced with stripes of neuronal columns, each stripe about 0.5 millimeter wide; the signals from one eye enter the columns of every other stripe, alternating with signals from the second eye. This cortical area deciphers whether the respective areas of the two visual images from the two separate eyes are “in register” with each other—that is, whether corresponding points from the two retinas fit with each other. In turn, the deciphered information is used to adjust the directional gaze of the separate eyes so that they will fuse with each other (be brought into “register”). The information observed about degree of register of images from the two eyes also allows a person to distinguish the distance of objects by the mechanism of stereopsis. The primary visual cortex in humans is about 2 mm thick and consists of six layers of cells (layers 1-6) between the pial surface and the underlying white matter. The principal layer for inputs from the lateral geniculate nucleus is layer 4, which is further subdivided into four sublayers (sublaminae): 4A, 4B, 4Cα, and 4Cβ. Tracings of resident cells and axonal inputs in the monkey have shown that the M and P cells of the lateral geniculate nucleus terminate in different layers and even in different sublayers. The axons of M cells terminate principally in sublamina 4Cα; the axons of most P cells terminate principally in sublamina 4Cβ (Figure 27- 10A). Thus, the segregation of the parvocellular and magnocellular pathways continues to be maintained at this level of processing. Axons from a third group of cells, located in the intralaminar region of the lateral geniculate nucleus, terminate in layers 2 and 3, where they innervate patches of cells called blobs , a functional grouping that we shall discuss below. These intralaminar cells probably receive their retinal inputs primarily from ganglion cells other than those providing inputs to the M and P cells. These cells might therefore represent another pathway in parallel to the P and M pathways from the retina to the visual cortex, but little is now known about their function. As we have seen in Chapter 17, the cortex contains two basic classes of cells. Pyramidal cells are large and have long spiny dendrites; they are projection neurons whose axons project to other brain regions as well as interconnecting neurons in local areas. Nonpyramidal cells are small and stellate in shape and have dendrites that are either spiny (spiny stellate cells) or smooth (smooth stellates). They are local interneurons whose axons are confined to the primary visual cortex (Figure 27-10B). The pyramidal and spiny stellate cells are excitatory and many use glutamate or aspartate as their transmitters; the smooth stellate cells are inhibitory and many contain γ-aminobutyric acid (GABA). Once afferents from the lateral geniculate nucleus enter the primary visual cortex, information flows systematically from one cortical layer to another, starting with the spiny stellate cells, which predominate in layer 4. The spiny stellate cells distribute the input from the lateral geniculate nucleus to the cortex and the pyramidal cells feed axon collaterals upward and downward to integrate activity within the layers of V1 (Figure 27-10C).
- Figure 28-1 Organization of V1 and V2. A. Subregions in V1 (area 17) and V2 (area 18). This section from the occipital lobe of a squirrel monkey at the border of areas 17 and 18 was reacted with cytochrome oxidase. The cytochrome oxidase stains the blobs in V1 and the thick and thin stripes in V2. (Courtesy of M. Livingstone.) B. Connections between V1 and V2. The blobs in V1 connect primarily to the thin stripes in V2, while the interblobs in V1 connect to interstripes in V2. Layer 4B projects to the thick stripes in V2 and to the middle temporal area ( MT ). Both thin and interstripes project to V4. Thick stripes in V2 also project to MT. The Parvocellular and Magnocellular Pathways Feed Into Two Processing Pathways in Extrastriate Cortex In Chapter 27 we saw that the parallel parvocellular and magnocellular pathways remain segregated even in the striate cortex. What happens to these P and M pathways beyond the striate cortex? Early research on these pathways indicated that the P pathway continues in the ventral cortical pathway that extends to the inferior temporal cortex, and that the M pathway becomes the dorsal pathway that extends to the posterior parietal cortex. However, the actual relationships are probably not so exclusive. The evidence for separation of function of the dorsal and ventral pathways begins in the primary visual, or striate, cortex (V1). Staining for the mitochondrial enzyme cytochrome oxidase reveals a precise and repeating pattern of dark, peg-like regions about 0.2 mm in diameter called blobs. The blobs are especially prominent in the superficial layers 2 and 3, where they are separated by intervening regions that stain lighter, the interblob regions. The same stain also reveals alternating thick and thin stripes separated by interstripes of little activity (Figure 28-1 in the secondary visual cortex, or V2).
- Figure 28-2 The magnocellular (M) and parvocellular (P) pathways from the retina project through the lateral geniculate nucleus (LGN) to V1. Separate pathways to the temporal and parietal cortices course through the extrastriate cortex beginning in V2. The connections shown in the figure are based on established anatomical connections, but only selected connections are shown and many cortical areas are omitted (compare Figure 25- 9). Note the cross connections between the two pathways in several cortical areas. The parietal pathway receives input from the M pathway but only the temporal pathway receives input from both the M and P pathways. (Abbreviations: AIT = anterior inferior temporal area; CIT = central inferior temporal area; LIP = lateral intraparietal area; Magno = magnocellular layers of the lateral geniculate nucleus; MST = medial superior temporal area; MT = middle temporal area; Parvo = parvocellular layers of the lateral geniculate nucleus; PIT = posterior inferior temporal area; VIP = ventral intraparietal area.) (Based on Merigan and Maunsell 1993.) Margaret Livingstone and David Hubel identified the anatomical connections between labeled regions in V1 and V2 (Figure 28-1B). They found that the P and M pathways remain partially segregated through V2. The M pathway projects from the magnocellular layers of the lateral geniculate nucleus to the striate cortex, first to layer 4Cα and then to layer 4B. Cells in layer 4B project directly to the middle temporal area (MT) and also to the thick stripes in V2, from which cells also project to MT. Thus, a clear anatomical pathway exists from the magnocellular layers in the lateral geniculate nucleus to MT and from there to the posterior parietal cortex (Figure 28-2). Cells in the parvocellular layers of the lateral geniculate nucleus project to layer 4Cβ in the striate cortex, from which cells project to the blobs and interblobs of V1. The blobs send a strong projection to the thin stripes in V2, whereas interblobs send a strong projection to the interstripes in V2. The thin stripe and interstripe areas of V2 may in turn project to discrete subregions of V4, thus maintaining this separation in the P pathway into V4 and possibly on into the inferior temporal cortex. A pathway from the P cells in the lateral geniculate nucleus to the inferior temporal cortex can therefore also be identified (Figure 28-2). But are these pathways exclusive of each other? Several anatomical observations suggest that they are not. In V1 both the magnocellular and parvocellular pathways have inputs in the blobs, and local neurons make extensive connections between the blob and interblob compartments. In V2 cross connections exist between the stripe compartments. Thus, the separation is not absolute, but whether there is an intermixing of the M and P contributions or whether the cross connections allow one cortical pathway to modulate activity in the other is not clear. Results of experiments that selectively inactivate the P and M pathways as they pass through the lateral geniculate nucleus (described in Chapter 27) also erode the notion of strict segregation between the pathways in V1. Blocking of either pathway affects the responses of fewer than half the neurons in V1, which indicates that most V1 neurons receive physiologically effective inputs from both pathways. Further work has shown that the responses of neurons both within and outside of the blobs in the superficial layers of V1 are altered by blocking only the M pathway. Both observations suggest that there is incomplete segregation of the M and P pathways in V1. This selective blocking of the P and M pathways also reveals the relative contributions of the pathways to the parietal and inferior temporal cortices. Blocking the magnocellular layers of the lateral geniculate nucleus eliminates the responses of many cells in MT and always reduces the responses of the remaining cells; blocking the parvocellular layers produces a much weaker effect on cells in MT. In contrast, blocking the activity of either the parvocellular or magnocellular layers in the lateral geniculate nucleus reduces the activity of neurons in V4. Thus, the dorsal pathway to MT seems primarily to include input from the M pathway, whereas the ventral pathway to the inferior temporal cortex appears to include input from both the M and P pathways. We can now see that there is substantial segregation of the P and M pathways up to V1, probably separation into V2, a likely predominance of the M input to the dorsal pathway to MT and the parietal cortex, and a mixture of P and M input into the pathway leading to the inferior temporal lobe (as indicated by the lines crossing between the pathways in Figure 28-2). What should we conclude about the organization of visual processing throughout the multiple areas of the visual cortex? First, we know that there are specific serial pathways through the multiple visual areas, not just a random assortment of equally connected areas. There is substantial evidence for two major processing pathways, a dorsal one to the posterior parietal cortex and a ventral one to the inferior temporal cortex, but other pathways may also exist. Second, there is strong evidence that the processing in these two cortical pathways is hierarchical. Each level has strong projections to the next level (and projections back), and the type of visual processing changes systematically from one level to the next. Third, the functions of cortical areas in the two cortical pathways are strikingly different, as judged both by the anatomical connections and the cellular activity considered in this chapter and by the behavioral and brain imaging evidence discussed in Chapter 25. Our examination of the functional organization within these vast regions of extrastriate visual cortex begins with the dorsal cortical pathway and the most intensively studied visual attribute, motion. We then examine the processing of depth information in the dorsal pathway. Finally, we turn to the ventral cortical pathway and consider the processing of information related to form. Color vision is the subject of the next chapter.
- THE VARIOUS VISUAL CORTEXES Following the groundbreaking studies published by Leslie Ungerleider and Mortimer Mishkin in 1982, scientists distinguished two major pathways for the cortical processing of visual information: the ventral visual pathway, for identifying objects, and the dorsal visual pathway, for determining their position in space. Various subsequent studies, however, have raised some questions about this dichotomy. Some of these studies have involved making selective lesions in each of these pathways in monkeys. Others have involved observing humans who had suffered brain injuries that affected only one of these pathways (see sidebars). Today it is believed that the main function of the dorsal visual pathway is to guide in real time the actions that we direct at objects in the visual world. Most of the processing done by this pathway is believed to be unconscious. The dorsal pathway could thus be described as an "action pathway", because by integrating the spatial relationships between our bodies and our environment, it lets us interact with this environment effectively. The ventral visual pathway , on the other hand, seems to be involved in forming conscious representations of the identity of objects. Thus, in addition to the functional dichotomy between the dorsal and visual pathways, there would appear to be another dichotomy, between unconscious and conscious vision. The dorsal pathway comprises several cortical areas, including the medial temporal area (MT or V5), the medial superior temporal area (MST), and the ventral and lateral intraparietal areas (VIP and LIP). Area V5 (or MT) seems to contribute significantly to the perception of movement. This area receives projections from V2 and V3. It also receives projections from layer IV B in the primary visual area (V1) —a layer that, interestingly enough, is part of the magnocellular channel involved in analyzing the movement of objects. This channel also maintains its specificity for movement in area V2, where it is concentrated in the thick stripes that contain large amounts of cytochrome oxydase.
- Figure 28-3 Motion in the visual field can be perceived in two ways. A. When the eyes are held still, the image of a moving object traverses the retina. Information about movement depends upon sequential firing of receptors in the retina. B. When the eyes follow an object, the image of the moving object falls on one place on the retina and the information is conveyed by movement of the eyes or the head. Motion Is Analyzed Primarily in the Dorsal Pathway to the Parietal Cortex We usually think of motion as an object moving in the visual field, a car or a tennis ball, and we easily distinguish these moving objects from the stationary background. However, we often see objects in motion not because they move on our retina, but because we track them with eye movements; the image remains stationary on the retina but we perceive movement because our eyes move (Figure 28-3). Motion in the visual field is detected by comparing the position of images recorded at different times. Since most cells in the visual system are exquisitely sensitive to retinal position and can resolve events separated in time by 10 to 20 milliseconds, most cells in the visual system should, in principle, be able to extract information about motion from the position of the image on the retina by comparing the previous location of an object with its current location. What then is the evidence for a special neural subsystem specialized for motion?
- Figure 28-4 The illusion of apparent motion is evidence that the visual system analyzes motion in a separate pathway. A. Actual motion is experienced as a sequence of visual sensations, each resulting from the image falling on a different position in the retina. B. Apparent motion may actually be more convincing than actual motion, and is the perceptual basis for motion pictures. Thus, when two lights at positions 1 and 2 are turned on and off at suitable intervals, we perceive a single light moving between the two points. This perceptual illusion cannot be explained by processing of information based on different retinal positions and is therefore evidence for the existence of a special visual system for the detection of motion. (From Hochberg 1978.) The initial evidence for a special mechanism designed to detect motion independent of retinal position came from psychophysical observations on apparent motion , an illusion of motion that occurs when lights separated in space are turned on and off at appropriate intervals (Figure 28-4). The perception of motion of objects that in fact have not changed position suggests that position and motion are signaled by separate pathways.
- Figure 28-5 Separate human brain areas are activated by motion and color. Motion studies. Six subjects viewed a black and white random-dot pattern that moved in one of eight directions or remained stationary. The figure shows the effect of motion because the PET scans taken while the pattern was stationary were subtracted from those taken while the pattern was moving. The white and red areas show the high end of activity (increased blood flow). The areas are located on the convexity of the prestriate cortex at the junction of Brodmann's areas 19 and 37. Color studies. The subjects viewed a collage of 15 squares and rectangles of different colors or, alternatively, the same patterns in gray shades only. The figure shows the difference in blood flow while viewing the color and gray patterns. The area showing increased flow, subserving the perception of color, is located inferiorly and medially in the occipital cortex. (From Zeki et al. 1991). Motion Is Represented in the Middle Temporal Area Experiments on monkeys show that neurons in the retina and lateral geniculate nucleus, as well as many areas in the striate and extrastriate cortex, respond very well to a spot of light moving across their receptive fields. In area V1, however, cells respond to motion in one direction, while motion in the opposite direction has little or no effect on them. This directional selectivity is prominent among cells in layer 4B of the striate cortex. Thus, cells in the M pathway provide input to cells in 4B, but these input cells themselves do not show directional selectivity. They simply provide the raw input for the directionally selective cortical cells. In monkeys one area at the edge of the parietal cortex, the middle temporal area (MT), appears to be devoted to motion processing because almost all of the cells are directionally selective and the activity of only a small fraction of these cells is substantially altered by the shape or the color of the moving stimulus. Like V1, MT has a retinotopic map of the contralateral visual field, but the receptive fields of cells within this map are about 10 times wider than those of cells in the striate cortex. Cells with similar directional specificity are organized into vertical columns running from the surface of the cortex to the white matter. Each part of the visual field is represented by a set of columns in which cells respond to different directions of motion in that part of the visual field. This columnar organization is similar to that seen in V1. Cells in MT respond to motion of spots or bars of light by detecting contrasts in luminance. Some cells in MT also respond to moving forms that are not defined by differences in luminance but by differences only in texture or color. While these cells are not selective for color itself, they nonetheless detect motion by responding to an edge defined by color. Thus, even though MT and the dorsal pathway to the parietal cortex may be devoted to the analysis of motion, the cells are sensitive to stimuli (color) that were thought to be analyzed primarily by cells in the ventral pathway. Stimulus information on motion, form, and color therefore is not processed exclusively in separate functional pathways. This description of motion processing is based on research on the MT area in monkeys. In the human brain an area devoted to motion has been identified at the junction of the parietal, temporal, and occipital cortices. Figure 28-5 shows changes in blood flow in this area in PET scans made while the subject viewed a pattern of dots in motion. A cortical area adjacent to MT, the medial superior temporal area (MST), also has neurons that are responsive to visual motion and these neurons may process a type of global motion in the visual field called optic flow, which is important for a person's own movements through an environment (Box 28-1). Box 28-1 Optic Flow Optic flow refers to the perceived motion of the visual field that results from an individual's own movement through the environment. With optic flow the entire visual field moves, in contrast to the local motion of objects. Optic flow provides two types of cues: information about the organization of the environment (near objects will move faster than more distant objects) and information about the control of posture (side-to-side patterns induce body sway). Particularly influential in the development of ideas about optic flow was the demonstration by the experimental psychologist James J. Gibson that optic flow is critical for indicating the direction of observer movement (“heading”). For example, when an individual moves forward with eyes and head directed straight ahead, optic flow expands outward from a point straight ahead in the visual field, a pattern that is frequently used in movies to show space ship flight. Where is optic flow represented in the brain? Neurons in one region of the medial superior temporal area of the parietal cortex in monkeys respond in ways that would make these cells ideal candidates to analyze optic flow. These neurons respond selectively to motion, have receptive fields that cover large parts of the visual field, and respond preferentially to large field motion in the visual field. Additionally, the neurons are sensitive to shifts in the origin of full-field motion and to differences in speed between the center and periphery of the field. The neurons also receive input related to eye movement, which is particularly significant because forward movement is typically accompanied by eye and head movement. Finally, electrical stimulation of this area alters the ability of the monkey to locate the point of origin of field motion, providing further evidence that the superior temporal area of the parietal cortex is important for optic flow. Figure 28-1 Organization of V1 and V2. A. Subregions in V1 (area 17) and V2 (area 18). This section from the occipital lobe of a squirrel monkey at the border of areas 17 and 18 was reacted with cytochrome oxidase. The cytochrome oxidase stains the blobs in V1 and the thick and thin stripes in V2. (Courtesy of M. Livingstone.) B. Connections between V1 and V2. The blobs in V1 connect primarily to the thin stripes in V2, while the interblobs in V1 connect to interstripes in V2. Layer 4B projects to the thick stripes in V2 and to the middle temporal area ( MT ). Both thin and interstripes project to V4. Thick stripes in V2 also project to MT. The Parvocellular and Magnocellular Pathways Feed Into Two Processing Pathways in Extrastriate Cortex In Chapter 27 we saw that the parallel parvocellular and magnocellular pathways remain segregated even in the striate cortex. What happens to these P and M pathways beyond the striate cortex? Early research on these pathways indicated that the P pathway continues in the ventral cortical pathway that extends to the inferior temporal cortex, and that the M pathway becomes the dorsal pathway that extends to the posterior parietal cortex. However, the actual relationships are probably not so exclusive. The evidence for separation of function of the dorsal and ventral pathways begins in the primary visual, or striate, cortex (V1). Staining for the mitochondrial enzyme cytochrome oxidase reveals a precise and repeating pattern of dark, peg-like regions about 0.2 mm in diameter called blobs. The blobs are especially prominent in the superficial layers 2 and 3, where they are separated by intervening regions that stain lighter, the interblob regions. The same stain also reveals alternating thick and thin stripes separated by interstripes of little activity (Figure 28-1 in the secondary visual cortex, or V2).
- Figure 28-5 Separate human brain areas are activated by motion and color. Motion studies. Six subjects viewed a black and white random-dot pattern that moved in one of eight directions or remained stationary. The figure shows the effect of motion because the PET scans taken while the pattern was stationary were subtracted from those taken while the pattern was moving. The white and red areas show the high end of activity (increased blood flow). The areas are located on the convexity of the prestriate cortex at the junction of Brodmann's areas 19 and 37. Color studies. The subjects viewed a collage of 15 squares and rectangles of different colors or, alternatively, the same patterns in gray shades only. The figure shows the difference in blood flow while viewing the color and gray patterns. The area showing increased flow, subserving the perception of color, is located inferiorly and medially in the occipital cortex. (From Zeki et al. 1991). Motion Is Represented in the Middle Temporal Area Experiments on monkeys show that neurons in the retina and lateral geniculate nucleus, as well as many areas in the striate and extrastriate cortex, respond very well to a spot of light moving across their receptive fields. In area V1, however, cells respond to motion in one direction, while motion in the opposite direction has little or no effect on them. This directional selectivity is prominent among cells in layer 4B of the striate cortex. Thus, cells in the M pathway provide input to cells in 4B, but these input cells themselves do not show directional selectivity. They simply provide the raw input for the directionally selective cortical cells. In monkeys one area at the edge of the parietal cortex, the middle temporal area (MT), appears to be devoted to motion processing because almost all of the cells are directionally selective and the activity of only a small fraction of these cells is substantially altered by the shape or the color of the moving stimulus. Like V1, MT has a retinotopic map of the contralateral visual field, but the receptive fields of cells within this map are about 10 times wider than those of cells in the striate cortex. Cells with similar directional specificity are organized into vertical columns running from the surface of the cortex to the white matter. Each part of the visual field is represented by a set of columns in which cells respond to different directions of motion in that part of the visual field. This columnar organization is similar to that seen in V1. Cells in MT respond to motion of spots or bars of light by detecting contrasts in luminance. Some cells in MT also respond to moving forms that are not defined by differences in luminance but by differences only in texture or color. While these cells are not selective for color itself, they nonetheless detect motion by responding to an edge defined by color. Thus, even though MT and the dorsal pathway to the parietal cortex may be devoted to the analysis of motion, the cells are sensitive to stimuli (color) that were thought to be analyzed primarily by cells in the ventral pathway. Stimulus information on motion, form, and color therefore is not processed exclusively in separate functional pathways. This description of motion processing is based on research on the MT area in monkeys. In the human brain an area devoted to motion has been identified at the junction of the parietal, temporal, and occipital cortices. Figure 28-5 shows changes in blood flow in this area in PET scans made while the subject viewed a pattern of dots in motion. A cortical area adjacent to MT, the medial superior temporal area (MST), also has neurons that are responsive to visual motion and these neurons may process a type of global motion in the visual field called optic flow, which is important for a person's own movements through an environment (Box 28-1). Box 28-1 Optic Flow Optic flow refers to the perceived motion of the visual field that results from an individual's own movement through the environment. With optic flow the entire visual field moves, in contrast to the local motion of objects. Optic flow provides two types of cues: information about the organization of the environment (near objects will move faster than more distant objects) and information about the control of posture (side-to-side patterns induce body sway). Particularly influential in the development of ideas about optic flow was the demonstration by the experimental psychologist James J. Gibson that optic flow is critical for indicating the direction of observer movement (“heading”). For example, when an individual moves forward with eyes and head directed straight ahead, optic flow expands outward from a point straight ahead in the visual field, a pattern that is frequently used in movies to show space ship flight. Where is optic flow represented in the brain? Neurons in one region of the medial superior temporal area of the parietal cortex in monkeys respond in ways that would make these cells ideal candidates to analyze optic flow. These neurons respond selectively to motion, have receptive fields that cover large parts of the visual field, and respond preferentially to large field motion in the visual field. Additionally, the neurons are sensitive to shifts in the origin of full-field motion and to differences in speed between the center and periphery of the field. The neurons also receive input related to eye movement, which is particularly significant because forward movement is typically accompanied by eye and head movement. Finally, electrical stimulation of this area alters the ability of the monkey to locate the point of origin of field motion, providing further evidence that the superior temporal area of the parietal cortex is important for optic flow.
- Figure 28-9 A monkey with an MT lesion and a human patient with damage to extrastriate visual cortex have similar deficits in motion perception. A. Displays used to study the perception of motion. In the display on the left there is no correlation between the directions of movement of several dots, and thus no net motion in the display. In the display on the right all the dots move in the same direction (100% correlation). An intermediate case is in the center; 50% of the dots move in the same direction while the other 50% move in random directions (essentially noise added to the signal). (From Newsome and Pare 1988.) B. The performance of a monkey before and after an MT lesion ( left ). The performance of a human subject with bilateral brain damage is compared to two normal subjects ( right ). The ordinate of the graph shows the percent correlation in the directions of all moving dots (as in part A) required for the monkey to pick out the one common direction. The abscissa indicates the size of the displacement of the dot and thus the degree of apparent motion. Note the general similarity between the performance of the humans and that of the monkey and the devastation to this performance after the cortical lesions. (From Newsome and Pare 1988, Control of Movement Is Selectively Impaired by Lesions of MT These correlations of neuronal activity and visual perception raise the question, Is the activity of direction-selective cells in MT causally related to the visual perception of motion and the control of motion-dependent movement? The question whether direction-selective cells in MT directly affect the control of movement was first addressed in an experiment that examined the relationship of these cells to smooth-pursuit eye movements, the movements that keep a moving target in the fovea (see Figure 28-3). When discrete focal chemical lesions were made within different regions of the retinotopic map in MT of a monkey, the speed of the moving target could no longer be estimated correctly in the region of the visual field monitored by the damaged MT area. In contrast, the lesions did not affect pursuit of targets in other regions of the visual field nor did they affect eye movements to stationary targets. Thus, visual processing in MT is selective for motion of the visual stimulus; lesions produce a blind spot, or a scotoma, for motion. Human patients with lesions of parietal cortex also sometimes have these deficits in smooth pursuit eye movements, but the most frequent behavioral deficit is quite different from that seen after lesions of MT. The neurologist Gordon Holmes originally reported that these patients were unable to follow a target when it was moving toward the side of the brain that had the lesion. For example, a patient with a lesioned right hemisphere has difficulty pursuing a target moving toward the right (Figure 28-8B). Later experiments on monkeys showed that lesions centered on the medial superior temporal area (MST), the next level of processing for visual motion, produced just such a deficit (Figure 28-8A). Perception of Motion Is Altered by Lesions and Microstimulation of MT The question whether MT cells contribute to the perception of visual motion was addressed in an experiment in which monkeys were trained to report the direction of motion in a display of moving dots. The experimenter varied the proportion of dots that moved in the same direction random and at 100% correlation the motion of all dots was in one direction (Figure 28-9A). While normal monkeys could perform the task with less than 10% of the dots moving in the same direction, monkeys with a lesion in MT required nearly 100% coherence to perform as well (Figure 28-9B). A human patient with bilateral brain damage also lost the perception of motion when tested on the same task (Figure 28-9B). In both the monkeys and the human subject, visual acuity for stationary stimuli was not affected by the brain damage. Thus damage to MT reduces the ability of monkeys to detect motion in the visual field, as indicated by disruptions in the pursuit of moving objects and perception of the direction of motion. However, monkeys with MT lesions quickly recover these functions. Directionally selective cells in other areas of cerebral cortex, such as MST, apparently can take over the function performed by MT. Recovery of function is greatly slowed when the lesion affects not only MT but also MST and other extrastriate areas.
- Figure 28-11 Monocular depth cues provide information on the relative distance of objects and have been used by painters since antiquity. A. The upper drawing shows the side view of a scene. When the scene is traced on a plane of glass held between the eye and the scene (lower drawing) the resulting two-dimensional tracing reveals the cues needed to perceive depth. Occlusion: The fact that rectangle 4 interrupts the outline of 5 indicates which object is in front, but not how much distance there is between them. Linear perspective: Although lines 6-7 and 8-9 are parallel in reality, they converge in the picture plane. Size perspective: Because the two boys are similiar figures, the smaller boy (2) is assumed to be more distant than the larger boy (1) in the picture plane. Familiar size: The man (3) and the nearest boy are drawn to nearly the same size in the picture. If we know that the man is taller than the boy, we deduce on the basis of their sizes in the picture that the man is more distant than the boy. This type of cue is weaker than the others. (Adapted from Hochberg 1968.) B. Motion of the observer or sideways movement of head and eyes produces depth cues. If the observer moves to the left while looking at the tree, objects closer than the tree move to the right; those farther away move to the left. The full-field motion that results from the observer's own movement is referred to as optic flow. (see Box 28-1.) (Adapted from Busettini et al. 1996). Depth Vision Depends on Monocular Cues and Binocular Disparity One of the major tasks of the visual system is to convert a two-dimensional retinal image into three dimensions. How is this transformation achieved? How do we tell how far one thing is from another? How do we estimate the relative depth of a three-dimensional object in the visual field? Psychophysical studies indicate that the shift from two to three dimensions relies on two types of clues: monocular cues for depth and stereoscopic cues for binocular disparity. Monocular Cues Create Far-Field Depth Perception At distances greater than about 100 feet the retinal images seen by each eye are almost identical, so that looking at a distance we are essentially one-eyed. Nevertheless we can perceive depth with one eye by relying on a variety of tricks called monocular depth cues. Several of these monocular cues were appreciated by the artists of antiquity, rediscovered during the Renaissance, and codified early in the sixteenth century by Leonardo da Vinci. ● Familiar size. If we know from experience something about the size of a person, we can judge the person's distance (Figure 28-11A). ● Occlusion. If one person is partly hiding another person, we assume the person in front is closer (Figure 28-11A). ● Linear perspective Parallel lines, such as those of a railroad track, appear to converge with distance. The greater the convergence of lines, the greater is the impression of distance. The visual system interprets the convergence as depth by assuming that parallel lines remain parallel (Figure 28-11A). ● Size perspective If two similar objects appear different in size, the smaller is assumed to be more distant (Figure 28-11A). ● Distribution of shadows and illumination Patterns of light and dark can give the impression of depth. For example, brighter shades of colors tend to be seen as nearer. In painting this distribution of light and shadow is called chiaroscuro. ● Motion (or monocular movement) parallax. Perhaps the most important of the monocular cues, this is not a static pictorial cue and therefore does not come to us from the study of painting. As we move our heads or bodies from side to side, the images projected by an object in the visual field move across the retina. Objects closer than the object we are looking at seem to move quickly and in the direction opposite to our own movement, whereas more distant objects move more slowly and in the same direction as our movement (Figure 28-11B).
- Figure 28-13 Neuronal basis of stereoscopic vision. (Adapted from Ohzawa et al. 1996.) A. When an observer looks at point P the image P′ falls on corresponding points on the retina of each eye. These images completely overlap and therefore have zero binocular disparity. When looking at a point to the left and closer, point Q, the image Q′ in the left eye falls on the same point as P′, but the image in the right eye is laterally displaced. These images have binocular disparity. B. A cortical neuron receiving binocular inputs is maximally activated when the inputs from the two eyes have zero disparity as at P′. C. Another cortical neuron receiving binocular inputs responds best when the inputs from the two eyes are spatially disparate on the two retinas (Q′); it is most sensitive to near stimuli. Information From the Two Eyes Is First Combined in the Primary Visual Cortex How is stereopsis accomplished? Clearly the brain must somehow calculate the disparity between the images seen by the two eyes and then estimate distance based on simple geometric relations. However, this cannot occur before information from the two eyes comes together, and cells in the primary visual cortex (V1) are the first in the visual system to receive input from the two eyes (Chapter 27). Stereopsis, however, requires that the inputs from the two eyes be slightly different —there must be a horizontal disparity in the two retinal images (Figure 28- 13). The important finding that certain neurons in V1 are actually selective for horizontal disparity was made in 1968 by Horace Barlow, Colin Blakemore, Peter Bishop, and Jack Pettigrew. They foundth at a neuron that prefers an oriented bar of light at one place in the visual field responds better when that stimulus appears in front of the screen (referred to as a near stimulus) or when the stimulus is beyond the screen (a far stimulus). There is thus an additional level of organization of information in the ocular dominance columns in V1. Cells sensitive to binocular disparity are found in several cortical visual areas. In addition to V1, some cells in the extrastriate areas V2 and V3 respond to disparity, and many directionselective cells in MT respond best to stimuli at specific distances, either at the plane of fixation or nearer or farther than the plane. Some cells in MST, the next step in the parietal pathway, fire in response to combinations of disparity and direction of motion. That is, the direction of motion preferred by the cell varies with the disparity of the stimulus. For example, a cell that responds to leftward-moving far stimuli might also respond to rightward-moving near stimuli. These cells can convey information not only about the direction of motion but about the direction of motion at different depths within the visual field (as in Figure 28-11B). Studies of cells in the striate and extrastriate cortex that respond selectively to binocular disparity fall into several broad categories. Among these, tuned cells respond best to stimuli at a specific disparity, frequently on the plane of fixation. Other cells respond best to stimuli at a range of disparities either in front of the fixation plane (“near cells”) or beyond the plane (“far cells”) (Figure 28-14) Just as the motion information processed in MT is used both for the visual guidance of movement and for visual perception, disparity-sensitive cells in different regions of visual cortex may use disparity information for different purposes. One use is the perception of depth, which we have already considered. Another is in aligning the eyes to focus at a particular depth in the field. The eyes rotate toward each other (convergence) to focus on near objects and rotate apart (divergence) to focus on more distant objects. The ability to align the eyes develops in the first few months of life and disparity information may play a key role in establishing this alignment. “ Fusion” of the Visual Images from the Two Eyes To make the visual perceptions more meaningful, the visual images in the two eyes normally fuse with each other on “corresponding points” of the two retinas. The visual cortex plays an important role in fusion. It was pointed out earlier in the chapter that corresponding points of the two retinas transmit visual signals to different neuronal layers of the lateral geniculate body, and these signals in turn are relayed to parallel neurons in the visual cortex. Interactions occur between these cortical neurons to cause interference excitation in specific neurons when the two visual images are not “in register”—that is, are not precisely “fused.” This excitation presumably provides the signal that is transmitted to the oculomotor apparatus to cause convergence or divergence or rotation of the eyes so that fusion can be re-established. Once the corresponding points of the two retinas are in register, excitation of the specific “interference” neurons in the visual cortex disappears. Neural Mechanism of Stereopsis for Judging Distances of Visual Objects In Chapter 49, it is pointed out that because the two eyes are more than 2 inches apart, the images on the two retinas are not exactly the same. That is, the right eye sees a little more of the right-hand side of the object, and the left eye a little more of the left-hand side, and the closer the object, the greater the disparity. Therefore, even when the two eyes are fused with each other, it is still impossible for all corresponding points in the two visual images to be exactly in register at the same time. Furthermore, the nearer the object is to the eyes, the less the degree of register. This degree of nonregister provides the neural mechanism for stereopsis, an important mechanism for judging the distances of visual objects up to about 200 feet (60 meters). The neuronal cellular mechanism for stereopsis is based on the fact that some of the fiber pathways from the retinas to the visual cortex stray 1 to 2 degrees on each side of the central pathway.Therefore, some optic pathways from the two eyes are exactly in register for objects 2 meters away; still another set of pathways is in register for objects 25 meters away. Thus, the distance is determined by which set or sets of pathways are excited by nonregister or register. This phenomenon is called depth perception, which is another name for stereopsis.
- The basic function of the ventral visual pathway seems to be to let us consiously perceive, recognize, and identify objects by processing their "intrinsic" visual properties, such as shape and colour. The basic function of the dorsal visual pathway seems to be to let us exercise visual-motor control over objects by processing their "extrinsic" properties—the ones that are critical for handling them, such as their size or their position and orientation in space. In the cortical areas that contribute to the ventral system , increasingly complex, specialized representations of the outside world are elaborated. Area V3 receives major connections from area V2 and sends projections to areas MT and V4. Many of the neurons in area V3 have properties similar to those in V2. For example, most of them are selective for orientation. But much remains unknown about area V3, and it also has some cells with more complex properties. For example, some of these cells are sensitive to colour and movement, traits more commonly analyzed in subsequent stages of visual signal processing in the brain. After passing through areas V1, V2, and V3, part of the visual information continues ventrally to area V4 on its way to the temporal cortex. Area V4 receives information from the blobs and interblobs of the striate cortex , via a relay in V2. Like the cells in all of the other visual areas besides V1 (also known as the "extrastriate areas"), the cells in area V4 have larger receptive fields than those of the striate cortex. Also, the receptive fields of V4 are often sensitive to both colour and orientation. The exact role of area V4 is still under debate, but it is probably involved in recognizing shapes, and it appears to be essential for perceiving colours. Area IT gets its name from the inferotemporal cortex, where it is located, and comprises areas TEO and TE. The cells of area IT receive many connections from area V4 and respond to a very wide range of colours and simple geometric shapes. These cells appear to play an important role in visual memory, in addition to being a key locus for object recognition. Neurons have been found in area IT that respond specifically to images of faces. Initially discovered through intracellular recordings in monkeys, the existence of these cells has been confirmed in human beings through functional magnetic resonance imaging (MRI) studies. This discovery is of some interest to neuropsychologists, who have long known of a rare syndrome called prosopagnosia, in which patients have difficulty in recognizing faces, even though the rest of their vision is normal. This syndrome appears following lesions to the extrastriate areas of the visual cortex, which strongly suggests that these neurons in area IT may be involved.
- It has therefore been suggested that the segregation between the magnocellular and parvocellular signals persists up to the highest levels of visual analysis. The marked functional difference between the ventral and dorsal pathways might also be attributed to a preferential contribution from the P-IB channel in the former case and from the M channel in the latter. For the cells in area MT, the movement of an object seems more important than its nature—so much more, that this area of the cortex is organized into columns that code for the orientation of the movement, just like the line-orientation columns in V1 . Some cells in area MT even seem to respond not to the actual direction of movement, but rather the perceived direction. For example, two groups of illuminated lines, each moving at 45 degrees to either side of the vertical, will give the impression of a vertical movement as they intersect. In area V1, the cells that have a preference for 45-degree angles will respond best to this kind of stimulus. But in area MT, many cells that normally show a selectivity for vertical directions will respond convincingly to two stimuli moving at 45 degrees—in other words, to the apparent direction of movement. Beyond area MT, there are other areas involved in analyzing movement, such as area MST . The cells in this area are sensitive not only to linear motion, like the cells in area MT, but also to radial motion (to or away from a point) and circular motion (clockwise or counter-clockwise). They are also selectively activated by complex configurations of movements, such as occur in your surroundings as you walk through them. Certain neurons in the superior temporal polysensory area (STP) even respond selectively to biological movements that may have proven essential for individual survival , such as by recognizing a member of the same species from the way that he or she walks. Your brain may use this large volume of movement-related data gathered by the dorsal pathway for many purposes: to extract relevant information about the objects flowing across your field of vision as you move, in order to guide your movements; to orient your eye movements; or to identify moving objects around you that have implications for your survival. In 1983, Joseph Zihl and his collaborators published an article in Munich about a 43-year-old woman who had become totally incapable of perceiving movement, following a stroke that had damaged both sides of area V5, the part of the extrastriate cortex that is involved in recognizing movement. This patient was thus suffering from the strange syndrome known as akinetopsia , or motion blindness . For several seconds at a time, she would see nothing but a still image and have no conscious awareness of any movements in her environment. Crossing the street, for example, was very dangerous for her, because a car that she had last seen "stopped" a good distance away might suddenly appear right on top of her after she had begun to cross. Pouring a glass of water could be almost as big a problem. Since she saw the water as frozen in space rather than flowing, she could not tell that she had overfilled the glass until she suddenly saw a puddle of water on the table.