SlideShare une entreprise Scribd logo
1  sur  24
Télécharger pour lire hors ligne
HORSES IN CANADA IN 2010
 HORSES IN CANADA IN 2010 …… HIGHLIGHTS

         Estimated 963,500 horses in Canada in summer 2010, owned by members of
         226,500 horse owning households
         From 886,500 horses in Canada in 1998, the national herd increased to a
         peak of 1,092,461 horses in 2005.
         The 963,500 horses in Canada in 2010, are resident on 145,000 properties
         (premises)
         There is a significant level of inventory in the herd. It is reported that 23% of
         horses in Canada are young horses, not yet in use for their intended market
         segment
         The mature horses in the herd –– approximately 744,000 horses –– are primarily
         in use for sport competition (18% of horses), pleasure riding (18% of horses),
         and the breeding sector (18% of horses).


2. HORSES IN CANADA IN 2010
One of the key challenges in the development of an equine sector profile is
calculating an estimate of the equine herd size for a specific point in time. A regular
Census of Agriculture is completed in Canada (by Statistics Canada) on a five year
cycle, which provides reliable data on the number for horses resident on agricultural
properties defined as Census Farms on the specific Census Day. The last such Census
of Agriculture was completed for May 16, 2006.

Although a census program has the advantage of providing a fixed count of livestock
on a single day (a freeze frame if you will), the methodology used for a Statistics
Canada Census of Agriculture provides only a minimum baseline number for horses
in Canada on Census Day. Census of Agriculture methodology includes counting all
animals resident on Census Farms on Census Day.

Statistics Canada defines a Census Farm as an agricultural facility that produces an
agriculture product for sale –– i.e. produces more of an agricultural product than the
property or facility consumes. If a particular property meets the defined criteria for a
Census Farm, then all of the equids on the property are counted for the Census. This
methodology does not differentiate ownership of the animals on the Census Farms ––
it counts all animals on the Census Farm on the specified day.

However, published census reports include the proviso that the accuracy of horses
reported in census data may be underrepresented:

     ““Users of this data should be aware that there is potential for greater numbers of
     alternative livestock in Canada than what the census data reports……. Horses are the most
     notable in this regard, as horses on holdings or in stables that do not produce breeding
     stock or sell other agricultural produce are not included ”” (from Statistics Canada ––
     Cat. No. 23 502 XIE).


www.strategicequine.ca                 2010 CANADIAN HORSE INDUSTRY PROFILE STUDY               9
HERD SIZE   HERD PROFILE     TRENDS        VALUE & PRICES     IMPORT/EXPORT                 www.equinecanada.ca


                       2.1 ESTIMATED HERD SIZE
                       For the purposes of calculating an estimated herd size in 2010, data from the 2006
                       Census is analyzed in combination with data acquired from the 2010 telephone
                       research surveys. The analysis was completed in two stages:
                                         Calculating the number of horses in Canada in summer 2006 (i.e. actual
                                         number of horses on Census Farms in May 2006, plus an estimate of
                                         the number of horses not included in the 2006 Census of Agriculture
                                         count)
                                         Calculating an estimated number of horses in Canada during summer
                                         2010, based on reported increase (or decrease) in horse ownership for
                                         those surveyed during summer 2010.

                       The 2006 Census of Agriculture, reports a total of 453,965 equids resident on 54,169
                       Census Farms.

                       Table 2.1: Horses Reported –– Statistics Canada Census of Agriculture 2006

                                                                     Census     Horses                      Average
                           Statistics Canada Census of   Census                               Horses by
                                                                    Farms By Resident on                   Horses per
                           Agriculture 2006              Farms                                Province
                                                                    Province Census Farms                 Census Farm

                           CANADA                        54,169                 453,965                      8.38

                           British Columbia               6,697       12%         53,246        12%          7.95

                           Alberta                       17,219       32%       155,533         34%          9.03

                           Saskatchewan                   8,531       16%         65,914        15%          7.73

                           Manitoba                       3,646       7%          46,580        10%          12.78

                           Ontario                       12,333       23%         97,285        21%          7.89

                           Quebec                         4,259       8%          26,522            6%       6.23

                           New Brunswick                    476       1%           2,973            1%       6.25

                           Nova Scotia                      643       1%           3,705            1%       5.76

                           Prince Edward Island             288       1%           1,921        <1%          6.67

                           Newfoundland                      77       <1%            286        <1%          3.71

                       Telephone interview participants were asked a series of questions related to horse
                       ownership per family unit (or per horse site), and to identify property ownership of
                       Census Farms, and the number of horses resident on Census Farms during the 2006
                       Census of Agriculture.

                       Estimates for the number of foals born in 2006 after the May 16th Census Day, were
                       calculated based on data for pedigree registrations for the 2006 foal year. Data from
                       pedigree registration records for 2006 was compared to research data from the 2003
                       Canadian Horse Industry Study to calculate an estimated number of non pedigree
                       horses on the ground in summer 2006.


 10                                   HORSES IN CANADA IN 2010                              © EQUINE CANADA 2011
HORSES IN CANADA IN 2010


The resulting analysis reports a total herd size of 1,043,433 horses in summer 2006.

Table 2.2: Estimated Herd Size Summer 2006 –– Based on Survey Results


                                                         Non-
                               Horses       Foals      Census       Horses on    Est. # of
                                 on         Born      Properties       Non-      Horses in       Horses
 Estimated Herd Size in        Census      Summer        with        Census      Summer            by
 Summer 2006                   Farms        2006       Horses       Properties    2006          Province
 CANADA                        453,965      18,896       90,437      506,722     1,043,433         100%
 British Columbia               53,246       1,512       14,249        59,442       125,570        12.0%

 Alberta                       155,533       4,724       26,905                     335,980        32.2%
                                                                     191,743
 Saskatchewan                   65,914       3,779       12,546        36,807       127,395        12.2%
 Manitoba                       46,580       4,157        4,995        15,363        67,287         6.4%
 Ontario                        97,285       3,779       17,874        99,936       229,243        22.0%
 Quebec                         26,522        378        10,140        85,100       131,981        12.6%
 New Brunswick                    2,973       567         1,253         6,660        10,178         1.0%
 Nova Scotia                      3,705           -       1,340         4,495          8,445        0.8%
 Prince Edward Island             1,921           -         543         1,479          4,610        0.4%

 Newfoundland                      286                      592         1,114          1,369        0.1%
                                                  -


It should be noted that a Census of Agriculture reports ALL horses on a Census
Farm, whether those horses are owned by the farm owner, or belong to
                                                                                                   Figure 2.1: Horses By
another owner. Horses boarded on Census Farms are included in the count
                                                                                               Province in Summer 2006
of horses on Census Day.

Table 2.2 includes horses boarded on Non Census                                   PE        NL
                                                                      NS                   <1%
                                                                                 <1%
properties in the estimated totals, based on the 2010                <1%
survey results for horse owners who reported
                                                                                                  Horses by Province
                                                               NB                                     Summer 2006
boarding horses on their Non Census property in                1%
2006.
                                                                               QC           BC
In the telephone survey, participants were asked a                            12%          12%
series of questions to identify potential increase, or
decrease in the number of horses owned over the
previous five years (since 2006). Analysis of the                     ON
resulting responses was used to estimate the                          22%
number of horses in Canada in 2010 as outlined in                                                   AB
                                                                                                   32%
Table 2.3.

                                                                         MB
                                                                         6%          SK
                                                                                    12%


www.strategicequine.ca                  2010 CANADIAN HORSE INDUSTRY PROFILE STUDY                                         11
HERD SIZE        HERD PROFILE        TRENDS       VALUE & PRICES          IMPORT/EXPORT                       www.equinecanada.ca


                                 Table 2.3: Estimated Herd Size Summer 2010 –– Based on Survey Results


                                           Est. # of Non-                                                                     % of
                               # of           Census         Est. Total       Horses on        Horses on        Est. # of    Horses
                             Census         Properties      Properties         Census         Non-Census        Horses in      by
  Estimated Herd Size in     Farms          with Horses     with Horses       Farms in        Properties in     Summer      Province
  Summer 2010                (2006)           in 2010         in 2010           2010             2010            2010       in 2010

  CANADA                         59,037          85,963        145,000          483,364           478,786       963,500      100%

  British Columbia                6,177          15,423          21,600           54,736           61,264       116,000      12.0%

  Alberta                        17,249          26,801          44,050         159,988           153,512       313,500      32.5%

  Saskatchewan                    9,930           4,780          14,710           65,801           42,999       108,800      11.3%

  Manitoba                        4,119           1,858           5,977           39,683           16,317         56,000     5.8%

  Ontario                        13,594          20,664          34,258         108,575           103,925       212,500      22.1%

  Quebec                          5,891          13,468          19,359           44,034           85,466       129,500      13.4%

  New Brunswick                     674           1,490           2,164            4,820             7,680        12,500     1.3%

  Nova Scotia                       850             799           1,649            3,312             4,688         8,000     0.8%

  Prince Edward Island              432             288             720            2,186             1,814         4,000     0.4%

  Newfoundland                      121             392             513             229              1,121         1,350     0.1%

  Yukon/NT                             -                -                 -               -                        1,350     0.1%

 Figure 2.2: Horses By           For the purposes of this study, it is estimated that the national herd includes 963,500
 Province in Summer              horses in 2010.
 2010
                                                                   Data on the number of premises (properties) with
            PE        NL            Horses by Province             horses in 2010 –– both Census Farms and non Census
           <1%       <1%                Summer 2010                properties –– was used to develop an estimate of the
   NS                                                              number of horse owning households in Canada in
  <1%
                                                                   2010.
      NB
                                                YT / NT
      1%                                                           In the telephone survey, participants were asked
                                                 <1%
                    QC        BC                                   questions to identify the percentage of owners who
                   13%       12%
                                                                   reside on the same property as the horses they own,
                                                                   and the status of the property as either a Census Farm
                                                                   (as defined by Statistics Canada for a Census of
                                                                   Agriculture) or a non Census property. Table 2.4
             ON                         AB
             22%                       33%                         outlines the estimated number of horse owner
                                                                   households.

                   MB                                              For the purposes of this study, it is estimated that the
                   6%       SK                                     963,500 horses in Canada are owned by members of
                           11%                                     226,500 horse owning households, and kept (are
                                                                   resident) on 145,000 premises in Canada.


 12                                           HORSES IN CANADA IN 2010                                        © EQUINE CANADA 2011
HORSES IN CANADA IN 2010


Table 2.4: Estimated Number of Horse Owning Households in 2010


                                            % of Owners    Est. # of                  Avg. # of   Avg. # of
Properties and Horse-        Est. Total     Who Live on      Owner                   Horses per    Horses
Owning Households in      Properties with      Horse      Households    Total # of     Owner      per Site /
2010                      Horses in 2010     Property     by Province    Horses      Household    Premises
CANADA                     145,000             64%         226,500        963,500          4.3       6.6
British Columbia             21,600            66%          32,700        116,000          3.5       5.4
Alberta                      44,050            70%          62,300        313,500          5.0       7.1
Saskatchewan                 14,710            79%          18,600        108,800          5.8       7.4
Manitoba                      5,977            84%            7,100        56,000          7.9       9.4
Ontario                      34,258            57%          60,100        212,500          3.5       6.2
Quebec                       19,359            53%          36,500        129,500          3.5       6.7
New Brunswick                 2,164            66%            3,780        12,500          3.3       5.8
Nova Scotia                   1,649            81%            2,000         8,000          4.0       4.9
Prince Edward Island            720            60%            1,200         4,000          3.3       5.6
Newfoundland                    513            42%            1,220         1,350          1.1       2.6
Yukon/NT                          -            78%            1,000         1,350          1          -

The estimated number of premises with horses in Canada (in 2010) is considered to
be the locations where horses are normally resident. It does not include sites where
horses may be temporarily resident such as racetracks, training centres, veterinarian
                                                                                                         There are an
clinics, exhibitions, etc.
                                                                                                     estimated 145,000
                                                                                                   properties with horses
2.2 EQUINE HERD PROFILE                                                                            in 2010, not including
Equids in Canada are predominantly in use (or bred for use) in what is now defined                   sites where horses
as the entertainment/leisure sector of the Canadian economy. The specific use of                    may be temporarily
animals, whether for racing, non racing competition, recreational riding, ranching                         resident.
and farm work, or other activities, impacts both capital investment in livestock and
facilities, as well as the annual expenditure for the care of animals. To develop an
accurate estimate of the economic impact generated by the care of horses and
activities of Canadians and their horses, an analysis of the primary use of horses
across the country is required.

For the purposes of this study, the industry is categorized by the following sectors:
        Racing                                     Non racing competition
        Pleasure riding                            Breeding Stock
        Riding school or riding lessons            Tourist activities
        Work (i.e. ranching, logging, etc.)        Companionship (or full retirement)
        PMU production                             Meat production

Horse owners were asked to quantify how many of their horses are young horses not
yet in use, as well as defining a primary use for their mature horses. Table 2.5 reports


www.strategicequine.ca                 2010 CANADIAN HORSE INDUSTRY PROFILE STUDY                                   13
HERD SIZE     HERD PROFILE      TRENDS        VALUE & PRICES           IMPORT/EXPORT                       www.equinecanada.ca


                            the percentages of horses in each province categorized as Young Horses Not Yet In Use
                            or Mature Horses.
      There are             Table 2.5: Young Horses and Mature Horses by Province
    approximately
                                                                                                                       Estimated
220,000 young horses                                                                                   Estimated        Mature
 in the 2010 herd ––                                                        Total        % Young         Young         Horses In
horses categorized as           2010 Young / Mature Horses                 Horses        Horses         Horses            Use
  ““Not Yet In Use””.           CANADA                                     963,500           23%         219,884         743,616

                                British Columbia                           116,000           17%             19,720       96,280

                                Alberta                                    313,500           29%             90,915      222,585

                                Saskatchewan                               108,800           28%             30,464       78,336

                                Manitoba                                     56,000          23%             12,880       43,120

                                Ontario                                    212,500           22%             46,750      165,750

                                Quebec                                     129,500           12%             15,540      113,960

                                New Brunswick                                12,500          13%              1,625       10,875

                                Nova Scotia                                   8,000          13%              1,040        6,960

                                Prince Edward Island                          4,000          18%               720         3,280

                                Newfoundland                                  1,350          7%                  95        1,255

                                Yukon/NT                                      1,350          10%               135         1,215

                            Recognizing that individual horses are often used for more than one type of activity,
                            survey participants were asked to assign the primary use to the mature horses they
                            own, and the intended use for young horses. Table 2.6 and Table 2.7 report the
                            estimated number of horses in the country by primary use –– by sector.

                            Table 2.6: Horses by Primary Use

                                                                                                                       Estimated
                                                                                                                       Horses by
                                Horses Primary Use                                                 % of Horses        Primary Use
Of the mature horses            Young Horses Not Yet in Use                                          22.8%              219,884
 in the herd, 175,000
                                Racing (including breeding for racing)                                5.4%               52,029
are in use in the sport
  competition sector,           Sport Competition other than racing                                  18.2%              175,357
     172,000 in the             Pleasure riding & driving                                            17.8%              171,503
pleasure riding sector,         Breeding stock                                                       18.3%              176,321
    and 176,000 as
                                Riding lessons                                                        2.3%               22,161
    breeding stock.
                                Commercial trail rides, sleigh rides or tourist activities            0.9%                8,672
                                Work (ranching, logging, farming, etc.)                               3.4%               32,759
                                Companionship or full retirement                                      3.5%               33,723
                                PMU production                                                        0.4%                3,854
                                Meat production                                                       0.7%                6,745
                                OTHER USES                                                            6.3%               60,701


    14                                        HORSES IN CANADA IN 2010                                        © EQUINE CANADA 2011
HORSES IN CANADA IN 2010


Table 2.7 Young Horses –– Intended Primary Use

                                                                                     Estimated
                                                                                     Horses by
 Intended Use for Young Horses                                        % of Horses   Primary Use
                            Total Young Horses Not Yet In Use                         219,884
 Sport Competition -- FEI disciplines                                    31.0%         68,164
 Sport Competition -- Western sport disciplines                          17.0%         37,380
 Racing                                                                  9.0%          19,790
 Breed sport competition                                                 1.0%            2,199
 Pleasure Riding                                                         24.0%         52,772
 Breeding stock                                                          6.0%          13,193
 Ranch work / farm work                                                  7.0%          15,392
 Meat production                                                         2.0%            4,398
 OTHER USES                                                              2.0%            4,398


The number of horses in each sector varies from province to province, with the
western provinces hosting the largest percentage of the breeding sector –– both
breeding stock and young horses not yet in use.

Figure 2.3: Primary Use of Horses in Canada in 2010


          Commercial                    Companionship                                                 Horses Primary Use
           Activities           Work        4%              PMU Production
              1%                 3%                             <1%
The category of OTHER USES was undefined. Where an Production survey
                                                    Meat
                                                         individual
 Riding Lessons
participant was unwilling to assign a single primary use to horses, they were
                                                          1%                   Breed Sport
       2%                                                                     Competitions
included in the OTHER USES category. Figure 2.4 below reports the primary use for
                                                 OTHER USES
                                                     6%                           <1%
horses in each provincial region.

Figure 2.4: Primary Use of Horses –– By Province
                                                                                             Racing
                                                                                              3%        Pleasure Riding
          Breeding Stock
                                                                                                              7%
               17%

                                        Young Horses                                Sport Competition                        Breeding
                                        Not Yet In Use                                  Western                               Stock
                                             23%                                           4%                                   2%
     Pleasure Riding                                                                                                 Work
          18%                                                                                                         2%
                                                                                             Sport Competition
                                                                                              FEI Disciplines
                                                                                                    9%                        Meat
                        Sport Competition                                                                                  Production
                               18%                                                                                            <1%

                                                         Racing                                               OTHER USES
                                                          5%                                                      1%


www.strategicequine.ca                        2010 CANADIAN HORSE INDUSTRY PROFILE STUDY                                                15
HERD SIZE        HERD PROFILE            TRENDS         VALUE & PRICES               IMPORT/EXPORT                     www.equinecanada.ca


                                    The Other Uses category in the questionnaire was undefined. If an individual survey
                                    participant was unwilling (or unable) to assign a single primary use to one or more
                                    of their horses, the horse was included in the Other Uses category. The percentage of
                                    horses that are included in each Primary Use category varies between provincial
                                    regions. Figure 2.4 reports primary use categories for horses in each
                                    province/territory.

                                    Figure 2.4: Primary Use of Horses by Province


                   OTHER
                 USES -- <1%                                          Racing -- 2%                  British Columbia
                                          Young Horses
      Companionship --                   Not Yet in Use --                                           Young Horses Not Yet in Use -- 19,720
           4%                                 17%                                                    Racing -- 2,668

                                                                       Sport Competition --          Sport Competition -- 28,072
                            Work -- 7%                                         24%                   Pleasure riding -- 37,932
       Commercial                                                                                    Breeding stock -- 11,556
      activites -- 3%                                                                                Riding lessons -- 2,784
                                  Breeding                                                           Commercial activites -- 2,900
                                 Stock -- 9%
          Riding                                    Pleasure Riding --                               Work -- 7,076
       lessons -- 2%                                      33%                                        Companionship -- 4,176
                                                                                                     PMU production -- 0
                                                                                                     Meat production -- 0
                                                                                                     OTHER USES -- 116


                      OTHER
           Meat
                    USES -- 2%                                                       Racing -- 2%   Alberta
      Production -- <1%                            Young Horses                                      Young Horses Not Yet in Use -- 90,915
      Companionship -- 3%                         Not Yet in Use --                                  Racing -- 4,703
                                                       29%
                                                                                                     Sport Competition -- 70,851
         Commercial         Work -- 4%                                                               Pleasure riding -- 49,220
        Activites -- 1%
                                                                                                     Breeding stock -- 63,641
                                                                  Sport Competition --
                                                                         23%                         Riding lessons -- 3,135
           Riding
        Lessons -- 1%                                                                                Commercial activites -- 4,076
                                    Breeding                                                         Work -- 12,854
                                  Stock -- 20%
                                                     Pleasure Riding --                              Companionship -- 8,778
                                                           16%
                                                                                                     PMU production -- 0
                                                                                                     Meat production -- 0
                                                                                                     OTHER USES -- 5,643


 16                                                HORSES IN CANADA IN 2010                                            © EQUINE CANADA 2011
HORSES IN CANADA IN 2010

                            OTHER
           Meat
                          USES -- <1%                                                                     Saskatchewan
      Production -- 1%                                                                     Racing -- 2%
                                                      Young Horses
                                                     Not Yet in Use --                                     Young Horses Not Yet in Use -- 30,464
          PMU
     Production -- <1%                                    28%                                              Racing -- 2,176
                               Companionship --                                                            Sport Competition -- 14,579
       Commercial
                                    7%                                                                     Pleasure riding -- 20,563
      Activites -- <1%                                                       Sport Competition --
                                                                                                           Breeding stock -- 28,070
                                                                                     13%
          Riding                                                                                           Riding lessons -- 2,285
       Lessons -- 2%
                                                                                                           Commercial activites -- 435
           Work -- <1%                     Breeding                   Pleasure Riding --                   Work -- 435
                                         Stock -- 29%                       19%                            Companionship -- 7,725
                                                                                                           PMU production -- 0
                                                                                                           Meat production -- 762
                                                                                                           OTHER USES -- 109


           PMU                                                                                            Manitoba
      Production -- 2%                                                                                     Young Horses Not Yet in Use -- 12,880
    Companionship --                Meat                OTHER                                              Racing -- 2,016
         1%                    Production -- 7%       USES -- 25%
                                                                                                           Sport Competition -- 6,272
       Work -- 2%                                                               Young Horses
                                                                               Not Yet in Use --           Pleasure riding -- 3,976
                                                                                    23%                    Breeding stock -- 12,992
        Riding
    Lessons -- <1%                                                                                         Riding lessons -- 280
                                   Breeding
                                 Stock -- 23%                                   Racing -- 4%               Commercial activites -- 0

                                                                  Sport Competition --                     Work -- 952
                                                                          11%                              Companionship -- 728
                                                     Pleasure Riding --
                                                            7%                                             PMU production -- 1,120
                                                                                                           Meat production -- 4,144
                                                                                                           OTHER USES -- 10,640


                    OTHER
                  USES -- 2%
                                                                                                          Ontario
                                                   Young Horses
                                                  Not Yet in Use --                                       Young Horses Not Yet in Use -- 46,750
      Work -- <1%
                                                       22%                    Racing -- 13%               Racing -- 26,563
                           Companionship --
                                8%                                                                        Sport Competition -- 43,350
    Commercial
   Activites -- <1%                                                                                       Pleasure riding -- 35,275
                             Riding                                                                       Breeding stock -- 30,175
                          Lessons -- 4%
                                                                                                          Riding lessons -- 9,138
                                                                          Sport Competition --            Commercial activites -- 1,488
                                   Breeding
                                                                                  20%
                                 Stock -- 14%                                                             Work -- 1,913
                                                                                                          Companionship -- 13,388
                                                      Pleasure Rding --
                                                                                                          PMU production -- 0
                                                            17%
                                                                                                          Meat production -- 0
                                                                                                          OTHER USES -- 3,400


www.strategicequine.ca                        2010 CANADIAN HORSE INDUSTRY PROFILE STUDY                                                           17
HERD SIZE        HERD PROFILE            TRENDS           VALUE & PRICES                IMPORT/EXPORT               www.equinecanada.ca


                            OTHER
                          USES -- 2%
      Companionship --
                                                                 Racing --                              Quebec
                                          Young Horses             7%
           2%                                                                                            Young Horses Not Yet in Use -- 15,540
                                         Not Yet in Use --
                                              12%                                                        Racing -- 8,547
         Commercial                                                          Sport Competition --
        Activites -- 1%                                                                                  Sport Competition -- 27,843
                                   Riding                                            22%
                                                                                                         Pleasure riding -- 50,894
       Work -- <1%              Lessons -- 7%
                                                                                                         Breeding stock -- 11,914
                                  Breeding                                                               Riding lessons -- 9,065
                                 Stock -- 9%                                                             Commercial activites -- 1,684
                                                                                                         Work -- 130
                                                             Pleasure Riding --
                                                                   39%                                   Companionship -- 2,590
                                                                                                         PMU production -- 0
                                                                                                         Meat production -- 0
                                                                                                         OTHER USES -- 2,072


                     OTHER
                   USES -- 3%                                                                           Maritimes - Combined
                                              Young Horses
       Companionship --                                                 Racing -- 18%                     Young Horses Not Yet in Use -- 3,480
                                             Not Yet in Use --
            4%                                    14%                                                     Racing -- 4,652
                                                                                                          Sport Competition -- 5,518
       Commercial               Work -- 4%                                                                Pleasure riding -- 4,210
      Activites -- 1%
                                                                                                          Breeding stock -- 4,317
                                                                             Sport Competition --         Riding lessons -- 631
                                                                                     21%
           Riding                                                                                         Commercial activites -- 304
        Lessons -- 2%                    Breeding                                                         Work -- 909
                                       Stock -- 17%       Pleasure Riding --
                                                                16%                                       Companionship -- 981
                                                                                                          PMU production -- 0
                                                                                                          Meat production -- 0
                                                                                                          OTHER USES -- 779

                                    Note: Maritimes –– Combined includes New Brunswick, Nova Scotia, Prince Edward Island
                                    and Newfoundland
                                    Those interviewed were also asked to define the percentage of horses owned that are
                                    registered with pedigree registries –– or potentially would qualify for registration
                                    with a pedigree registry –– through the following questions:
                                                       ““How many of your horses are registered with a pedigree breed registry?””
                                                        ““Do you own other horses that could be, but are not as of yet, registered with
                                                       a registry?””

                                    From the resulting responses, 85% of horse owners reported that they own one or
                                    more registered horses –– reporting that 74% of horses owned are registered with a
                                    pedigree registry. When asked whether they owned horses that were eligible for
                                    registration, but not yet registered, 18% of horse owners reported that they owned


 18                                                  HORSES IN CANADA IN 2010                                        © EQUINE CANADA 2011
HORSES IN CANADA IN 2010


pedigree horses that were not yet registered –– 6% of horses owned. When asked if
they intended to register these horses with a pedigree registry, less than half (42%) of
these owners expected to register their eligible, unregistered horses with a pedigree
registry –– intending to register 57% of their eligible horses.

For those reporting that they own active stallions at stud, 97% of active stallions are
registered with a pedigree registry. For those reporting mares active in breeding, 64%
of mares are registered with a pedigree registry.

Owners of registered horses were asked:
                ““How many of your horses have registration papers from a Canadian
                registry?””

The responses indicated that, of the registered horses in Canada, 54% are registered
with a Canadian pedigree registry.


Table 2.8: Pedigree Registered Horses in 2010


                                                                                                               YT/
Registered Horses          Canada     BC        AB    SK     MB       ON      QC     NB    NS    PE     NL     NT
% of horses registered
with a pedigree breed         74%     72%       85%   76%     64%    75%     81%     90%   90%   100%   68%    75%
registry
% of horses with
registration papers from      10%     13%       12%    4%      6%      9%    17%     17%   10%   44%     4%     0%
more than one registry
% of horses with
registration papers from      54%     48%       59%   36%     51%    61%     63%     78%   64%   81%    63%    69%
a Canadian registry
% of horses eligible for
registration -- not yet        6%      8%       5%     5%      7%      8%      7%    10%   4%     4%     7%     0%
registered
% of owners who expect
to register eligible          42%     30%       49%   42%     40%    45%     46%     54%   30%   75%    100%    0%
horses


2.3 MULTI-YEAR TRENDS FOR HORSES IN CANADA
Multi year trends for horses in Canada –– and premises (properties) with horses ––
shows a pattern for five year cycles for overall increase/decrease in herd size.

Table 2.9 reports the Census of Agriculture data for horses (and farms reporting
horses) for the 1981 through 2006 period.


www.strategicequine.ca                 2010 CANADIAN HORSE INDUSTRY PROFILE STUDY                                19
HERD SIZE   HERD PROFILE      TRENDS          VALUE & PRICES       IMPORT/EXPORT                         www.equinecanada.ca


                       Table 2.9: Census of Agriculture 1981 to 2006

                           CANADA                     1981          1986          1991         1996              2001        2006
                           # of Horses               358,122       394,953       356,201      443,889           460,569     453,965
                           # of Farms Reporting       69,178        69,148        58,509        56,707           53,925       54,169
                           Avg. # per farm                  5.2           5.7           6.1            7.8           8.5          8.4


                                                            % change       % change       % change           % change      % change
                           CANADA                           '81 to '86     '86 to '91     '91 to '96         '96 to '01    '01 to '06

                           # of Horses                            10%           -10%            25%                 4%           -1%
                           # of Farms Reporting                    0%           -15%            -3%                -5%            0%
                           Avg. # per farm                        10%             7%            28%                 9%           -1%

                       While the overall number of horses is relatively stable over the 1981 to 1991 period,
                       examination of five year cycles shows a 10% increase in herd size during 1981
                       through 1986, followed by a 10% decrease during 1986 to 1991. Significant growth in
                       herd size is reported for the 1991 through 1996 period, reflecting the development
                       and expansion of the PMU (pregnant mare urine) production sector in Western
                       Canada. Growth in overall herd size continues through the 2001 Census, and starts to
                       show a reduction in number of horses reflected in the 2006 Census results. Trends for
                       number of horses per province from Census of Agriculture reports is outlined in
                       Table 2.10.

                       Table 2.10: Horses by Province –– Census of Agriculture 1981 to 2006

                           # of Horses
                           Reported                  1981          1986          1991          1996             2001         2006
                           British Columbia          39,356        42,034        39,785        49,305           53,366       53,246
                           Alberta                  118,708       135,025       109,237       149,960          159,962      155,533
                           Saskatchewan              60,180        67,484        53,843        66,372           71,306       65,914
                           Manitoba                  31,284        40,691        44,130        68,783           62,791       46,580
                           Ontario                   74,986        74,961        75,132        76,553           83,337       97,285
                           Quebec                    24,682        25,481        25,787        25,108           22,284       26,522
                           New Brunswick             2,972         3,339         3,133         2,757             2,661        2,973
                           Nova Scotia               3,297         3,171         2,957         2,907             3,009        3,705
                           Prince Edward Island      2,317         2,357         1,891         1,869             1,565        1,921
                           Newfoundland                340           410           309           275               288          286

                       A complete report of Census of Agriculture data for 1981 through 2006 is included in
                       the Appendices of this report.

                       Strategic Equine research for the 1998 through 2010 period reports herd size for the
                       period based on national research studies completed in 1998, 2003 and 2010. Table
                       2.11 reports estimated number of horses by province for the period.


 20                                      HORSES IN CANADA IN 2010                                            © EQUINE CANADA 2011
HORSES IN CANADA IN 2010


Table 2.11: Estimated Number of Horses by Province 1998 to 2010


Estimated Herd Size
Strategic Equine Research       1998            2003            2005          2006       2007       2010
CANADA                          886,500        950,000         1,092,461     1,043,433    994,401    963,500

British Columbia                114,000        135,000            127,473     125,570    123,667    116,000

Alberta                         308,500        300,000            356,250     335,980    315,710    313,500

Saskatchewan                    123,000        125,000            135,492     127,395    119,298    108,800

Manitoba                         71,000        110,000             72,351      67,287     62,222     56,000

Ontario                         189,250        194,000            236,901     229,243    221,585    212,500

Quebec                           63,000            65,000         137,620     131,981    126,341    129,500

New Brunswick                    10,500            11,000          10,008      10,178     10,348     12,500

Nova Scotia                        5,000            6,000           8,969       8,445       7,920      8,000

Prince Edward Island               1,500            2,500           4,520       4,610       4,700      4,000

Newfoundland                          750           1,500           1,527       1,369       1,210      1,350

Yukon/NT                                                            1,350       1,375       1,400      1,350


Analysis of the resulting data indicates an increase in the number of horses in
Canada during the 2003 through 2005 period, to an estimated 1,000,000 horses in
2005, followed by decreases in the 2006 through 2007 period.

Figure 2.5: Horses in Canada 1998 to 2010 Strategic Equine Research


                       Trend for Herd Size 1998 2010
   1,200,000

   1,000,000

     800,000

     600,000

     400,000

     200,000


                   1998        2003         2005        2006          2007   2010

                                            CANADA


The trend for increase or decrease in herd size varies between provinces, reflecting
the different business models for the different regions of the country. Figure 2.6
charts the trends for increase/decrease in herd size for each province for the 1998
through 2010 period.


www.strategicequine.ca                 2010 CANADIAN HORSE INDUSTRY PROFILE STUDY                              21
HERD SIZE        HERD PROFILE       TRENDS       VALUE & PRICES       IMPORT/EXPORT                  www.equinecanada.ca


                                Figure 2.6: Trends for Herd Size By Province


             Trend for Herd Size 1998 2010                                     Trend for Herd Size 1998 2010
140,000                                                          370,000
135,000                                                          360,000
                                                                 350,000
130,000
                                                                 340,000
125,000                                                          330,000
120,000                                                          320,000
115,000                                                          310,000
                                                                 300,000
110,000
                                                                 290,000
105,000                                                          280,000
100,000                                                          270,000

          1998    2003   2005     2006    2007    2010                     1998    2003   2005   2006    2007   2010

                     British Columbia                                                      Alberta


             Trend for Herd Size 1998 2010                                     Trend for Herd Size 1998 2010
160,000                                                          120,000
140,000                                                          100,000
120,000
100,000                                                           80,000
 80,000                                                           60,000
 60,000                                                           40,000
 40,000
 20,000                                                           20,000


          1998    2003   2005     2006    2007    2010                     1998    2003   2005   2006    2007   2010

                      Saskatchewan                                                        Manitoba


            Trend for Herd Size 1998 2010                                      Trend for Herd Size 1998 2010
250,000                                                         160,000
                                                                140,000
200,000
                                                                120,000
150,000                                                         100,000
                                                                 80,000
100,000
                                                                 60,000
 50,000                                                          40,000
                                                                 20,000


          1998    2003   2005     2006    2007    2010                     1998   2003    2005   2006    2007   2010

                         Ontario                                                          Quebec


  22                                        HORSES IN CANADA IN 2010                                 © EQUINE CANADA 2011
HORSES IN CANADA IN 2010


                   Trend for Herd Size 1998 2010                                  Trend for Herd Size 1998 2010
   14,000                                                         10,000
                                                                   9,000
   12,000
                                                                   8,000
   10,000                                                          7,000
    8,000                                                          6,000
                                                                   5,000
    6,000                                                          4,000
    4,000                                                          3,000
                                                                   2,000
    2,000
                                                                   1,000


            1998      2003    2005   2006   2007   2010                    1998      2003    2005   2006   2007   2010

                            New Brunswick                                                   Nova Scotia


                   Trend for Herd Size 1998 2010                                  Trend for Herd Size 1998 2010
   5,000                                                          1,800
   4,500                                                          1,600
   4,000                                                          1,400
   3,500                                                          1,200
   3,000
                                                                  1,000
   2,500
                                                                    800
   2,000
   1,500                                                            600
   1,000                                                            400
     500                                                            200


            1998     2003    2005    2006   2007   2010                    1998     2003     2005   2006   2007   2010

                       Prince Edward Island                                                 Newfoundland


A series of questions were asked to identify trends for potential future growth (or
contraction) in the herd size:
              Five years from now, do you expect to own MORE, LESS or the SAME
              number of horses as you do today?                                                         Only 19% of horse
                                                                                                      owners expect to own
              Next year, do you expect to own MORE, LESS or the SAME number of
                                                                                                       more horses in five
              horses as you do today?
                                                                                                          years time ––
                                                                                                       30% expect to own
Survey responses reported that only 19% of horse owners expect to own more horses                      fewer horses in five
in five years time –– while 30% of current horse owners expect to own less (fewer)                         years time.
horses in 2015 than they own in 2010. From survey responses, 19% of horse owners
expect to own fewer horses in one year (2011) compared to horses owned in 2010.

Table 2.12 reports the expectation to own for current horse owners in 2015 and 2011
compared to horses owned in 2010.


www.strategicequine.ca                  2010 CANADIAN HORSE INDUSTRY PROFILE STUDY                                       23
HERD SIZE       HERD PROFILE       TRENDS       VALUE & PRICES        IMPORT/EXPORT                      www.equinecanada.ca


                            Table 2.12: Expectation to Own Horses in the Future by Province


                                    Expectation to Own in Five Year's Time          Expectation to Own in One Year's Time

                                   Expect to        Expect to     Expect to        Expect to      Expect to        Expect to
  % of Owners Responding with     Own MORE         Own FEWER     Own SAME #       Own MORE       Own FEWER        Own SAME #
  an Expectation to Own ……          Horses           Horses       of Horses         Horses         Horses          of Horses
  CANADA                             19.0%            30.0%         51.0%           13.0%           19.0%              67.0%
  British Columbia                   20.0%            28.0%         53.0%           13.0%           17.0%              72.0%
  Alberta                            20.0%            32.0%         46.0%           15.0%           23.0%              60.0%
  Saskatchewan                       21.0%            32.0%         46.0%           16.0%           23.0%              60.0%
  Manitoba                           12.0%            46.0%         41.0%            7.0%           27.0%              65.0%
  Ontario                            17.0%            29.0%         53.0%           12.0%           18.0%              69.0%
  Quebec                             25.0%            14.0%         62.0%           18.0%           9.0%               74.0%
  New Brunswick                      17.0%            29.0%         54.0%           12.0%           19.0%              69.0%
  Nova Scotia                        13.0%            44.0%         42.0%           11.0%           31.0%              57.0%
  Prince Edward Island               16.0%            36.0%         48.0%           12.0%           20.0%              68.0%
  Newfoundland                       26.0%            16.0%         58.0%           11.0%           5.0%               84.0%
  Yukon/NT                           11.0%            33.0%         56.0%           11.0%           22.0%              67.0%


                            Two provinces, Quebec and Newfoundland, are the only regions of the country
                            where the number of horse owners who expect to own more horses is greater than
                            the number of owners who expect to reduce the number of horses they own in 2010.
                            It is expected that Quebec and Newfoundland will show continued growth in herd
                            size over the next five year period.

                            Data from pedigree registries for foal registrations shows a steady trend for
                            decreased number of foal registrations during the 2003 through 2010 period.

                            Table 2.13: Annual Foal Production Trend 2003 to 2009

                                                          % of horses         Est. # of      Annual         Est. Non
                                Annual Foal Crop        registered with      registered     Foal Crop      Pedigree       Total
                                2003 to 2009           pedigree registry       horses       Registered     Foal Crop    Foal Crop
                                               2010              70.0%          674,450
            *Note foal
                                              *2009              68.5%          702,821        22,753        10,463       33,216
    registrations may
  be incomplete, due                          *2008              68.0%          681,221        26,451        12,448       38,899
   to rules that allow                         2007              67.5%          671,221        26,210        12,620       38,830
    registration up to                                           65.0%          678,231        29,393        15,827       45,220
                                               2006
    two year old age.
                                             **2005              63.0%          688,250        29,838        27,524       57,362
  **Adjusted for foal                                            62.0%          623,000        31,069        34,042       65,111
                                             **2004
    production from
        PMU sector.                                              64.0%          608,000        30,788        37,318       68,106
                                             **2003


 24                                          HORSES IN CANADA IN 2010                                    © EQUINE CANADA 2011
HORSES IN CANADA IN 2010


Owners of mares of breeding age were asked questions to identify plans for their
breeding programs:
               Compared to 2009, do you expect to breed MORE, LESS or the SAME
               number of your mares in 2010?
               Next year (2011), do you expect to breed MORE, LESS or the SAME number
               of your mares as 2010?

Table 2.14: Expectation for Mares Bred 2010 and 2011
                                       Expectations     Expectations
 % of Mare Owners Reporting             for Mares        for Mares
 Expectation for Mares Bred              Bred in          Bred in
 Compared to 2009                         2010             2011
 Expect to Breed More Mares                23.0%            19.0%
 Expect to Breed Fewer Mares               35.0%            20.0%
 Expect to Breed Same # of Mares           42.0%            59.0%


Mare owners that expect to breed more mares next year, expect to breed 13% more
mares than 2010. Mare owners that expect to breed fewer mares next year, expect to
breed 29% fewer mares. It is expected that there will be a reduction in foal                       It is expected that
production of approximately 15% in 2011.                                                              there will be a
                                                                                                    reduction in foal
Horse owners that reported an expectation to own less horses in the future, were                      production of
asked ““Why?””. While there were multiple responses given, responses can be                       approximately 15%
generally categorized as outlined in Table 2.15. Of those reporting an expectation to                     in 2011.
own fewer horses, 72% of respondents cited reasons of age/demographics. Of
respondents, 33% cited reasons surrounding difficulty in selling horses in the current
marketplace.

Table 2.15: Reasons Offered For Reducing Number of Horses Owned


                                                                               % of Owners
                                                                             Reporting Owning
                                                                            Fewer Horses in the
 Reason for Expectation To Own Fewer Horses in Future Years                       Future
 "I’’m hitting retirement age"                                                    32.0%
 "I’’m not active in sport/competition any more"                                   4.0%
 "My horses are getting old and so am I"                                          29.0%

  "The kids have moved out and we were mostly involved with the kids
 showing"                                                                          7.0%
 "Having trouble selling horses currently, hoping to sell some next year"         17.0%
 "Selling my horses"                                                              16.0%
 "Too expensive to keep horses / I can’’t afford it any more"                     33.0%
 "Getting out of the business"                                                    17.0%
 "Too Busy / Too Much Work"                                                        5.0%
 Other                                                                            21.0%


www.strategicequine.ca                     2010 CANADIAN HORSE INDUSTRY PROFILE STUDY                             25
HERD SIZE   HERD PROFILE      TRENDS        VALUE & PRICES        IMPORT/EXPORT                   www.equinecanada.ca


                       2.4 VALUE AND PRICES FOR HORSES IN 2010
                       Survey participants were asked a series of questions to identify capital investment in
                       horses, and the expected value of their horses in 2010.
                                          Of the horses that you currently own, how many did you purchase?
                                          How much money did you spend to purchase these horses?
                                          Including foals and yearlings, what is your ESTIMATE of the market value of
                                          your horses today?

                       Data reported indicates that the average purchase price for horses owned is $6,054
                       per horse, with a corresponding average estimated market value of $6,000 per horse.
                       Table 2.16 reports the average purchase price and estimated market value for each
                       provincial region.

                       Table 2.16: Average Purchase and Average Estimated Market Value by Province

                                                                                     Average
                                                                   Average          estimated
                           Horse Owners Reporting Purchase      purchase price     market value         Price
                           Price and Estimated Market Value       per horse         per horse        Differential
                           CANADA                                      $6,054            $6,000               99%

                           British Columbia                             $6,181           $7,079             115%

                           Alberta                                      $7,335           $7,662             104%

                           Saskatchewan                                 $2,659           $2,776             104%

                           Manitoba                                     $2,543           $2,808             110%

                           Ontario                                      $9,156           $8,745               96%

                           Quebec                                       $4,487           $6,560             146%

                           New Brunswick                                $2,884           $3,216             112%

                           Nova Scotia                                  $7,175           $9,769             136%

                           Prince Edward Island                         $3,271           $5,530             169%

                           Newfoundland                                 $3,932           $3,987             101%

                           Yukon/NT                                     $3,092           $2,479               80%


                       An additional series of questions were asked to identify prices for horses offered for
                       sale in the 2008/2009 period, compared to prices for horses in 2010.
                                          How many horses have you bought (sold) so far in 2010?
                                          How many horses did you buy (or sell) in the previous two years (2008 and
                                          2009)?
                                          For the horses you purchased (or sold) in 2010, were prices higher, lower, or
                                          about the same as prices in the previous two years?
                                          How much higher/lower?


 26                                      HORSES IN CANADA IN 2010                                  © EQUINE CANADA 2011
HORSES IN CANADA IN 2010


While there is a high percentage of horse owners who maintain ownership of their
horses for the horses’’ lifetime, there is also a corresponding significant level of
buying and selling activity within the industry each year.
                                                                                                   When asked how long
In response to the question ““On average how long would you keep each of your horses                  they keep horses
before you sell them?”” 56% of horse owners reported ““lifetime””, i.e. they do not sell           before selling, 56% of
their horses.                                                                                           horse owners
                                                                                                    reported ““lifetime””,
From survey respondents, 15% of horse owners reported to have bought horses in                      i.e. they do not sell
2010. An additional 40% of horse owners reported that they have bought horses in                        their horses.
the previous two years (2008/2009), representing 30% of the 963,500 horses in Canada
in 2010. Table 2.17 reports the estimated numbers of horses bought (purchased) since
2008 by provincial region.

Table 2.17: Estimated Number of Horses Purchased Since 2008


                                                                       Estimated
                            % of horses    Estimated     % of horses   # of horses     Total
                              owned        # of horses      owned      purchased     Purchased
 % of Horses Purchased      purchased      purchased     purchased     in 2008 &       Since
 in 2008 through 2010        in 2010         in 2010     since 2008       2009         2008
 CANADA                                        38,072                      96,956     135,028

 British Columbia                   3%          3,480          12%         10,440      13,920

 Alberta                            2%          6,270          11%         28,215      34,485

 Saskatchewan                       5%          5,440          13%          8,704      14,144

 Manitoba                           3%          1,680          10%          3,920          5,600

 Ontario                            6%         12,750          18%         25,500      38,250

 Quebec                             6%          7,770          19%         16,835      24,605

 New Brunswick                      3%            375          14%          1,375          1,750

 Nova Scotia                        2%            160          18%          1,280          1,440

 Prince Edward Island               3%            120            8%           200           320

 Newfoundland                       2%             27          33%            419           446

 Yukon/NT                           0%              0            5%            68            68


From survey responses, 16% of horse owners reported that they have sold horses in
2010. An additional 32% of horse owners reported that they have sold horses in the
previous two years (2008/2009).

For Table 2.17, Table 2.18 and Table 2.19, estimates for horses purchased or sold in
2010, are in response to the question ““how many horses (bought/sold) so far this year””, i.e.
represents only buying/selling activity up to summer 2010 (time of the survey).


Table 2.19 reports the percentage of horses in each provincial herd that were sold into
each market segment during the 2008 through 2010 period.


www.strategicequine.ca                    2010 CANADIAN HORSE INDUSTRY PROFILE STUDY                                27
HERD SIZE       HERD PROFILE      TRENDS        VALUE & PRICES              IMPORT/EXPORT                   www.equinecanada.ca


                           Table 2.18: Estimated Number of Horses Sold By Province Since 2008
                                                                                                          Estimated
                                                                            Estimated                     # of horses
                                                           % of horses      # of horses     % of horses     sold in
                               % of Horses Sold in         owned sold         sold in       owned sold      2008 &       Total Sold
                               2008 through 2010            in 2010            2010         since 2008       2009       Since 2008
                               CANADA                          8%               72,608         28%          163,571       236,179
                               British Columbia               9%                10,440         41%            37,120        47,560
                               Alberta                        7%                21,945         19%            37,620        59,565
                               Saskatchewan                   7%                 7,616         31%            26,112        33,728
                               Manitoba                       11%                6,160         37%            14,560        20,720
                               Ontario                        7%                14,875         24%            36,125        51,000
                               Quebec                         8%                10,360         15%             9,065        19,425
                               New Brunswick                  5%                   625         9%                500         1,125
                               Nova Scotia                    4%                   320         23%             1,520         1,840
                               Prince Edward Island           6%                   240         27%               840         1,080
                               Newfoundland                   2%                    27         7%                  68            95
                               Yukon/NT                       0%                        -      3%                  41            41


                           Table 2.19 identifies the estimated number of horses sold by market segment in each
                           provincial region for the 2008 through 2010 period.

                           Table 2.19: Active Markets for Horses Sold Since 2008
Estimated Number of        Est. # of
Horses Sold by Industry     Horses                          Sport
Sector                       Sold            Racing       Competition        Breeding        Pleasure       Work          Meat
 CANADA                        236,179        17,707           85,342           14,428          99,963        12,037        13,482
 British Columbia               47,560            951          17,122            1,427          26,158         1,902              -
 Alberta                        59,565         1,787           23,230            5,361          25,017         1,787         1,787
 Saskatchewan*                  33,728                -        13,491            3,036           9,107         4,385         9,209
 Manitoba                       20,720         1,036            7,045            2,279           8,910           829         2,486
 Ontario                        51,000        11,730           20,400            1,530          14,280         3,060              -
 Quebec                         19,425            583           3,108              389          15,346              -             -
 New Brunswick                   1,125            326               326             56              371            56             -
 Nova Scotia                     1,840            938               350            166              368            18             -
 Prince Edward Island            1,080            356               270            184              270             -             -
 Newfoundland                       95                -                 -               -            95             -             -


                           *Note: A single individual surveyed reported selling 4,150 horses into the meat sector
                           during the period
                           Survey participants who reported selling horses in the 2008 through 2010 period
                           were asked to identify the sales channel by which they sold their horses. Nationally,


 28                                          HORSES IN CANADA IN 2010                                        © EQUINE CANADA 2011
HORSES IN CANADA IN 2010


more than 85% of the horses sold during the period were sold through private sales
transactions. The preferred sales channel for horses in each province is reported in
Table 2.20 below.                                                                                   Of the 135,000 horses
                                                                                                    sold since 2008, 80%
Table 2.20: Sales Channel for Horses Sold 2008 to 2010                                                  have been sold
                                                                                                    through private sale.
                                                         Association
 Owners Reporting           Private    Commercial         Auction or      Private     Directly to
 Where They Sold Horses      Sale      Auction Mart         Sale          Broker         Meat
 CANADA                      80%            9%              11%             1%              2%
 British Columbia            96%           1%                1%             1%              0%
 Alberta                     76%           8%                9%             2%              4%
 Saskatchewan                55%           26%               6%             0%           10%
 Manitoba                    76%           16%               6%             0%              0%
 Ontario                     68%           10%              18%             3%              0%
 Quebec                      93%           1%                4%             0%              0%
 New Brunswick               64%           6%               20%             0%              0%
 Nova Scotia                 90%           0%               10%             0%              0%
 Prince Edward Island        79%           21%               0%             0%              0%
 Newfoundland               100%           0%                0%             0%              0%
 Yukon/NT                   100%           0%                0%             0%              0%

Survey participants who reported that they had bought horses both in 2010 and in
the previous two years (2008 and 2009) were asked to compare purchase prices paid
                                                                                                     Of those who bought
in 2010 compared to previous years. Table 2.21 reports the percentage of buyers that
                                                                                                     horses in 2010, 18%
reported purchase prices HIGHER, LOWER or about the SAME in 2010 compared to
                                                                                                     reported that prices
previous years, and the corresponding higher or lower purchase price (percentage
                                                                                                     were higher in 2010,
increase or decrease in 2010).
                                                                                                    and 40% reported that
Table 2.21: Buyers Reporting Change in Purchase Prices in 2010 Compared to                            prices were lower.
2008 and 2009
                             % of                       % of                           % of
                            Buyers                     Buyers                        Buyers
 Buyers Reporting          Reporting                  Reporting                     Reporting
 Change in Purchase         Higher       % Higher      Lower           % Lower        Same
 Price in 2010              Prices        Prices       Prices           Prices       Prices
 CANADA                       18%          60%           40%            46%           42%
 British Columbia             27%         117%           31%            49%           42%
 Alberta                      18%          28%           39%            41%           42%
 Saskatchewan                 24%          56%           45%            32%           32%
 Manitoba                     12%          25%           47%            45%           41%
 Ontario                      15%          47%           47%            43%           37%
 Quebec                       0%                         13%            25%           87%
 New Brunswick                50%         108%            0%                          50%
 Nova Scotia                  25%          30%           75%            75%            0%
 Prince Edward Island         20%          20%           40%            55%           40%
 Newfoundland                 0%                          0%                         100%


www.strategicequine.ca                 2010 CANADIAN HORSE INDUSTRY PROFILE STUDY                                   29
HERD SIZE     HERD PROFILE      TRENDS         VALUE & PRICES      IMPORT/EXPORT                   www.equinecanada.ca


                            Survey participants who reported that they had sold horses both in 2010 and in the
                            previous two years (2008 and 2009) were asked a corresponding question to identify
                            selling prices HIGHER, LOWER or about the SAME in 2010 and the corresponding
                            higher/lower selling prices as reported in Table 2.22.

                            Table 2.22: Sellers Reporting Change in Selling Prices in 2010 Compared to
                            2008 and 2009

                                                           % of Sellers               % of Sellers               % of Sellers
                                Sellers Reporting           Reporting                  Reporting                  Reporting
                                Change in Selling Price      Higher       % Higher      Lower        % Lower        Same
                                in 2010                      Prices        Prices       Prices        Prices       Prices
                                CANADA                        16%           39%          46%          40%           26%
                                British Columbia              12%          55%           45%          32%           30%
                                Alberta                       12%          29%           57%          41%           20%
                                Saskatchewan                  21%          25%           36%          37%           29%
                                Manitoba                      24%          30%           41%          36%           28%
                                Ontario                       20%          54%           46%          45%           23%
                                Quebec                         7%            --          43%          32%           30%
                                New Brunswick                  0%                        33%          50%           29%
 In all provinces, and          Nova Scotia                    0%                        20%          25%           57%
 all industry sectors,          Prince Edward Island          17%          30%           50%          37%           29%
   there were more              Newfoundland                   0%                       100%          100%           0%
sellers reporting lower
  prices than sellers       Table 2.23 reports the corresponding data from those selling horses during 2008
    reporting higher        through 2010 by industry sector.
         prices.
                            Table 2.23: Sellers Reporting Change in Selling Prices in 2010 by Market Sector
                                                               % of                        % of                         % of
                                                              Sellers                     Sellers                     Sellers
                                                             Reporting                   Reporting                   Reporting
                                Sellers Reporting Change      Higher       % Higher       Lower        % Lower         Same
                                in Selling Price in 2010      Prices        Prices        Prices        Prices        Prices
                                Racing                          14%          41%            36%          52%              50%
                                Sport Competition               19%          26%            49%          41%              31%
                                Breeding Sector                  6%          30%            75%          41%            19%
                                Pleasure riding/driving         16%          55%            39%          33%            45%
                                Work Horses                     15%          55%            54%          50%              31%
                                Meat Market                     17%          10%            50%          25%            33%


                            2.5 HORSES IMPORTED AND EXPORTED
                            The analysis provided to this point in the chapter addresses horses that are
                            considered to be resident in Canada in 2010. As a component of the meta analysis
                            completed as a component of this study, additional research was completed to
                            identify the number of horses imported into and exported from Canada during the
                            current five year business cycle (2005 through 2010).


    30                                        HORSES IN CANADA IN 2010                                 © EQUINE CANADA 2011
HORSES IN CANADA IN 2010


Table 2.24 reports data available from Statistics Canada and CFIA (Canadian Food
Inspection Agency) for import/export of horses during 2005 through 2010.

Table 2.24: Horses Imported and Exported 2005 through 2010

                                                                                                      Actual to
                                                                                                     September    Projected
Horses Imported                  2005          2006         2007          2008          2009           2010         2010

  Temporary Imports                   1,368      1,683         7,448         9,732       13,503          7,877       10,503
  Permanent Imports
  (Non-Processing)                    5,008      5,398         5,185         5,734           5,863       3,324        4,432
  Imports for
  Feeder/Processing                  17,324     21,709       37,727        62,200        67,761         52,487       69,983

              Total Imports          23,700     28,790       50,360        77,666        87,127         63,688       84,918

                                                                                                      Actual to
                                                                                                     September    Projected
Horses Exported                  2005          2006         2007          2008          2009           2010         2010
  Temporary Exports                  18,396           **       2,875       16,626        12,383         12,978       17,304
  Permanent Exports                  23,541           **     17,678        13,611        10,113          8,112       10,816
              Total Exports          41,937            -     20,553        30,237        22,496         21,090       28,120
Source: CFIA and Statistics Canada
** Data not available


In the telephone survey, participants who reported selling horses in the 2008 through
2010 period were asked:                                                                                    More than 35,000
               ““How many of the horses you sold since 2008 were sold to buyers outside of               horses have been sold
               Canada?””                                                                                   to export markets
                                                                                                               since 2008.
Survey participants responding, reported 15% of horses sold to out of country
buyers. For the estimated 236,000 horses sold in this period, this represents 35,425
horses sold to export markets since 2008.This is in line with the reported permanent
exports for 2008, 2009 and estimated for 2010.


www.strategicequine.ca                   2010 CANADIAN HORSE INDUSTRY PROFILE STUDY                                           31
HERD SIZE   HERD PROFILE   TRENDS   VALUE & PRICES     IMPORT/EXPORT   www.equinecanada.ca


 32                             HORSES IN CANADA IN 2010               © EQUINE CANADA 2011

Contenu connexe

En vedette

Equine Orthopedic Field Emergency
Equine Orthopedic Field EmergencyEquine Orthopedic Field Emergency
Equine Orthopedic Field EmergencyDane Tatarniuk
 
Clinical Pathology & Equine Arthropathies
Clinical Pathology & Equine ArthropathiesClinical Pathology & Equine Arthropathies
Clinical Pathology & Equine ArthropathiesDane Tatarniuk
 
Peritoneal Healing, Cow/Horse
Peritoneal Healing, Cow/HorsePeritoneal Healing, Cow/Horse
Peritoneal Healing, Cow/HorseDane Tatarniuk
 
Case Study - Cannon Bone Laceration
Case Study - Cannon Bone LacerationCase Study - Cannon Bone Laceration
Case Study - Cannon Bone LacerationDane Tatarniuk
 
Bisphosphonate Therapy in Horses
Bisphosphonate Therapy in HorsesBisphosphonate Therapy in Horses
Bisphosphonate Therapy in HorsesDane Tatarniuk
 
Large Animal Orchiectomy
Large Animal OrchiectomyLarge Animal Orchiectomy
Large Animal OrchiectomyDane Tatarniuk
 
Tenoscopy - Equine Flexor Tendon Sheath
Tenoscopy - Equine Flexor Tendon SheathTenoscopy - Equine Flexor Tendon Sheath
Tenoscopy - Equine Flexor Tendon SheathDane Tatarniuk
 
Shockwave Therapy in Horses
Shockwave Therapy in HorsesShockwave Therapy in Horses
Shockwave Therapy in HorsesDane Tatarniuk
 
Surgical Complications
Surgical ComplicationsSurgical Complications
Surgical ComplicationsDane Tatarniuk
 
Conformation by dr. beeman
Conformation by dr. beemanConformation by dr. beeman
Conformation by dr. beemanDane Tatarniuk
 
Thoracotomy in Cattle & Horses
Thoracotomy in Cattle & HorsesThoracotomy in Cattle & Horses
Thoracotomy in Cattle & HorsesDane Tatarniuk
 
Tarsal Anatomy of the Horse
Tarsal Anatomy of the HorseTarsal Anatomy of the Horse
Tarsal Anatomy of the HorseDane Tatarniuk
 
Equine Nerve & Joint Blocks
Equine Nerve & Joint BlocksEquine Nerve & Joint Blocks
Equine Nerve & Joint BlocksDane Tatarniuk
 
Platelet Rich Plasma (PRP) Therapy
Platelet Rich Plasma (PRP) TherapyPlatelet Rich Plasma (PRP) Therapy
Platelet Rich Plasma (PRP) TherapyDane Tatarniuk
 

En vedette (18)

Equine Orthopedic Field Emergency
Equine Orthopedic Field EmergencyEquine Orthopedic Field Emergency
Equine Orthopedic Field Emergency
 
Clinical Pathology & Equine Arthropathies
Clinical Pathology & Equine ArthropathiesClinical Pathology & Equine Arthropathies
Clinical Pathology & Equine Arthropathies
 
Peritoneal Healing, Cow/Horse
Peritoneal Healing, Cow/HorsePeritoneal Healing, Cow/Horse
Peritoneal Healing, Cow/Horse
 
Equine larynx
Equine larynxEquine larynx
Equine larynx
 
Case Study - Cannon Bone Laceration
Case Study - Cannon Bone LacerationCase Study - Cannon Bone Laceration
Case Study - Cannon Bone Laceration
 
Bisphosphonate Therapy in Horses
Bisphosphonate Therapy in HorsesBisphosphonate Therapy in Horses
Bisphosphonate Therapy in Horses
 
Horse Castration
Horse CastrationHorse Castration
Horse Castration
 
Large Animal Orchiectomy
Large Animal OrchiectomyLarge Animal Orchiectomy
Large Animal Orchiectomy
 
Pastern Arthrodesis
Pastern ArthrodesisPastern Arthrodesis
Pastern Arthrodesis
 
Tenoscopy - Equine Flexor Tendon Sheath
Tenoscopy - Equine Flexor Tendon SheathTenoscopy - Equine Flexor Tendon Sheath
Tenoscopy - Equine Flexor Tendon Sheath
 
Shockwave Therapy in Horses
Shockwave Therapy in HorsesShockwave Therapy in Horses
Shockwave Therapy in Horses
 
Surgical Complications
Surgical ComplicationsSurgical Complications
Surgical Complications
 
Conformation by dr. beeman
Conformation by dr. beemanConformation by dr. beeman
Conformation by dr. beeman
 
Equine Carpus Anatomy
Equine Carpus AnatomyEquine Carpus Anatomy
Equine Carpus Anatomy
 
Thoracotomy in Cattle & Horses
Thoracotomy in Cattle & HorsesThoracotomy in Cattle & Horses
Thoracotomy in Cattle & Horses
 
Tarsal Anatomy of the Horse
Tarsal Anatomy of the HorseTarsal Anatomy of the Horse
Tarsal Anatomy of the Horse
 
Equine Nerve & Joint Blocks
Equine Nerve & Joint BlocksEquine Nerve & Joint Blocks
Equine Nerve & Joint Blocks
 
Platelet Rich Plasma (PRP) Therapy
Platelet Rich Plasma (PRP) TherapyPlatelet Rich Plasma (PRP) Therapy
Platelet Rich Plasma (PRP) Therapy
 

Dernier

Whitefield CALL GIRL IN 98274*61493 ❤CALL GIRLS IN ESCORT SERVICE❤CALL GIRL
Whitefield CALL GIRL IN 98274*61493 ❤CALL GIRLS IN ESCORT SERVICE❤CALL GIRLWhitefield CALL GIRL IN 98274*61493 ❤CALL GIRLS IN ESCORT SERVICE❤CALL GIRL
Whitefield CALL GIRL IN 98274*61493 ❤CALL GIRLS IN ESCORT SERVICE❤CALL GIRLkapoorjyoti4444
 
Call Now ☎️🔝 9332606886🔝 Call Girls ❤ Service In Bhilwara Female Escorts Serv...
Call Now ☎️🔝 9332606886🔝 Call Girls ❤ Service In Bhilwara Female Escorts Serv...Call Now ☎️🔝 9332606886🔝 Call Girls ❤ Service In Bhilwara Female Escorts Serv...
Call Now ☎️🔝 9332606886🔝 Call Girls ❤ Service In Bhilwara Female Escorts Serv...Anamikakaur10
 
👉Chandigarh Call Girls 👉9878799926👉Just Call👉Chandigarh Call Girl In Chandiga...
👉Chandigarh Call Girls 👉9878799926👉Just Call👉Chandigarh Call Girl In Chandiga...👉Chandigarh Call Girls 👉9878799926👉Just Call👉Chandigarh Call Girl In Chandiga...
👉Chandigarh Call Girls 👉9878799926👉Just Call👉Chandigarh Call Girl In Chandiga...rajveerescorts2022
 
SEO Case Study: How I Increased SEO Traffic & Ranking by 50-60% in 6 Months
SEO Case Study: How I Increased SEO Traffic & Ranking by 50-60%  in 6 MonthsSEO Case Study: How I Increased SEO Traffic & Ranking by 50-60%  in 6 Months
SEO Case Study: How I Increased SEO Traffic & Ranking by 50-60% in 6 MonthsIndeedSEO
 
How to Get Started in Social Media for Art League City
How to Get Started in Social Media for Art League CityHow to Get Started in Social Media for Art League City
How to Get Started in Social Media for Art League CityEric T. Tung
 
Call Girls Jp Nagar Just Call 👗 7737669865 👗 Top Class Call Girl Service Bang...
Call Girls Jp Nagar Just Call 👗 7737669865 👗 Top Class Call Girl Service Bang...Call Girls Jp Nagar Just Call 👗 7737669865 👗 Top Class Call Girl Service Bang...
Call Girls Jp Nagar Just Call 👗 7737669865 👗 Top Class Call Girl Service Bang...amitlee9823
 
Call Girls Kengeri Satellite Town Just Call 👗 7737669865 👗 Top Class Call Gir...
Call Girls Kengeri Satellite Town Just Call 👗 7737669865 👗 Top Class Call Gir...Call Girls Kengeri Satellite Town Just Call 👗 7737669865 👗 Top Class Call Gir...
Call Girls Kengeri Satellite Town Just Call 👗 7737669865 👗 Top Class Call Gir...amitlee9823
 
Marel Q1 2024 Investor Presentation from May 8, 2024
Marel Q1 2024 Investor Presentation from May 8, 2024Marel Q1 2024 Investor Presentation from May 8, 2024
Marel Q1 2024 Investor Presentation from May 8, 2024Marel
 
Call Girls Zirakpur👧 Book Now📱7837612180 📞👉Call Girl Service In Zirakpur No A...
Call Girls Zirakpur👧 Book Now📱7837612180 📞👉Call Girl Service In Zirakpur No A...Call Girls Zirakpur👧 Book Now📱7837612180 📞👉Call Girl Service In Zirakpur No A...
Call Girls Zirakpur👧 Book Now📱7837612180 📞👉Call Girl Service In Zirakpur No A...Sheetaleventcompany
 
Call Girls Electronic City Just Call 👗 7737669865 👗 Top Class Call Girl Servi...
Call Girls Electronic City Just Call 👗 7737669865 👗 Top Class Call Girl Servi...Call Girls Electronic City Just Call 👗 7737669865 👗 Top Class Call Girl Servi...
Call Girls Electronic City Just Call 👗 7737669865 👗 Top Class Call Girl Servi...amitlee9823
 
Call Girls From Raj Nagar Extension Ghaziabad❤️8448577510 ⊹Best Escorts Servi...
Call Girls From Raj Nagar Extension Ghaziabad❤️8448577510 ⊹Best Escorts Servi...Call Girls From Raj Nagar Extension Ghaziabad❤️8448577510 ⊹Best Escorts Servi...
Call Girls From Raj Nagar Extension Ghaziabad❤️8448577510 ⊹Best Escorts Servi...lizamodels9
 
PHX May 2024 Corporate Presentation Final
PHX May 2024 Corporate Presentation FinalPHX May 2024 Corporate Presentation Final
PHX May 2024 Corporate Presentation FinalPanhandleOilandGas
 
Cheap Rate Call Girls In Noida Sector 62 Metro 959961乂3876
Cheap Rate Call Girls In Noida Sector 62 Metro 959961乂3876Cheap Rate Call Girls In Noida Sector 62 Metro 959961乂3876
Cheap Rate Call Girls In Noida Sector 62 Metro 959961乂3876dlhescort
 
Al Mizhar Dubai Escorts +971561403006 Escorts Service In Al Mizhar
Al Mizhar Dubai Escorts +971561403006 Escorts Service In Al MizharAl Mizhar Dubai Escorts +971561403006 Escorts Service In Al Mizhar
Al Mizhar Dubai Escorts +971561403006 Escorts Service In Al Mizharallensay1
 
Malegaon Call Girls Service ☎ ️82500–77686 ☎️ Enjoy 24/7 Escort Service
Malegaon Call Girls Service ☎ ️82500–77686 ☎️ Enjoy 24/7 Escort ServiceMalegaon Call Girls Service ☎ ️82500–77686 ☎️ Enjoy 24/7 Escort Service
Malegaon Call Girls Service ☎ ️82500–77686 ☎️ Enjoy 24/7 Escort ServiceDamini Dixit
 
Russian Call Girls In Rajiv Chowk Gurgaon ❤️8448577510 ⊹Best Escorts Service ...
Russian Call Girls In Rajiv Chowk Gurgaon ❤️8448577510 ⊹Best Escorts Service ...Russian Call Girls In Rajiv Chowk Gurgaon ❤️8448577510 ⊹Best Escorts Service ...
Russian Call Girls In Rajiv Chowk Gurgaon ❤️8448577510 ⊹Best Escorts Service ...lizamodels9
 
Chandigarh Escorts Service 📞8868886958📞 Just📲 Call Nihal Chandigarh Call Girl...
Chandigarh Escorts Service 📞8868886958📞 Just📲 Call Nihal Chandigarh Call Girl...Chandigarh Escorts Service 📞8868886958📞 Just📲 Call Nihal Chandigarh Call Girl...
Chandigarh Escorts Service 📞8868886958📞 Just📲 Call Nihal Chandigarh Call Girl...Sheetaleventcompany
 
FULL ENJOY Call Girls In Majnu Ka Tilla, Delhi Contact Us 8377877756
FULL ENJOY Call Girls In Majnu Ka Tilla, Delhi Contact Us 8377877756FULL ENJOY Call Girls In Majnu Ka Tilla, Delhi Contact Us 8377877756
FULL ENJOY Call Girls In Majnu Ka Tilla, Delhi Contact Us 8377877756dollysharma2066
 
Falcon Invoice Discounting: Empowering Your Business Growth
Falcon Invoice Discounting: Empowering Your Business GrowthFalcon Invoice Discounting: Empowering Your Business Growth
Falcon Invoice Discounting: Empowering Your Business GrowthFalcon investment
 

Dernier (20)

Falcon Invoice Discounting platform in india
Falcon Invoice Discounting platform in indiaFalcon Invoice Discounting platform in india
Falcon Invoice Discounting platform in india
 
Whitefield CALL GIRL IN 98274*61493 ❤CALL GIRLS IN ESCORT SERVICE❤CALL GIRL
Whitefield CALL GIRL IN 98274*61493 ❤CALL GIRLS IN ESCORT SERVICE❤CALL GIRLWhitefield CALL GIRL IN 98274*61493 ❤CALL GIRLS IN ESCORT SERVICE❤CALL GIRL
Whitefield CALL GIRL IN 98274*61493 ❤CALL GIRLS IN ESCORT SERVICE❤CALL GIRL
 
Call Now ☎️🔝 9332606886🔝 Call Girls ❤ Service In Bhilwara Female Escorts Serv...
Call Now ☎️🔝 9332606886🔝 Call Girls ❤ Service In Bhilwara Female Escorts Serv...Call Now ☎️🔝 9332606886🔝 Call Girls ❤ Service In Bhilwara Female Escorts Serv...
Call Now ☎️🔝 9332606886🔝 Call Girls ❤ Service In Bhilwara Female Escorts Serv...
 
👉Chandigarh Call Girls 👉9878799926👉Just Call👉Chandigarh Call Girl In Chandiga...
👉Chandigarh Call Girls 👉9878799926👉Just Call👉Chandigarh Call Girl In Chandiga...👉Chandigarh Call Girls 👉9878799926👉Just Call👉Chandigarh Call Girl In Chandiga...
👉Chandigarh Call Girls 👉9878799926👉Just Call👉Chandigarh Call Girl In Chandiga...
 
SEO Case Study: How I Increased SEO Traffic & Ranking by 50-60% in 6 Months
SEO Case Study: How I Increased SEO Traffic & Ranking by 50-60%  in 6 MonthsSEO Case Study: How I Increased SEO Traffic & Ranking by 50-60%  in 6 Months
SEO Case Study: How I Increased SEO Traffic & Ranking by 50-60% in 6 Months
 
How to Get Started in Social Media for Art League City
How to Get Started in Social Media for Art League CityHow to Get Started in Social Media for Art League City
How to Get Started in Social Media for Art League City
 
Call Girls Jp Nagar Just Call 👗 7737669865 👗 Top Class Call Girl Service Bang...
Call Girls Jp Nagar Just Call 👗 7737669865 👗 Top Class Call Girl Service Bang...Call Girls Jp Nagar Just Call 👗 7737669865 👗 Top Class Call Girl Service Bang...
Call Girls Jp Nagar Just Call 👗 7737669865 👗 Top Class Call Girl Service Bang...
 
Call Girls Kengeri Satellite Town Just Call 👗 7737669865 👗 Top Class Call Gir...
Call Girls Kengeri Satellite Town Just Call 👗 7737669865 👗 Top Class Call Gir...Call Girls Kengeri Satellite Town Just Call 👗 7737669865 👗 Top Class Call Gir...
Call Girls Kengeri Satellite Town Just Call 👗 7737669865 👗 Top Class Call Gir...
 
Marel Q1 2024 Investor Presentation from May 8, 2024
Marel Q1 2024 Investor Presentation from May 8, 2024Marel Q1 2024 Investor Presentation from May 8, 2024
Marel Q1 2024 Investor Presentation from May 8, 2024
 
Call Girls Zirakpur👧 Book Now📱7837612180 📞👉Call Girl Service In Zirakpur No A...
Call Girls Zirakpur👧 Book Now📱7837612180 📞👉Call Girl Service In Zirakpur No A...Call Girls Zirakpur👧 Book Now📱7837612180 📞👉Call Girl Service In Zirakpur No A...
Call Girls Zirakpur👧 Book Now📱7837612180 📞👉Call Girl Service In Zirakpur No A...
 
Call Girls Electronic City Just Call 👗 7737669865 👗 Top Class Call Girl Servi...
Call Girls Electronic City Just Call 👗 7737669865 👗 Top Class Call Girl Servi...Call Girls Electronic City Just Call 👗 7737669865 👗 Top Class Call Girl Servi...
Call Girls Electronic City Just Call 👗 7737669865 👗 Top Class Call Girl Servi...
 
Call Girls From Raj Nagar Extension Ghaziabad❤️8448577510 ⊹Best Escorts Servi...
Call Girls From Raj Nagar Extension Ghaziabad❤️8448577510 ⊹Best Escorts Servi...Call Girls From Raj Nagar Extension Ghaziabad❤️8448577510 ⊹Best Escorts Servi...
Call Girls From Raj Nagar Extension Ghaziabad❤️8448577510 ⊹Best Escorts Servi...
 
PHX May 2024 Corporate Presentation Final
PHX May 2024 Corporate Presentation FinalPHX May 2024 Corporate Presentation Final
PHX May 2024 Corporate Presentation Final
 
Cheap Rate Call Girls In Noida Sector 62 Metro 959961乂3876
Cheap Rate Call Girls In Noida Sector 62 Metro 959961乂3876Cheap Rate Call Girls In Noida Sector 62 Metro 959961乂3876
Cheap Rate Call Girls In Noida Sector 62 Metro 959961乂3876
 
Al Mizhar Dubai Escorts +971561403006 Escorts Service In Al Mizhar
Al Mizhar Dubai Escorts +971561403006 Escorts Service In Al MizharAl Mizhar Dubai Escorts +971561403006 Escorts Service In Al Mizhar
Al Mizhar Dubai Escorts +971561403006 Escorts Service In Al Mizhar
 
Malegaon Call Girls Service ☎ ️82500–77686 ☎️ Enjoy 24/7 Escort Service
Malegaon Call Girls Service ☎ ️82500–77686 ☎️ Enjoy 24/7 Escort ServiceMalegaon Call Girls Service ☎ ️82500–77686 ☎️ Enjoy 24/7 Escort Service
Malegaon Call Girls Service ☎ ️82500–77686 ☎️ Enjoy 24/7 Escort Service
 
Russian Call Girls In Rajiv Chowk Gurgaon ❤️8448577510 ⊹Best Escorts Service ...
Russian Call Girls In Rajiv Chowk Gurgaon ❤️8448577510 ⊹Best Escorts Service ...Russian Call Girls In Rajiv Chowk Gurgaon ❤️8448577510 ⊹Best Escorts Service ...
Russian Call Girls In Rajiv Chowk Gurgaon ❤️8448577510 ⊹Best Escorts Service ...
 
Chandigarh Escorts Service 📞8868886958📞 Just📲 Call Nihal Chandigarh Call Girl...
Chandigarh Escorts Service 📞8868886958📞 Just📲 Call Nihal Chandigarh Call Girl...Chandigarh Escorts Service 📞8868886958📞 Just📲 Call Nihal Chandigarh Call Girl...
Chandigarh Escorts Service 📞8868886958📞 Just📲 Call Nihal Chandigarh Call Girl...
 
FULL ENJOY Call Girls In Majnu Ka Tilla, Delhi Contact Us 8377877756
FULL ENJOY Call Girls In Majnu Ka Tilla, Delhi Contact Us 8377877756FULL ENJOY Call Girls In Majnu Ka Tilla, Delhi Contact Us 8377877756
FULL ENJOY Call Girls In Majnu Ka Tilla, Delhi Contact Us 8377877756
 
Falcon Invoice Discounting: Empowering Your Business Growth
Falcon Invoice Discounting: Empowering Your Business GrowthFalcon Invoice Discounting: Empowering Your Business Growth
Falcon Invoice Discounting: Empowering Your Business Growth
 

Equine Canada Horse Census 2010

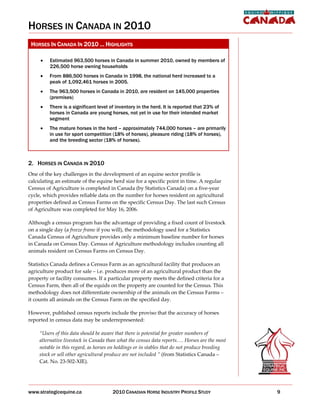
  • 1. HORSES IN CANADA IN 2010 HORSES IN CANADA IN 2010 …… HIGHLIGHTS Estimated 963,500 horses in Canada in summer 2010, owned by members of 226,500 horse owning households From 886,500 horses in Canada in 1998, the national herd increased to a peak of 1,092,461 horses in 2005. The 963,500 horses in Canada in 2010, are resident on 145,000 properties (premises) There is a significant level of inventory in the herd. It is reported that 23% of horses in Canada are young horses, not yet in use for their intended market segment The mature horses in the herd –– approximately 744,000 horses –– are primarily in use for sport competition (18% of horses), pleasure riding (18% of horses), and the breeding sector (18% of horses). 2. HORSES IN CANADA IN 2010 One of the key challenges in the development of an equine sector profile is calculating an estimate of the equine herd size for a specific point in time. A regular Census of Agriculture is completed in Canada (by Statistics Canada) on a five year cycle, which provides reliable data on the number for horses resident on agricultural properties defined as Census Farms on the specific Census Day. The last such Census of Agriculture was completed for May 16, 2006. Although a census program has the advantage of providing a fixed count of livestock on a single day (a freeze frame if you will), the methodology used for a Statistics Canada Census of Agriculture provides only a minimum baseline number for horses in Canada on Census Day. Census of Agriculture methodology includes counting all animals resident on Census Farms on Census Day. Statistics Canada defines a Census Farm as an agricultural facility that produces an agriculture product for sale –– i.e. produces more of an agricultural product than the property or facility consumes. If a particular property meets the defined criteria for a Census Farm, then all of the equids on the property are counted for the Census. This methodology does not differentiate ownership of the animals on the Census Farms –– it counts all animals on the Census Farm on the specified day. However, published census reports include the proviso that the accuracy of horses reported in census data may be underrepresented: ““Users of this data should be aware that there is potential for greater numbers of alternative livestock in Canada than what the census data reports……. Horses are the most notable in this regard, as horses on holdings or in stables that do not produce breeding stock or sell other agricultural produce are not included ”” (from Statistics Canada –– Cat. No. 23 502 XIE). www.strategicequine.ca 2010 CANADIAN HORSE INDUSTRY PROFILE STUDY 9
  • 2. HERD SIZE HERD PROFILE TRENDS VALUE & PRICES IMPORT/EXPORT www.equinecanada.ca 2.1 ESTIMATED HERD SIZE For the purposes of calculating an estimated herd size in 2010, data from the 2006 Census is analyzed in combination with data acquired from the 2010 telephone research surveys. The analysis was completed in two stages: Calculating the number of horses in Canada in summer 2006 (i.e. actual number of horses on Census Farms in May 2006, plus an estimate of the number of horses not included in the 2006 Census of Agriculture count) Calculating an estimated number of horses in Canada during summer 2010, based on reported increase (or decrease) in horse ownership for those surveyed during summer 2010. The 2006 Census of Agriculture, reports a total of 453,965 equids resident on 54,169 Census Farms. Table 2.1: Horses Reported –– Statistics Canada Census of Agriculture 2006 Census Horses Average Statistics Canada Census of Census Horses by Farms By Resident on Horses per Agriculture 2006 Farms Province Province Census Farms Census Farm CANADA 54,169 453,965 8.38 British Columbia 6,697 12% 53,246 12% 7.95 Alberta 17,219 32% 155,533 34% 9.03 Saskatchewan 8,531 16% 65,914 15% 7.73 Manitoba 3,646 7% 46,580 10% 12.78 Ontario 12,333 23% 97,285 21% 7.89 Quebec 4,259 8% 26,522 6% 6.23 New Brunswick 476 1% 2,973 1% 6.25 Nova Scotia 643 1% 3,705 1% 5.76 Prince Edward Island 288 1% 1,921 <1% 6.67 Newfoundland 77 <1% 286 <1% 3.71 Telephone interview participants were asked a series of questions related to horse ownership per family unit (or per horse site), and to identify property ownership of Census Farms, and the number of horses resident on Census Farms during the 2006 Census of Agriculture. Estimates for the number of foals born in 2006 after the May 16th Census Day, were calculated based on data for pedigree registrations for the 2006 foal year. Data from pedigree registration records for 2006 was compared to research data from the 2003 Canadian Horse Industry Study to calculate an estimated number of non pedigree horses on the ground in summer 2006. 10 HORSES IN CANADA IN 2010 © EQUINE CANADA 2011
  • 3. HORSES IN CANADA IN 2010 The resulting analysis reports a total herd size of 1,043,433 horses in summer 2006. Table 2.2: Estimated Herd Size Summer 2006 –– Based on Survey Results Non- Horses Foals Census Horses on Est. # of on Born Properties Non- Horses in Horses Estimated Herd Size in Census Summer with Census Summer by Summer 2006 Farms 2006 Horses Properties 2006 Province CANADA 453,965 18,896 90,437 506,722 1,043,433 100% British Columbia 53,246 1,512 14,249 59,442 125,570 12.0% Alberta 155,533 4,724 26,905 335,980 32.2% 191,743 Saskatchewan 65,914 3,779 12,546 36,807 127,395 12.2% Manitoba 46,580 4,157 4,995 15,363 67,287 6.4% Ontario 97,285 3,779 17,874 99,936 229,243 22.0% Quebec 26,522 378 10,140 85,100 131,981 12.6% New Brunswick 2,973 567 1,253 6,660 10,178 1.0% Nova Scotia 3,705 - 1,340 4,495 8,445 0.8% Prince Edward Island 1,921 - 543 1,479 4,610 0.4% Newfoundland 286 592 1,114 1,369 0.1% - It should be noted that a Census of Agriculture reports ALL horses on a Census Farm, whether those horses are owned by the farm owner, or belong to Figure 2.1: Horses By another owner. Horses boarded on Census Farms are included in the count Province in Summer 2006 of horses on Census Day. Table 2.2 includes horses boarded on Non Census PE NL NS <1% <1% properties in the estimated totals, based on the 2010 <1% survey results for horse owners who reported Horses by Province NB Summer 2006 boarding horses on their Non Census property in 1% 2006. QC BC In the telephone survey, participants were asked a 12% 12% series of questions to identify potential increase, or decrease in the number of horses owned over the previous five years (since 2006). Analysis of the ON resulting responses was used to estimate the 22% number of horses in Canada in 2010 as outlined in AB 32% Table 2.3. MB 6% SK 12% www.strategicequine.ca 2010 CANADIAN HORSE INDUSTRY PROFILE STUDY 11
  • 4. HERD SIZE HERD PROFILE TRENDS VALUE & PRICES IMPORT/EXPORT www.equinecanada.ca Table 2.3: Estimated Herd Size Summer 2010 –– Based on Survey Results Est. # of Non- % of # of Census Est. Total Horses on Horses on Est. # of Horses Census Properties Properties Census Non-Census Horses in by Estimated Herd Size in Farms with Horses with Horses Farms in Properties in Summer Province Summer 2010 (2006) in 2010 in 2010 2010 2010 2010 in 2010 CANADA 59,037 85,963 145,000 483,364 478,786 963,500 100% British Columbia 6,177 15,423 21,600 54,736 61,264 116,000 12.0% Alberta 17,249 26,801 44,050 159,988 153,512 313,500 32.5% Saskatchewan 9,930 4,780 14,710 65,801 42,999 108,800 11.3% Manitoba 4,119 1,858 5,977 39,683 16,317 56,000 5.8% Ontario 13,594 20,664 34,258 108,575 103,925 212,500 22.1% Quebec 5,891 13,468 19,359 44,034 85,466 129,500 13.4% New Brunswick 674 1,490 2,164 4,820 7,680 12,500 1.3% Nova Scotia 850 799 1,649 3,312 4,688 8,000 0.8% Prince Edward Island 432 288 720 2,186 1,814 4,000 0.4% Newfoundland 121 392 513 229 1,121 1,350 0.1% Yukon/NT - - - - 1,350 0.1% Figure 2.2: Horses By For the purposes of this study, it is estimated that the national herd includes 963,500 Province in Summer horses in 2010. 2010 Data on the number of premises (properties) with PE NL Horses by Province horses in 2010 –– both Census Farms and non Census <1% <1% Summer 2010 properties –– was used to develop an estimate of the NS number of horse owning households in Canada in <1% 2010. NB YT / NT 1% In the telephone survey, participants were asked <1% QC BC questions to identify the percentage of owners who 13% 12% reside on the same property as the horses they own, and the status of the property as either a Census Farm (as defined by Statistics Canada for a Census of Agriculture) or a non Census property. Table 2.4 ON AB 22% 33% outlines the estimated number of horse owner households. MB For the purposes of this study, it is estimated that the 6% SK 963,500 horses in Canada are owned by members of 11% 226,500 horse owning households, and kept (are resident) on 145,000 premises in Canada. 12 HORSES IN CANADA IN 2010 © EQUINE CANADA 2011
  • 5. HORSES IN CANADA IN 2010 Table 2.4: Estimated Number of Horse Owning Households in 2010 % of Owners Est. # of Avg. # of Avg. # of Properties and Horse- Est. Total Who Live on Owner Horses per Horses Owning Households in Properties with Horse Households Total # of Owner per Site / 2010 Horses in 2010 Property by Province Horses Household Premises CANADA 145,000 64% 226,500 963,500 4.3 6.6 British Columbia 21,600 66% 32,700 116,000 3.5 5.4 Alberta 44,050 70% 62,300 313,500 5.0 7.1 Saskatchewan 14,710 79% 18,600 108,800 5.8 7.4 Manitoba 5,977 84% 7,100 56,000 7.9 9.4 Ontario 34,258 57% 60,100 212,500 3.5 6.2 Quebec 19,359 53% 36,500 129,500 3.5 6.7 New Brunswick 2,164 66% 3,780 12,500 3.3 5.8 Nova Scotia 1,649 81% 2,000 8,000 4.0 4.9 Prince Edward Island 720 60% 1,200 4,000 3.3 5.6 Newfoundland 513 42% 1,220 1,350 1.1 2.6 Yukon/NT - 78% 1,000 1,350 1 - The estimated number of premises with horses in Canada (in 2010) is considered to be the locations where horses are normally resident. It does not include sites where horses may be temporarily resident such as racetracks, training centres, veterinarian There are an clinics, exhibitions, etc. estimated 145,000 properties with horses 2.2 EQUINE HERD PROFILE in 2010, not including Equids in Canada are predominantly in use (or bred for use) in what is now defined sites where horses as the entertainment/leisure sector of the Canadian economy. The specific use of may be temporarily animals, whether for racing, non racing competition, recreational riding, ranching resident. and farm work, or other activities, impacts both capital investment in livestock and facilities, as well as the annual expenditure for the care of animals. To develop an accurate estimate of the economic impact generated by the care of horses and activities of Canadians and their horses, an analysis of the primary use of horses across the country is required. For the purposes of this study, the industry is categorized by the following sectors: Racing Non racing competition Pleasure riding Breeding Stock Riding school or riding lessons Tourist activities Work (i.e. ranching, logging, etc.) Companionship (or full retirement) PMU production Meat production Horse owners were asked to quantify how many of their horses are young horses not yet in use, as well as defining a primary use for their mature horses. Table 2.5 reports www.strategicequine.ca 2010 CANADIAN HORSE INDUSTRY PROFILE STUDY 13
  • 6. HERD SIZE HERD PROFILE TRENDS VALUE & PRICES IMPORT/EXPORT www.equinecanada.ca the percentages of horses in each province categorized as Young Horses Not Yet In Use or Mature Horses. There are Table 2.5: Young Horses and Mature Horses by Province approximately Estimated 220,000 young horses Estimated Mature in the 2010 herd –– Total % Young Young Horses In horses categorized as 2010 Young / Mature Horses Horses Horses Horses Use ““Not Yet In Use””. CANADA 963,500 23% 219,884 743,616 British Columbia 116,000 17% 19,720 96,280 Alberta 313,500 29% 90,915 222,585 Saskatchewan 108,800 28% 30,464 78,336 Manitoba 56,000 23% 12,880 43,120 Ontario 212,500 22% 46,750 165,750 Quebec 129,500 12% 15,540 113,960 New Brunswick 12,500 13% 1,625 10,875 Nova Scotia 8,000 13% 1,040 6,960 Prince Edward Island 4,000 18% 720 3,280 Newfoundland 1,350 7% 95 1,255 Yukon/NT 1,350 10% 135 1,215 Recognizing that individual horses are often used for more than one type of activity, survey participants were asked to assign the primary use to the mature horses they own, and the intended use for young horses. Table 2.6 and Table 2.7 report the estimated number of horses in the country by primary use –– by sector. Table 2.6: Horses by Primary Use Estimated Horses by Horses Primary Use % of Horses Primary Use Of the mature horses Young Horses Not Yet in Use 22.8% 219,884 in the herd, 175,000 Racing (including breeding for racing) 5.4% 52,029 are in use in the sport competition sector, Sport Competition other than racing 18.2% 175,357 172,000 in the Pleasure riding & driving 17.8% 171,503 pleasure riding sector, Breeding stock 18.3% 176,321 and 176,000 as Riding lessons 2.3% 22,161 breeding stock. Commercial trail rides, sleigh rides or tourist activities 0.9% 8,672 Work (ranching, logging, farming, etc.) 3.4% 32,759 Companionship or full retirement 3.5% 33,723 PMU production 0.4% 3,854 Meat production 0.7% 6,745 OTHER USES 6.3% 60,701 14 HORSES IN CANADA IN 2010 © EQUINE CANADA 2011
  • 7. HORSES IN CANADA IN 2010 Table 2.7 Young Horses –– Intended Primary Use Estimated Horses by Intended Use for Young Horses % of Horses Primary Use Total Young Horses Not Yet In Use 219,884 Sport Competition -- FEI disciplines 31.0% 68,164 Sport Competition -- Western sport disciplines 17.0% 37,380 Racing 9.0% 19,790 Breed sport competition 1.0% 2,199 Pleasure Riding 24.0% 52,772 Breeding stock 6.0% 13,193 Ranch work / farm work 7.0% 15,392 Meat production 2.0% 4,398 OTHER USES 2.0% 4,398 The number of horses in each sector varies from province to province, with the western provinces hosting the largest percentage of the breeding sector –– both breeding stock and young horses not yet in use. Figure 2.3: Primary Use of Horses in Canada in 2010 Commercial Companionship Horses Primary Use Activities Work 4% PMU Production 1% 3% <1% The category of OTHER USES was undefined. Where an Production survey Meat individual Riding Lessons participant was unwilling to assign a single primary use to horses, they were 1% Breed Sport 2% Competitions included in the OTHER USES category. Figure 2.4 below reports the primary use for OTHER USES 6% <1% horses in each provincial region. Figure 2.4: Primary Use of Horses –– By Province Racing 3% Pleasure Riding Breeding Stock 7% 17% Young Horses Sport Competition Breeding Not Yet In Use Western Stock 23% 4% 2% Pleasure Riding Work 18% 2% Sport Competition FEI Disciplines 9% Meat Sport Competition Production 18% <1% Racing OTHER USES 5% 1% www.strategicequine.ca 2010 CANADIAN HORSE INDUSTRY PROFILE STUDY 15
  • 8. HERD SIZE HERD PROFILE TRENDS VALUE & PRICES IMPORT/EXPORT www.equinecanada.ca The Other Uses category in the questionnaire was undefined. If an individual survey participant was unwilling (or unable) to assign a single primary use to one or more of their horses, the horse was included in the Other Uses category. The percentage of horses that are included in each Primary Use category varies between provincial regions. Figure 2.4 reports primary use categories for horses in each province/territory. Figure 2.4: Primary Use of Horses by Province OTHER USES -- <1% Racing -- 2% British Columbia Young Horses Companionship -- Not Yet in Use -- Young Horses Not Yet in Use -- 19,720 4% 17% Racing -- 2,668 Sport Competition -- Sport Competition -- 28,072 Work -- 7% 24% Pleasure riding -- 37,932 Commercial Breeding stock -- 11,556 activites -- 3% Riding lessons -- 2,784 Breeding Commercial activites -- 2,900 Stock -- 9% Riding Pleasure Riding -- Work -- 7,076 lessons -- 2% 33% Companionship -- 4,176 PMU production -- 0 Meat production -- 0 OTHER USES -- 116 OTHER Meat USES -- 2% Racing -- 2% Alberta Production -- <1% Young Horses Young Horses Not Yet in Use -- 90,915 Companionship -- 3% Not Yet in Use -- Racing -- 4,703 29% Sport Competition -- 70,851 Commercial Work -- 4% Pleasure riding -- 49,220 Activites -- 1% Breeding stock -- 63,641 Sport Competition -- 23% Riding lessons -- 3,135 Riding Lessons -- 1% Commercial activites -- 4,076 Breeding Work -- 12,854 Stock -- 20% Pleasure Riding -- Companionship -- 8,778 16% PMU production -- 0 Meat production -- 0 OTHER USES -- 5,643 16 HORSES IN CANADA IN 2010 © EQUINE CANADA 2011
  • 9. HORSES IN CANADA IN 2010 OTHER Meat USES -- <1% Saskatchewan Production -- 1% Racing -- 2% Young Horses Not Yet in Use -- Young Horses Not Yet in Use -- 30,464 PMU Production -- <1% 28% Racing -- 2,176 Companionship -- Sport Competition -- 14,579 Commercial 7% Pleasure riding -- 20,563 Activites -- <1% Sport Competition -- Breeding stock -- 28,070 13% Riding Riding lessons -- 2,285 Lessons -- 2% Commercial activites -- 435 Work -- <1% Breeding Pleasure Riding -- Work -- 435 Stock -- 29% 19% Companionship -- 7,725 PMU production -- 0 Meat production -- 762 OTHER USES -- 109 PMU Manitoba Production -- 2% Young Horses Not Yet in Use -- 12,880 Companionship -- Meat OTHER Racing -- 2,016 1% Production -- 7% USES -- 25% Sport Competition -- 6,272 Work -- 2% Young Horses Not Yet in Use -- Pleasure riding -- 3,976 23% Breeding stock -- 12,992 Riding Lessons -- <1% Riding lessons -- 280 Breeding Stock -- 23% Racing -- 4% Commercial activites -- 0 Sport Competition -- Work -- 952 11% Companionship -- 728 Pleasure Riding -- 7% PMU production -- 1,120 Meat production -- 4,144 OTHER USES -- 10,640 OTHER USES -- 2% Ontario Young Horses Not Yet in Use -- Young Horses Not Yet in Use -- 46,750 Work -- <1% 22% Racing -- 13% Racing -- 26,563 Companionship -- 8% Sport Competition -- 43,350 Commercial Activites -- <1% Pleasure riding -- 35,275 Riding Breeding stock -- 30,175 Lessons -- 4% Riding lessons -- 9,138 Sport Competition -- Commercial activites -- 1,488 Breeding 20% Stock -- 14% Work -- 1,913 Companionship -- 13,388 Pleasure Rding -- PMU production -- 0 17% Meat production -- 0 OTHER USES -- 3,400 www.strategicequine.ca 2010 CANADIAN HORSE INDUSTRY PROFILE STUDY 17
  • 10. HERD SIZE HERD PROFILE TRENDS VALUE & PRICES IMPORT/EXPORT www.equinecanada.ca OTHER USES -- 2% Companionship -- Racing -- Quebec Young Horses 7% 2% Young Horses Not Yet in Use -- 15,540 Not Yet in Use -- 12% Racing -- 8,547 Commercial Sport Competition -- Activites -- 1% Sport Competition -- 27,843 Riding 22% Pleasure riding -- 50,894 Work -- <1% Lessons -- 7% Breeding stock -- 11,914 Breeding Riding lessons -- 9,065 Stock -- 9% Commercial activites -- 1,684 Work -- 130 Pleasure Riding -- 39% Companionship -- 2,590 PMU production -- 0 Meat production -- 0 OTHER USES -- 2,072 OTHER USES -- 3% Maritimes - Combined Young Horses Companionship -- Racing -- 18% Young Horses Not Yet in Use -- 3,480 Not Yet in Use -- 4% 14% Racing -- 4,652 Sport Competition -- 5,518 Commercial Work -- 4% Pleasure riding -- 4,210 Activites -- 1% Breeding stock -- 4,317 Sport Competition -- Riding lessons -- 631 21% Riding Commercial activites -- 304 Lessons -- 2% Breeding Work -- 909 Stock -- 17% Pleasure Riding -- 16% Companionship -- 981 PMU production -- 0 Meat production -- 0 OTHER USES -- 779 Note: Maritimes –– Combined includes New Brunswick, Nova Scotia, Prince Edward Island and Newfoundland Those interviewed were also asked to define the percentage of horses owned that are registered with pedigree registries –– or potentially would qualify for registration with a pedigree registry –– through the following questions: ““How many of your horses are registered with a pedigree breed registry?”” ““Do you own other horses that could be, but are not as of yet, registered with a registry?”” From the resulting responses, 85% of horse owners reported that they own one or more registered horses –– reporting that 74% of horses owned are registered with a pedigree registry. When asked whether they owned horses that were eligible for registration, but not yet registered, 18% of horse owners reported that they owned 18 HORSES IN CANADA IN 2010 © EQUINE CANADA 2011
  • 11. HORSES IN CANADA IN 2010 pedigree horses that were not yet registered –– 6% of horses owned. When asked if they intended to register these horses with a pedigree registry, less than half (42%) of these owners expected to register their eligible, unregistered horses with a pedigree registry –– intending to register 57% of their eligible horses. For those reporting that they own active stallions at stud, 97% of active stallions are registered with a pedigree registry. For those reporting mares active in breeding, 64% of mares are registered with a pedigree registry. Owners of registered horses were asked: ““How many of your horses have registration papers from a Canadian registry?”” The responses indicated that, of the registered horses in Canada, 54% are registered with a Canadian pedigree registry. Table 2.8: Pedigree Registered Horses in 2010 YT/ Registered Horses Canada BC AB SK MB ON QC NB NS PE NL NT % of horses registered with a pedigree breed 74% 72% 85% 76% 64% 75% 81% 90% 90% 100% 68% 75% registry % of horses with registration papers from 10% 13% 12% 4% 6% 9% 17% 17% 10% 44% 4% 0% more than one registry % of horses with registration papers from 54% 48% 59% 36% 51% 61% 63% 78% 64% 81% 63% 69% a Canadian registry % of horses eligible for registration -- not yet 6% 8% 5% 5% 7% 8% 7% 10% 4% 4% 7% 0% registered % of owners who expect to register eligible 42% 30% 49% 42% 40% 45% 46% 54% 30% 75% 100% 0% horses 2.3 MULTI-YEAR TRENDS FOR HORSES IN CANADA Multi year trends for horses in Canada –– and premises (properties) with horses –– shows a pattern for five year cycles for overall increase/decrease in herd size. Table 2.9 reports the Census of Agriculture data for horses (and farms reporting horses) for the 1981 through 2006 period. www.strategicequine.ca 2010 CANADIAN HORSE INDUSTRY PROFILE STUDY 19
  • 12. HERD SIZE HERD PROFILE TRENDS VALUE & PRICES IMPORT/EXPORT www.equinecanada.ca Table 2.9: Census of Agriculture 1981 to 2006 CANADA 1981 1986 1991 1996 2001 2006 # of Horses 358,122 394,953 356,201 443,889 460,569 453,965 # of Farms Reporting 69,178 69,148 58,509 56,707 53,925 54,169 Avg. # per farm 5.2 5.7 6.1 7.8 8.5 8.4 % change % change % change % change % change CANADA '81 to '86 '86 to '91 '91 to '96 '96 to '01 '01 to '06 # of Horses 10% -10% 25% 4% -1% # of Farms Reporting 0% -15% -3% -5% 0% Avg. # per farm 10% 7% 28% 9% -1% While the overall number of horses is relatively stable over the 1981 to 1991 period, examination of five year cycles shows a 10% increase in herd size during 1981 through 1986, followed by a 10% decrease during 1986 to 1991. Significant growth in herd size is reported for the 1991 through 1996 period, reflecting the development and expansion of the PMU (pregnant mare urine) production sector in Western Canada. Growth in overall herd size continues through the 2001 Census, and starts to show a reduction in number of horses reflected in the 2006 Census results. Trends for number of horses per province from Census of Agriculture reports is outlined in Table 2.10. Table 2.10: Horses by Province –– Census of Agriculture 1981 to 2006 # of Horses Reported 1981 1986 1991 1996 2001 2006 British Columbia 39,356 42,034 39,785 49,305 53,366 53,246 Alberta 118,708 135,025 109,237 149,960 159,962 155,533 Saskatchewan 60,180 67,484 53,843 66,372 71,306 65,914 Manitoba 31,284 40,691 44,130 68,783 62,791 46,580 Ontario 74,986 74,961 75,132 76,553 83,337 97,285 Quebec 24,682 25,481 25,787 25,108 22,284 26,522 New Brunswick 2,972 3,339 3,133 2,757 2,661 2,973 Nova Scotia 3,297 3,171 2,957 2,907 3,009 3,705 Prince Edward Island 2,317 2,357 1,891 1,869 1,565 1,921 Newfoundland 340 410 309 275 288 286 A complete report of Census of Agriculture data for 1981 through 2006 is included in the Appendices of this report. Strategic Equine research for the 1998 through 2010 period reports herd size for the period based on national research studies completed in 1998, 2003 and 2010. Table 2.11 reports estimated number of horses by province for the period. 20 HORSES IN CANADA IN 2010 © EQUINE CANADA 2011
  • 13. HORSES IN CANADA IN 2010 Table 2.11: Estimated Number of Horses by Province 1998 to 2010 Estimated Herd Size Strategic Equine Research 1998 2003 2005 2006 2007 2010 CANADA 886,500 950,000 1,092,461 1,043,433 994,401 963,500 British Columbia 114,000 135,000 127,473 125,570 123,667 116,000 Alberta 308,500 300,000 356,250 335,980 315,710 313,500 Saskatchewan 123,000 125,000 135,492 127,395 119,298 108,800 Manitoba 71,000 110,000 72,351 67,287 62,222 56,000 Ontario 189,250 194,000 236,901 229,243 221,585 212,500 Quebec 63,000 65,000 137,620 131,981 126,341 129,500 New Brunswick 10,500 11,000 10,008 10,178 10,348 12,500 Nova Scotia 5,000 6,000 8,969 8,445 7,920 8,000 Prince Edward Island 1,500 2,500 4,520 4,610 4,700 4,000 Newfoundland 750 1,500 1,527 1,369 1,210 1,350 Yukon/NT 1,350 1,375 1,400 1,350 Analysis of the resulting data indicates an increase in the number of horses in Canada during the 2003 through 2005 period, to an estimated 1,000,000 horses in 2005, followed by decreases in the 2006 through 2007 period. Figure 2.5: Horses in Canada 1998 to 2010 Strategic Equine Research Trend for Herd Size 1998 2010 1,200,000 1,000,000 800,000 600,000 400,000 200,000 1998 2003 2005 2006 2007 2010 CANADA The trend for increase or decrease in herd size varies between provinces, reflecting the different business models for the different regions of the country. Figure 2.6 charts the trends for increase/decrease in herd size for each province for the 1998 through 2010 period. www.strategicequine.ca 2010 CANADIAN HORSE INDUSTRY PROFILE STUDY 21
  • 14. HERD SIZE HERD PROFILE TRENDS VALUE & PRICES IMPORT/EXPORT www.equinecanada.ca Figure 2.6: Trends for Herd Size By Province Trend for Herd Size 1998 2010 Trend for Herd Size 1998 2010 140,000 370,000 135,000 360,000 350,000 130,000 340,000 125,000 330,000 120,000 320,000 115,000 310,000 300,000 110,000 290,000 105,000 280,000 100,000 270,000 1998 2003 2005 2006 2007 2010 1998 2003 2005 2006 2007 2010 British Columbia Alberta Trend for Herd Size 1998 2010 Trend for Herd Size 1998 2010 160,000 120,000 140,000 100,000 120,000 100,000 80,000 80,000 60,000 60,000 40,000 40,000 20,000 20,000 1998 2003 2005 2006 2007 2010 1998 2003 2005 2006 2007 2010 Saskatchewan Manitoba Trend for Herd Size 1998 2010 Trend for Herd Size 1998 2010 250,000 160,000 140,000 200,000 120,000 150,000 100,000 80,000 100,000 60,000 50,000 40,000 20,000 1998 2003 2005 2006 2007 2010 1998 2003 2005 2006 2007 2010 Ontario Quebec 22 HORSES IN CANADA IN 2010 © EQUINE CANADA 2011
  • 15. HORSES IN CANADA IN 2010 Trend for Herd Size 1998 2010 Trend for Herd Size 1998 2010 14,000 10,000 9,000 12,000 8,000 10,000 7,000 8,000 6,000 5,000 6,000 4,000 4,000 3,000 2,000 2,000 1,000 1998 2003 2005 2006 2007 2010 1998 2003 2005 2006 2007 2010 New Brunswick Nova Scotia Trend for Herd Size 1998 2010 Trend for Herd Size 1998 2010 5,000 1,800 4,500 1,600 4,000 1,400 3,500 1,200 3,000 1,000 2,500 800 2,000 1,500 600 1,000 400 500 200 1998 2003 2005 2006 2007 2010 1998 2003 2005 2006 2007 2010 Prince Edward Island Newfoundland A series of questions were asked to identify trends for potential future growth (or contraction) in the herd size: Five years from now, do you expect to own MORE, LESS or the SAME number of horses as you do today? Only 19% of horse owners expect to own Next year, do you expect to own MORE, LESS or the SAME number of more horses in five horses as you do today? years time –– 30% expect to own Survey responses reported that only 19% of horse owners expect to own more horses fewer horses in five in five years time –– while 30% of current horse owners expect to own less (fewer) years time. horses in 2015 than they own in 2010. From survey responses, 19% of horse owners expect to own fewer horses in one year (2011) compared to horses owned in 2010. Table 2.12 reports the expectation to own for current horse owners in 2015 and 2011 compared to horses owned in 2010. www.strategicequine.ca 2010 CANADIAN HORSE INDUSTRY PROFILE STUDY 23
  • 16. HERD SIZE HERD PROFILE TRENDS VALUE & PRICES IMPORT/EXPORT www.equinecanada.ca Table 2.12: Expectation to Own Horses in the Future by Province Expectation to Own in Five Year's Time Expectation to Own in One Year's Time Expect to Expect to Expect to Expect to Expect to Expect to % of Owners Responding with Own MORE Own FEWER Own SAME # Own MORE Own FEWER Own SAME # an Expectation to Own …… Horses Horses of Horses Horses Horses of Horses CANADA 19.0% 30.0% 51.0% 13.0% 19.0% 67.0% British Columbia 20.0% 28.0% 53.0% 13.0% 17.0% 72.0% Alberta 20.0% 32.0% 46.0% 15.0% 23.0% 60.0% Saskatchewan 21.0% 32.0% 46.0% 16.0% 23.0% 60.0% Manitoba 12.0% 46.0% 41.0% 7.0% 27.0% 65.0% Ontario 17.0% 29.0% 53.0% 12.0% 18.0% 69.0% Quebec 25.0% 14.0% 62.0% 18.0% 9.0% 74.0% New Brunswick 17.0% 29.0% 54.0% 12.0% 19.0% 69.0% Nova Scotia 13.0% 44.0% 42.0% 11.0% 31.0% 57.0% Prince Edward Island 16.0% 36.0% 48.0% 12.0% 20.0% 68.0% Newfoundland 26.0% 16.0% 58.0% 11.0% 5.0% 84.0% Yukon/NT 11.0% 33.0% 56.0% 11.0% 22.0% 67.0% Two provinces, Quebec and Newfoundland, are the only regions of the country where the number of horse owners who expect to own more horses is greater than the number of owners who expect to reduce the number of horses they own in 2010. It is expected that Quebec and Newfoundland will show continued growth in herd size over the next five year period. Data from pedigree registries for foal registrations shows a steady trend for decreased number of foal registrations during the 2003 through 2010 period. Table 2.13: Annual Foal Production Trend 2003 to 2009 % of horses Est. # of Annual Est. Non Annual Foal Crop registered with registered Foal Crop Pedigree Total 2003 to 2009 pedigree registry horses Registered Foal Crop Foal Crop 2010 70.0% 674,450 *Note foal *2009 68.5% 702,821 22,753 10,463 33,216 registrations may be incomplete, due *2008 68.0% 681,221 26,451 12,448 38,899 to rules that allow 2007 67.5% 671,221 26,210 12,620 38,830 registration up to 65.0% 678,231 29,393 15,827 45,220 2006 two year old age. **2005 63.0% 688,250 29,838 27,524 57,362 **Adjusted for foal 62.0% 623,000 31,069 34,042 65,111 **2004 production from PMU sector. 64.0% 608,000 30,788 37,318 68,106 **2003 24 HORSES IN CANADA IN 2010 © EQUINE CANADA 2011
  • 17. HORSES IN CANADA IN 2010 Owners of mares of breeding age were asked questions to identify plans for their breeding programs: Compared to 2009, do you expect to breed MORE, LESS or the SAME number of your mares in 2010? Next year (2011), do you expect to breed MORE, LESS or the SAME number of your mares as 2010? Table 2.14: Expectation for Mares Bred 2010 and 2011 Expectations Expectations % of Mare Owners Reporting for Mares for Mares Expectation for Mares Bred Bred in Bred in Compared to 2009 2010 2011 Expect to Breed More Mares 23.0% 19.0% Expect to Breed Fewer Mares 35.0% 20.0% Expect to Breed Same # of Mares 42.0% 59.0% Mare owners that expect to breed more mares next year, expect to breed 13% more mares than 2010. Mare owners that expect to breed fewer mares next year, expect to breed 29% fewer mares. It is expected that there will be a reduction in foal It is expected that production of approximately 15% in 2011. there will be a reduction in foal Horse owners that reported an expectation to own less horses in the future, were production of asked ““Why?””. While there were multiple responses given, responses can be approximately 15% generally categorized as outlined in Table 2.15. Of those reporting an expectation to in 2011. own fewer horses, 72% of respondents cited reasons of age/demographics. Of respondents, 33% cited reasons surrounding difficulty in selling horses in the current marketplace. Table 2.15: Reasons Offered For Reducing Number of Horses Owned % of Owners Reporting Owning Fewer Horses in the Reason for Expectation To Own Fewer Horses in Future Years Future "I’’m hitting retirement age" 32.0% "I’’m not active in sport/competition any more" 4.0% "My horses are getting old and so am I" 29.0% "The kids have moved out and we were mostly involved with the kids showing" 7.0% "Having trouble selling horses currently, hoping to sell some next year" 17.0% "Selling my horses" 16.0% "Too expensive to keep horses / I can’’t afford it any more" 33.0% "Getting out of the business" 17.0% "Too Busy / Too Much Work" 5.0% Other 21.0% www.strategicequine.ca 2010 CANADIAN HORSE INDUSTRY PROFILE STUDY 25
  • 18. HERD SIZE HERD PROFILE TRENDS VALUE & PRICES IMPORT/EXPORT www.equinecanada.ca 2.4 VALUE AND PRICES FOR HORSES IN 2010 Survey participants were asked a series of questions to identify capital investment in horses, and the expected value of their horses in 2010. Of the horses that you currently own, how many did you purchase? How much money did you spend to purchase these horses? Including foals and yearlings, what is your ESTIMATE of the market value of your horses today? Data reported indicates that the average purchase price for horses owned is $6,054 per horse, with a corresponding average estimated market value of $6,000 per horse. Table 2.16 reports the average purchase price and estimated market value for each provincial region. Table 2.16: Average Purchase and Average Estimated Market Value by Province Average Average estimated Horse Owners Reporting Purchase purchase price market value Price Price and Estimated Market Value per horse per horse Differential CANADA $6,054 $6,000 99% British Columbia $6,181 $7,079 115% Alberta $7,335 $7,662 104% Saskatchewan $2,659 $2,776 104% Manitoba $2,543 $2,808 110% Ontario $9,156 $8,745 96% Quebec $4,487 $6,560 146% New Brunswick $2,884 $3,216 112% Nova Scotia $7,175 $9,769 136% Prince Edward Island $3,271 $5,530 169% Newfoundland $3,932 $3,987 101% Yukon/NT $3,092 $2,479 80% An additional series of questions were asked to identify prices for horses offered for sale in the 2008/2009 period, compared to prices for horses in 2010. How many horses have you bought (sold) so far in 2010? How many horses did you buy (or sell) in the previous two years (2008 and 2009)? For the horses you purchased (or sold) in 2010, were prices higher, lower, or about the same as prices in the previous two years? How much higher/lower? 26 HORSES IN CANADA IN 2010 © EQUINE CANADA 2011
  • 19. HORSES IN CANADA IN 2010 While there is a high percentage of horse owners who maintain ownership of their horses for the horses’’ lifetime, there is also a corresponding significant level of buying and selling activity within the industry each year. When asked how long In response to the question ““On average how long would you keep each of your horses they keep horses before you sell them?”” 56% of horse owners reported ““lifetime””, i.e. they do not sell before selling, 56% of their horses. horse owners reported ““lifetime””, From survey respondents, 15% of horse owners reported to have bought horses in i.e. they do not sell 2010. An additional 40% of horse owners reported that they have bought horses in their horses. the previous two years (2008/2009), representing 30% of the 963,500 horses in Canada in 2010. Table 2.17 reports the estimated numbers of horses bought (purchased) since 2008 by provincial region. Table 2.17: Estimated Number of Horses Purchased Since 2008 Estimated % of horses Estimated % of horses # of horses Total owned # of horses owned purchased Purchased % of Horses Purchased purchased purchased purchased in 2008 & Since in 2008 through 2010 in 2010 in 2010 since 2008 2009 2008 CANADA 38,072 96,956 135,028 British Columbia 3% 3,480 12% 10,440 13,920 Alberta 2% 6,270 11% 28,215 34,485 Saskatchewan 5% 5,440 13% 8,704 14,144 Manitoba 3% 1,680 10% 3,920 5,600 Ontario 6% 12,750 18% 25,500 38,250 Quebec 6% 7,770 19% 16,835 24,605 New Brunswick 3% 375 14% 1,375 1,750 Nova Scotia 2% 160 18% 1,280 1,440 Prince Edward Island 3% 120 8% 200 320 Newfoundland 2% 27 33% 419 446 Yukon/NT 0% 0 5% 68 68 From survey responses, 16% of horse owners reported that they have sold horses in 2010. An additional 32% of horse owners reported that they have sold horses in the previous two years (2008/2009). For Table 2.17, Table 2.18 and Table 2.19, estimates for horses purchased or sold in 2010, are in response to the question ““how many horses (bought/sold) so far this year””, i.e. represents only buying/selling activity up to summer 2010 (time of the survey). Table 2.19 reports the percentage of horses in each provincial herd that were sold into each market segment during the 2008 through 2010 period. www.strategicequine.ca 2010 CANADIAN HORSE INDUSTRY PROFILE STUDY 27
  • 20. HERD SIZE HERD PROFILE TRENDS VALUE & PRICES IMPORT/EXPORT www.equinecanada.ca Table 2.18: Estimated Number of Horses Sold By Province Since 2008 Estimated Estimated # of horses % of horses # of horses % of horses sold in % of Horses Sold in owned sold sold in owned sold 2008 & Total Sold 2008 through 2010 in 2010 2010 since 2008 2009 Since 2008 CANADA 8% 72,608 28% 163,571 236,179 British Columbia 9% 10,440 41% 37,120 47,560 Alberta 7% 21,945 19% 37,620 59,565 Saskatchewan 7% 7,616 31% 26,112 33,728 Manitoba 11% 6,160 37% 14,560 20,720 Ontario 7% 14,875 24% 36,125 51,000 Quebec 8% 10,360 15% 9,065 19,425 New Brunswick 5% 625 9% 500 1,125 Nova Scotia 4% 320 23% 1,520 1,840 Prince Edward Island 6% 240 27% 840 1,080 Newfoundland 2% 27 7% 68 95 Yukon/NT 0% - 3% 41 41 Table 2.19 identifies the estimated number of horses sold by market segment in each provincial region for the 2008 through 2010 period. Table 2.19: Active Markets for Horses Sold Since 2008 Estimated Number of Est. # of Horses Sold by Industry Horses Sport Sector Sold Racing Competition Breeding Pleasure Work Meat CANADA 236,179 17,707 85,342 14,428 99,963 12,037 13,482 British Columbia 47,560 951 17,122 1,427 26,158 1,902 - Alberta 59,565 1,787 23,230 5,361 25,017 1,787 1,787 Saskatchewan* 33,728 - 13,491 3,036 9,107 4,385 9,209 Manitoba 20,720 1,036 7,045 2,279 8,910 829 2,486 Ontario 51,000 11,730 20,400 1,530 14,280 3,060 - Quebec 19,425 583 3,108 389 15,346 - - New Brunswick 1,125 326 326 56 371 56 - Nova Scotia 1,840 938 350 166 368 18 - Prince Edward Island 1,080 356 270 184 270 - - Newfoundland 95 - - - 95 - - *Note: A single individual surveyed reported selling 4,150 horses into the meat sector during the period Survey participants who reported selling horses in the 2008 through 2010 period were asked to identify the sales channel by which they sold their horses. Nationally, 28 HORSES IN CANADA IN 2010 © EQUINE CANADA 2011
  • 21. HORSES IN CANADA IN 2010 more than 85% of the horses sold during the period were sold through private sales transactions. The preferred sales channel for horses in each province is reported in Table 2.20 below. Of the 135,000 horses sold since 2008, 80% Table 2.20: Sales Channel for Horses Sold 2008 to 2010 have been sold through private sale. Association Owners Reporting Private Commercial Auction or Private Directly to Where They Sold Horses Sale Auction Mart Sale Broker Meat CANADA 80% 9% 11% 1% 2% British Columbia 96% 1% 1% 1% 0% Alberta 76% 8% 9% 2% 4% Saskatchewan 55% 26% 6% 0% 10% Manitoba 76% 16% 6% 0% 0% Ontario 68% 10% 18% 3% 0% Quebec 93% 1% 4% 0% 0% New Brunswick 64% 6% 20% 0% 0% Nova Scotia 90% 0% 10% 0% 0% Prince Edward Island 79% 21% 0% 0% 0% Newfoundland 100% 0% 0% 0% 0% Yukon/NT 100% 0% 0% 0% 0% Survey participants who reported that they had bought horses both in 2010 and in the previous two years (2008 and 2009) were asked to compare purchase prices paid Of those who bought in 2010 compared to previous years. Table 2.21 reports the percentage of buyers that horses in 2010, 18% reported purchase prices HIGHER, LOWER or about the SAME in 2010 compared to reported that prices previous years, and the corresponding higher or lower purchase price (percentage were higher in 2010, increase or decrease in 2010). and 40% reported that Table 2.21: Buyers Reporting Change in Purchase Prices in 2010 Compared to prices were lower. 2008 and 2009 % of % of % of Buyers Buyers Buyers Buyers Reporting Reporting Reporting Reporting Change in Purchase Higher % Higher Lower % Lower Same Price in 2010 Prices Prices Prices Prices Prices CANADA 18% 60% 40% 46% 42% British Columbia 27% 117% 31% 49% 42% Alberta 18% 28% 39% 41% 42% Saskatchewan 24% 56% 45% 32% 32% Manitoba 12% 25% 47% 45% 41% Ontario 15% 47% 47% 43% 37% Quebec 0% 13% 25% 87% New Brunswick 50% 108% 0% 50% Nova Scotia 25% 30% 75% 75% 0% Prince Edward Island 20% 20% 40% 55% 40% Newfoundland 0% 0% 100% www.strategicequine.ca 2010 CANADIAN HORSE INDUSTRY PROFILE STUDY 29
  • 22. HERD SIZE HERD PROFILE TRENDS VALUE & PRICES IMPORT/EXPORT www.equinecanada.ca Survey participants who reported that they had sold horses both in 2010 and in the previous two years (2008 and 2009) were asked a corresponding question to identify selling prices HIGHER, LOWER or about the SAME in 2010 and the corresponding higher/lower selling prices as reported in Table 2.22. Table 2.22: Sellers Reporting Change in Selling Prices in 2010 Compared to 2008 and 2009 % of Sellers % of Sellers % of Sellers Sellers Reporting Reporting Reporting Reporting Change in Selling Price Higher % Higher Lower % Lower Same in 2010 Prices Prices Prices Prices Prices CANADA 16% 39% 46% 40% 26% British Columbia 12% 55% 45% 32% 30% Alberta 12% 29% 57% 41% 20% Saskatchewan 21% 25% 36% 37% 29% Manitoba 24% 30% 41% 36% 28% Ontario 20% 54% 46% 45% 23% Quebec 7% -- 43% 32% 30% New Brunswick 0% 33% 50% 29% In all provinces, and Nova Scotia 0% 20% 25% 57% all industry sectors, Prince Edward Island 17% 30% 50% 37% 29% there were more Newfoundland 0% 100% 100% 0% sellers reporting lower prices than sellers Table 2.23 reports the corresponding data from those selling horses during 2008 reporting higher through 2010 by industry sector. prices. Table 2.23: Sellers Reporting Change in Selling Prices in 2010 by Market Sector % of % of % of Sellers Sellers Sellers Reporting Reporting Reporting Sellers Reporting Change Higher % Higher Lower % Lower Same in Selling Price in 2010 Prices Prices Prices Prices Prices Racing 14% 41% 36% 52% 50% Sport Competition 19% 26% 49% 41% 31% Breeding Sector 6% 30% 75% 41% 19% Pleasure riding/driving 16% 55% 39% 33% 45% Work Horses 15% 55% 54% 50% 31% Meat Market 17% 10% 50% 25% 33% 2.5 HORSES IMPORTED AND EXPORTED The analysis provided to this point in the chapter addresses horses that are considered to be resident in Canada in 2010. As a component of the meta analysis completed as a component of this study, additional research was completed to identify the number of horses imported into and exported from Canada during the current five year business cycle (2005 through 2010). 30 HORSES IN CANADA IN 2010 © EQUINE CANADA 2011
  • 23. HORSES IN CANADA IN 2010 Table 2.24 reports data available from Statistics Canada and CFIA (Canadian Food Inspection Agency) for import/export of horses during 2005 through 2010. Table 2.24: Horses Imported and Exported 2005 through 2010 Actual to September Projected Horses Imported 2005 2006 2007 2008 2009 2010 2010 Temporary Imports 1,368 1,683 7,448 9,732 13,503 7,877 10,503 Permanent Imports (Non-Processing) 5,008 5,398 5,185 5,734 5,863 3,324 4,432 Imports for Feeder/Processing 17,324 21,709 37,727 62,200 67,761 52,487 69,983 Total Imports 23,700 28,790 50,360 77,666 87,127 63,688 84,918 Actual to September Projected Horses Exported 2005 2006 2007 2008 2009 2010 2010 Temporary Exports 18,396 ** 2,875 16,626 12,383 12,978 17,304 Permanent Exports 23,541 ** 17,678 13,611 10,113 8,112 10,816 Total Exports 41,937 - 20,553 30,237 22,496 21,090 28,120 Source: CFIA and Statistics Canada ** Data not available In the telephone survey, participants who reported selling horses in the 2008 through 2010 period were asked: More than 35,000 ““How many of the horses you sold since 2008 were sold to buyers outside of horses have been sold Canada?”” to export markets since 2008. Survey participants responding, reported 15% of horses sold to out of country buyers. For the estimated 236,000 horses sold in this period, this represents 35,425 horses sold to export markets since 2008.This is in line with the reported permanent exports for 2008, 2009 and estimated for 2010. www.strategicequine.ca 2010 CANADIAN HORSE INDUSTRY PROFILE STUDY 31
  • 24. HERD SIZE HERD PROFILE TRENDS VALUE & PRICES IMPORT/EXPORT www.equinecanada.ca 32 HORSES IN CANADA IN 2010 © EQUINE CANADA 2011