High Class Call Girls Nagpur Grishma Call 7001035870 Meet With Nagpur Escorts
Q1 2009 Earning Report of Healthways Inc.
1. Healthways Reports First Quarter Adjusted Net Income Per Diluted Share of $0.30; GAAP Net Loss of $0.43 Per Diluted
Share
First Quarter Revenues Total $182.7 Million
NASHVILLE, Tenn.--(BUSINESS WIRE)--Apr. 20, 2009-- Healthways, Inc. (NASDAQ: HWAY) today announced financial
results for the first quarter ended March 31, 2009. Total revenues for the quarter were $182.7 million, an increase of 1%
compared with revenues of $180.9 million for the three months ended March 31, 2008. Healthways' net loss for the first quarter
of 2009 was $14.8 million, or $0.43 per diluted share, including costs of $40.0 million, or $0.73 per diluted share, related to the
previously announced settlement of a lawsuit. As anticipated in the Company’s guidance, the first-quarter results included a gain
of $0.05 per diluted share resulting from the sale of D2Hawkeye, Inc., a company in which Healthways held a minority stake. Net
income excluding the lawsuit settlement costs (―adjusted net income‖) was $10.2 million for the first quarter of 2009, which was
equal to net income for the comparable period in 2008. Adjusted net income per diluted share for the first quarter of 2009
increased 11% to $0.30 from net income per diluted share of $0.27 for the comparable 2008 period.
COMPARISON OF COMPONENTS OF NET INCOME PER DILUTED SHARE
See pages 8 and 9 for a reconciliation of GAAP and non-GAAP results
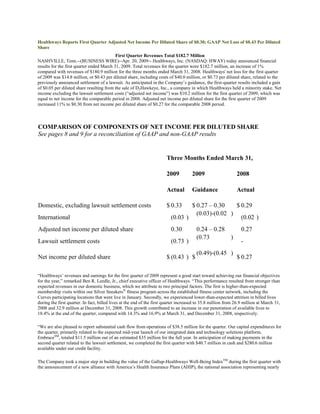
Three Months Ended March 31,
2009 2009 2008
Actual Guidance Actual
$ 0.27 – 0.30
Domestic, excluding lawsuit settlement costs $ 0.33 $ 0.29
(0.03)-(0.02 )
International (0.03 ) (0.02 )
0.24 – 0.28
Adjusted net income per diluted share 0.30 0.27
(0.73 )
Lawsuit settlement costs (0.73 ) -
(0.49)-(0.45 )
Net income per diluted share $ (0.43 ) $ $ 0.27
―Healthways’ revenues and earnings for the first quarter of 2009 represent a good start toward achieving our financial objectives
for the year,‖ remarked Ben R. Leedle, Jr., chief executive officer of Healthways. ―This performance resulted from stronger than
expected revenues in our domestic business, which we attribute to two principal factors. The first is higher-than-expected
membership visits within our Silver Sneakers® fitness program across the established fitness center network, including the
Curves participating locations that went live in January. Secondly, we experienced lower-than-expected attrition in billed lives
during the first quarter. In fact, billed lives at the end of the first quarter increased to 35.8 million from 26.9 million at March 31,
2008 and 32.9 million at December 31, 2008. This growth contributed to an increase in our penetration of available lives to
18.4% at the end of the quarter, compared with 14.3% and 16.9% at March 31, and December 31, 2008, respectively.
―We are also pleased to report substantial cash flow from operations of $38.5 million for the quarter. Our capital expenditures for
the quarter, primarily related to the expected mid-year launch of our integrated data and technology solutions platform,
EmbraceSM, totaled $11.5 million out of an estimated $35 million for the full year. In anticipation of making payments in the
second quarter related to the lawsuit settlement, we completed the first quarter with $40.7 million in cash and $280.6 million
available under our credit facility.
The Company took a major step in building the value of the Gallup-Healthways Well-Being IndexTM during the first quarter with
the announcement of a new alliance with America’s Health Insurance Plans (AHIP), the national association representing nearly
2. 1,300 member companies providing health insurance coverage to more than 200 million Americans.
In the release accompanying the announcement, Karen Ignagni, President and CEO of AHIP, said, ―These data are a national
wake-up call to re-orient our system toward preventive care, wellness and chronic care management. As members of Congress
focus on health care reform, these data will serve as an important resource to gauge the true health and well-being of their
constituents.‖
Mr. Leedle continued, ―We are seeing increased interest in the Gallup-Healthways Well-Being Index among existing and
potential customers, who are becoming more focused on making investments in employee health that reduce direct cost and drive
improved productivity. We are helping them recognize and understand that the Gallup-Healthways Well-Being Index is a
powerful tool that can evaluate their population with great specificity, provide baselines and benchmarks of employee well-being,
internally and externally, and measure the impact of our programs in improving well-being over time.‖
Financial Guidance
Healthways’ guidance for adjusted net income per diluted share, which excludes the lawsuit settlement costs, remains in a range
of $0.90 to $1.04 for 2009. The Company’s revenue guidance for 2009 remains in the range of $652 to $680 million.
Healthways today established its guidance for net income per diluted share for the second quarter of 2009 in a range of $0.22 to
$0.25, including $0.27 to $0.29 expected from domestic operations and a net cost impact of $0.04 to $0.05 from international
operations. The expected sequential decrease in second-quarter earnings from the first quarter relates primarily to the gain on the
sale of D2Hawkeye, Inc. recorded in the first quarter, in addition to the expected lower revenues from the potential impact on our
billed lives from rising unemployment and the increased costs associated with the implementation of the Company’s contract
with Hospitals Contribution Fund (HCF) in Australia, which will go live in the second quarter of 2009.
COMPARISON OF COMPONENTS OF NET INCOME PER DILUTED SHARE
See pages 8 and 9 for a reconciliation of GAAP and non-GAAP results
Twelve Months Three Months
Ending
Ending Ended
Dec. 31, 2009 Dec. 31, 2008 June 30, 2009
(Guidance)
(Guidance) (Actual)
0.27 – 0.29
Domestic, excluding lawsuit settlement costs $ 1.00 – 1.12 $ 1.20 $
(0.10)-(0.08 ) (0.05)-(0.04 )
International (0.10 )
0.90 – 1.04 0.22 – 0.25
Adjusted net income per diluted share 1.10
(0.73 )
Lawsuit settlement costs - -
0.22 – 0.25
$ 0.17 – 0.31
Net income per diluted share $ 1.10 $
Summary
Mr. Leedle concluded, ―We are encouraged by our first-quarter operating and financial results and by the opportunities we see in
3. both the domestic and international markets. Healthways is well positioned financially and organizationally to maximize these
opportunities, in part due to our initiatives in 2008 to streamline our management structure, optimize capacity and align our
management and sales cycles more closely with those of our customers.
―In 2009 and beyond, we expect to continue expanding our market leadership in providing solutions at scale that are proven to
lower healthcare costs, not just by providing the best evidence-based care to those already affected by disease, but also by helping
keep healthy people healthy and mitigating or slowing the progression to disease for those with modifiable family or lifestyle risk
factors. We remain confident of our ability to meet increasing demand for these solutions and, in so doing, of our continuing
prospects for creating significant long-term growth in shareholder value.‖
HEALTHWAYS, INC.
CONSOLIDATED STATEMENTS OF OPERATIONS
(Unaudited)
(In thousands, except per share data)
Three Months
Ended
March 31,
2009 2008
Revenues $ 180,940
$ 182,736
Cost of services (exclusive of depreciation and amortization of $8,786
128,187
132,838
and $8,429, respectively, included below)
Selling, general and administrative expenses 18,691
18,785
Depreciation and amortization 11,809
12,250
Operating income 22,253
18,863
—
Gain on sale of investment (2,581 )
Interest expense 4,887
4,060
—
Legal settlement and related costs 39,956
Income (loss) before income taxes 17,366
(22,572 )
Income tax expense (benefit) 7,163
(7,759 )
Net income (loss) $ (14,813 ) $ 10,203
Earnings (loss) per share:
Basic ) $ 0.28
$ (0.44
Diluted ) $ 0.27
$ (0.43
Weighted average common shares and equivalents:
4. Basic 36,035
33,669
Diluted 37,730
34,067
Healthways, Inc.
Statistical Information
(In thousands)
(Unaudited)
March 31, March 31,
2009 2008
Operating Statistics
Domestic commercial available lives 195,000 187,500
Domestic commercial billed lives 26,900
35,800
Healthways, Inc.
Reconciliation of Non-GAAP Measures to GAAP Measures
(Unaudited)
Reconciliation of Domestic Diluted Earnings Per Share (EPS) Excluding Lawsuit
Settlement Costs and
Reconciliation of Adjusted EPS to Diluted EPS (Loss), GAAP Basis
Three Months
Ended
March 31, 2009
Domestic EPS excluding lawsuit settlement costs (1)
$ 0.33
International EPS (loss) (0.03 )
Adjusted EPS (2) $ 0.30
EPS (loss) attributable to lawsuit settlement costs (3) (0.73 )
EPS (loss), GAAP basis $ (0.43 )
(1) Domestic EPS excluding lawsuit settlement costs is a non-GAAP financial measure. The
Company excludes EPS (loss) attributable to lawsuit settlement costs from this measure because
of its comparability to the Company's historical operating results and EPS guidance. The
Company believes it is useful to investors to provide disclosures of its operating results and
guidance on the same basis as that used by management. You should not consider Domestic
5. EPS excluding lawsuit settlement costs in isolation or as a substitute for Domestic EPS
determined in accordance with accounting principles generally accepted in the United States.
(2) Adjusted EPS is a non-GAAP financial measure. The Company excludes EPS (loss)
attributable to lawsuit settlement costs from this measure because of its comparability to the
Company's historical operating results and EPS guidance. The Company believes it is useful to
investors to provide disclosures of its operating results and guidance on the same basis as that
used by management. You should not consider Adjusted EPS in isolation or as a substitute for
EPS determined in accordance with accounting principles generally accepted in the United
States.
(3) EPS (loss) attributable to lawsuit settlement costs consists of pre-tax charges of $40 million
related to the Company’s settlement of a qui tam lawsuit.
Reconciliation of Domestic EPS Guidance Excluding Lawsuit Settlement Costs and
Reconciliation of
Adjusted EPS Guidance to Diluted EPS (Loss) Guidance, GAAP Basis
Three Months Twelve Months
Ended Ending
March 31, 2009 December 31, 2009
Domestic EPS guidance excluding lawsuit
$ 0.27 – 0.30 $ 1.00 – 1.12
settlement costs (4)
(0.03) – (0.02 (0.10) – (0.08
International EPS (loss) guidance ) )
Adjusted EPS guidance (5) $ 0.24 – 0.28 $ 0.90 – 1.04
EPS (loss) attributable to lawsuit settlement
(0.73 ) (0.73 )
costs (6)
$ (0.49) – (0.45 $ 0.17 – 0.31
EPS (loss) guidance, GAAP basis )
(4) Domestic EPS guidance excluding lawsuit settlement costs is a non-GAAP financial
measure. The Company excludes EPS (loss) attributable to lawsuit settlement costs from this
measure because of its comparability to the Company's historical operating results. The
Company believes it is useful to investors to provide disclosures of its operating results and
guidance on the same basis as that used by management. You should not consider Domestic
EPS guidance excluding lawsuit settlement costs in isolation or as a substitute for Domestic EPS
guidance determined in accordance with accounting principles generally accepted in the United
6. States.
(5) Adjusted EPS guidance is a non-GAAP financial measure. The Company excludes EPS
(loss) attributable to lawsuit settlement costs from this measure because of its comparability to
the Company's historical operating results. The Company believes it is useful to investors to
provide disclosures of its operating results and guidance on the same basis as that used by
management. You should not consider Adjusted EPS guidance in isolation or as a substitute for
EPS guidance determined in accordance with accounting principles generally accepted in the
United States.
(6) EPS (loss) attributable to lawsuit settlement costs consists of pre-tax charges of $40 million
related to the Company’s settlement of a qui tam lawsuit.
Reconciliation of Adjusted Net Income to Net Loss, GAAP Basis
(In millions)
Three Months Ended
March 31, 2009
Adjusted net income (7) $ 10.2
Net loss attributable to lawsuit settlement costs (8) (25.0 )
Net loss, GAAP basis $ (14.8 )
(7) Adjusted net income is a non-GAAP financial measure. The Company excludes net loss
attributable to lawsuit settlement costs from this measure because of its comparability to the
Company's historical operating results and EPS guidance. The Company believes it is useful to
investors to provide disclosures of its operating results and guidance on the same basis as that
used by management. You should not consider adjusted net income in isolation or as a
substitute for net income determined in accordance with accounting principles generally
accepted in the United States.
(8) Net loss attributable to lawsuit settlement costs consists of after-tax charges of $25 million
related to the Company’s settlement of a qui tam lawsuit.
7. HEALTHWAYS, INC.
CONSOLIDATED BALANCE SHEETS
(Unaudited)
(In thousands, except share and per share data)
December
March 31,
31,
2008
2009
Assets
Current assets:
Cash and cash equivalents $ 5,157
$ 40,739
Accounts receivable, net 115,108
123,703
Prepaid expenses 13,479
11,762
Other current assets 3,810
7,093
—
Income taxes receivable 8,000
Deferred tax asset 30,488
27,748
Total current assets 168,042
219,045
Property and equipment
Leasehold improvements 34,635
37,367
Computer equipment and related software 138,369
142,441
Furniture and office equipment 29,610
29,392
Capital projects in process 17,462
21,862
220,076
231,062
Less accumulated depreciation (108,635 )
(117,639 )
Net property and equipment 111,441
113,423
Other assets 18,089
8,083
Customer contracts, net 32,715
31,360
Other intangible assets, net 68,207
67,326
Goodwill, net 484,596
484,584
Total assets $ 883,090
$ 923,821
Liabilities and stockholders' equity
Current liabilities:
8. Accounts payable $ 21,633
$ 18,322
Accrued salaries and benefits 33,161
45,472
Accrued liabilities 26,294
74,851
Deferred revenue 6,904
8,425
Contract billings in excess of earned revenue 71,406
73,298
—
Income taxes payable 8,034
Current portion of long-term debt 2,035
3,825
Current portion of long-term liabilities 4,609
5,066
Total current liabilities 174,076
229,259
Long-term debt 304,372
310,867
Long-term deferred tax liability 8,073
7,260
Other long-term liabilities 39,533
33,631
Stockholders' equity
Preferred stock
$.001 par value, 5,000,000 shares authorized, none outstanding
— —
Common stock
$.001 par value,120,000,000 shares authorized, 33,682,571 and
33,648,976 shares outstanding 34
34
Additional paid-in capital 213,461
215,481
Retained earnings 148,506
133,693
Accumulated other comprehensive loss (4,965 )
(6,404 )
Total stockholders' equity 357,036
342,804
Total liabilities and stockholders' equity $ 883,090
$ 923,821
HEALTHWAYS, INC.
CONSOLIDATED STATEMENTS OF CASH FLOWS
(Unaudited)
(In thousands)
Three Months Ended
March 31,
9. 2009 2008
Cash flows from operating activities:
Net income (loss) $ (14,813 ) $ 10,203
Adjustments to reconcile net income to net cash provided by operating
activities, net of business acquisitions:
Depreciation and amortization 11,809
12,250
Amortization of deferred loan costs 291
348
Share-based employee compensation expense 4,484
2,847
Excess tax benefits from share-based payment arrangements (3,057 )
(32 )
Increase in accounts receivable, net (20,110 )
(8,593 )
Increase in other current assets (902 )
(8,150 )
Increase (decrease) in accounts payable (2,568 )
3,238
Increase in accrued salaries and benefits 8,789
12,309
Increase in other current liabilities 6,734
39,717
Deferred income taxes (27 )
2,303
Other 8,849
1,907
Increase in other assets (1,856 )
(3,449 )
Payments on other long-term liabilities (1,789 )
(1,392 )
Net cash flows provided by operating activities 20,850
38,490
Cash flows from investing activities:
—
Change in restricted cash (538 )
—
Sale of investment 11,626
Acquisition of property and equipment (29,007 )
(11,504 )
—
Acquisitions, net of cash acquired (279 )
Other (1,250 )
(940 )
Net cash flows used in investing activities (30,536 )
(1,356 )
Cash flows from financing activities:
Proceeds from issuance of long-term debt 62,287
91,200
Payments of long-term debt (551 )
(84,940 )
—
Deferred loan costs (769 )
Excess tax benefits from share-based payment arrangements 3,057
32
Exercise of stock options 2,734
65
—
Repurchases of stock options (736 )
—
Repurchases of common stock (22,208 )
—
Change in outstanding checks and other (6,149 )
Net cash flows (used in) provided by financing activities 45,319
(1,297 )
Effect of exchange rate changes on cash 283
(255 )
10. Net increase in cash and cash equivalents 35,916
35,582
Cash and cash equivalents, beginning of period 40,515
5,157
Cash and cash equivalents, end of period $ 76,431
$ 40,739
Source: Healthways, Inc.
Healthways, Inc.
Mary A. Chaput, 615-614-4929
Executive Vice President and Chief Financial Officer
Conference Call
Healthways will hold a conference call to discuss this release today at 5:00 p.m. Eastern Time. Investors will have the
opportunity to listen to the conference call live over the Internet by going to www.healthways.com and clicking Investor
Relations, or by going to www.earnings.com, at least 15 minutes early to register, download and install any necessary audio
software. For those who cannot listen to the live broadcast, a telephonic replay will be available for one week at 719-457-0820,
code 4376582, and the replay will also be available on the Company’s web site for the next 12 months.
Safe Harbor Provisions
This press release contains forward-looking statements, including our guidance and financial expectations for future periods, that
are based upon current expectations and involve a number of risks and uncertainties. Those forward-looking statements include
all statements that are not historical statements of fact and those regarding the intent, belief or expectations of the Company,
including, without limitation, all statements regarding the Company’s future earnings and results of operations. In order for the
Company to utilize the ―safe harbor‖ provisions of the Private Securities Litigation Reform Act of 1995, investors are hereby
cautioned that the following important factors, among others, may affect these forward-looking statements. Consequently, actual
operations and results may differ materially from those expressed in these forward-looking statements. The important factors
include but are not limited to: the Company’s ability to sign and implement new contracts for Health and Care Support solutions;
the Company’s ability to accurately forecast performance and the timing of revenue recognition under the terms of its contracts
with customers ahead of data collection and reconciliation in order to provide forward-looking guidance; the impact of any new
or proposed legislation, regulations and interpretations relating to the Medicare Prescription Drug, Improvement, and
Modernization Act of 2003, including the potential expansion to Phase II for Medicare Health Support programs and any
legislative or regulatory changes with respect to Medicare Advantage; the Company’s ability to reach mutual agreement with the
Centers for Medicare and Medicaid Services (CMS) with respect to the Company’s results under Phase I of Medicare Health
Support; the Company’s ability to anticipate the rate of market acceptance of Health and Care Support solutions in potential
international markets; the ability of the Company to accurately forecast the costs necessary to implement the Company’s strategy
of establishing a presence in international markets; the risks associated with foreign currency exchange rate fluctuations and the
Company’s ability to hedge against such fluctuations; the Company’s ability to retain existing health plan customers if they
decide to take programs in-house or are acquired by other health plans which already have or are not interested in Health and
Care Support programs; the risks associated with a significant concentration of the Company’s revenues with a limited number of
customers; the Company’s ability to effect cost savings and clinical outcomes improvements under Health and Care Support
contracts and reach mutual agreement with customers with respect to cost savings, or to effect such savings and improvements
within the time frames contemplated by the Company; the ability of the Company to achieve estimated annualized revenue in
backlog in the manner and within the timeframe the Company expects, which is based on certain estimates regarding the
implementation of the Company’s services; the ability of the Company and/or its customers to enroll participants in the
Company’s Health and Care Support programs in a manner and within the timeframe anticipated by the Company; the ability of
the Company’s customers to provide timely and accurate data that is essential to the operation and measurement of the
Company’s performance under the terms of its contracts; the Company’s ability to favorably resolve contract billing and
interpretation issues with its customers; the Company’s ability to service its debt and make principal and interest payments as
those payments become due; the risks associated with changes in macroeconomic conditions, which may reduce the demand
and/or the timing of purchases for the Company’s services from customers or potential customers, reduce the number of covered
lives of the Company’s existing customers, restrict the Company’s ability to obtain additional financing, or impact the
availability of credit under the Company’s credit agreement; counterparty risk associated with our interest rate swap agreements;
the Company’s ability to integrate acquired businesses or technologies into the Company’s business; the impact of any
impairment of the Company’s goodwill or other intangible assets; the Company’s ability to develop new products and deliver
outcomes on those products; the Company’s ability to renew and/or maintain contracts with its customers under existing terms or
11. restructure these contracts on terms that would not have a material negative impact on the Company’s results of operations; the
Company’s ability to obtain adequate financing to provide the capital that may be necessary to support the Company’s operations
and to support or guarantee the Company’s performance under new contracts; unusual and unforeseen patterns of healthcare
utilization by individuals with diabetes, cardiac, respiratory and/or other diseases or conditions for which the Company provides
services; the ability of the Company’s customers to maintain the number of covered lives enrolled in the plans during the terms of
the agreements; the impact of litigation involving the Company and/or its subsidiaries; the impact of future state, federal, and
international health care and other applicable legislation and regulations on the Company’s ability to deliver its services and on
the financial health of the Company’s customers and their willingness to purchase the Company’s services; and other risks
detailed in the Company’s Annual Report on Form 10-K for the fiscal year ended August 31, 2008 and other filings with the
Securities and Exchange Commission. The Company undertakes no obligation to update or revise any such forward-looking
statements.
About Healthways
Healthways is the leading provider of specialized, comprehensive solutions to help millions of people maintain or improve their
health and well-being and, as a result, reduce overall costs. Healthways' solutions are designed to help healthy individuals stay
healthy, mitigate and slow the progression of disease associated with family or lifestyle risk factors and promote the best possible
health for those already affected by disease. Our proven, evidence-based programs provide highly specific and personalized
interventions for each individual in a population, irrespective of age or health status, and are delivered to consumers by phone,
mail, internet and face-to-face interactions, both domestically and internationally. Healthways also provides a national, fully
accredited complementary and alternative Health Provider Network, offering convenient access to individuals who seek health
services outside of, and in conjunction with, the traditional healthcare system. For more information, please visit
www.healthways.com.