Bandra High Profile Sexy Call Girls,9833754194-Khar Road Speciality Call Girl...
Q1 2009 Earning Report of Sekisui Chemical Co., Ltd.
1. April 27, 2009
Summary of Financial Results for the Fiscal Year 2008 Ended March 31, 2009
Company Name: Sekisui Chemical Co., Ltd.
Stock Listings: Tokyo Stock Exchange, Osaka Securities Exchange
Code Number: 4204
URL: http://www.sekisui.co.jp
Representative Director: Mr. Naofumi Negishi, President
Inquiries: Mr. Shuichi Shino, General Manager, Corporate Communication Dept.
TEL +81-3- 5521-0522
Scheduled General Meeting of Shareholders: June 26, 2009
Scheduled date for payment of dividends: June 29, 2009
Scheduled date for submission of financial June 26, 2009
statement
(Figures rounded down to the nearest million yen)
1. Consolidated Business Results for the FY 2008 (April 1, 2008 to March 31, 2009)
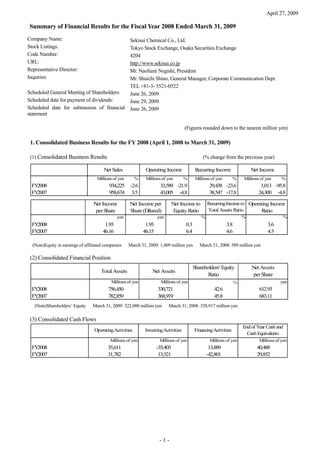
(1) Consolidated Business Results (% change from the previous year)
Net Sales Operating Income Recurring Income Net Income
Millions of yen % Millions of yen % Millions of yen % Millions of yen %
FY2008 934,225 -2.6 33,589 -21.9 29,438 -23.6 1,013 -95.8
FY2007 958,674 3.5 43,005 -4.8 38,547 -17.8 24,300 -4.8
Recurring Income to Operating Incom
Net Incom e Net Incom per
e Net Incom to
e e
Total Assets Ratio
per Share Share (Diluted) Equity Ratio Ratio
yen yen % % %
FY2008 1.93 1.93 0.3 3.8 3.6
FY2007 46.16 46.15 6.4 4.6 4.5
(Note)Equity in earnings of affiliated companies March 31, 2009: 1,409 million yen March 31, 2008: 589 million yen
(2) Consolidated Financial Position
Shareholders' Equity Net Assets
Total Assets Net Assets
Ratio per Share
%
Millions of yen Millions of yen yen
FY2008 756,450 330,721 42.6 612.93
FY2007 782,859 368,919 45.8 683.11
(Note)Shareholders’ Equity March 31, 2009: 322,000 million yen March 31, 2008: 358,917 million yen
(3) Consolidated Cash Flows
End of Year Cash and
Operating Activities Investing Activities Financing Activities
Cash Equivalents
Millions of yen Millions of yen Millions of yen Millions of yen
FY2008 35,611 -35,403 13,889 40,488
FY2007 31,782 13,521 -42,801 29,852
-1-
2. Sekisui Chemical (4204) Summary of Financial Results for the Fiscal Year 2008 Ended March 31, 2009
2. Dividend Status
Total Dividend Dividend to
Dividend Per Share
Dividend Payout equity
Payment (full Rtaio(consol ratio(consoli
(Date of Record) 1st Q At Midterm 3rd Q Year-end Full year year) idated) dated)
yen yen yen yen yen Millions of yen % %
FY2007 - 7.00 - 8.00 15.00 7,886 32.5 2.1
FY2008 - 7.00 - 3.00 10.00 5,257 518.7 1.5
FY2009(outlook) - 5.00 - 5.00 10.00 52.5
3. Consolidated Outlook for FY 2009 (Apr 1, 2009-March 31, 2010) (% change from the previous year)
Net Incom e
Net Sales Operating Income Recurring Income Net Income
Per Share
Millions of yen % Millions of yen % Millions of yen % Millions of yen % yen
Mid Term 406,000 -14.2 3,000 -83.6 3,000 -84.4 -2,000 - -3.81
Full Year 860,000 -7.9 27,500 -18.1 24,500 -16.8 10,000 887.1 19.04
4. Other
(1) Significant change of subsidiary companies during the term (change of specified subsidiaries that affected the
scope of consolidated reporting) No
(2) Changes in accounting principles, methods or reporting methods affecting the production of the consolidated
financial statement (fundamental changes in main reported item for the production pf the consolidated financial
statement)
a) Changes caused by revisions to accounting principles Yes
b) Changes other than a) No
(3) Number of shares outstanding (common stock)
a) Number of shares outstanding at year-end (including treasury stock)
March 31, 2009 539,507,285 shares
March 31, 2008 539,507,285 shares
b) Treasury stock at fiscal year-end
March 31, 2009 14,161,865 shares
March 31, 2008 14,088,433 shares
-2-
3. (References)Non-consolidated Business Results for the FY 2008 (April 1, 2008 to March 31, 2009)
(1) Non-consolidated Business Results (% change from the previous year)
Net Sales Operating Income Recurring Income Net Income
Millions of yen % Millions of yen % Millions of yen % Millions of yen %
FY2008 344,302 -6.5 3,846 -70.2 8,633 -43.8 -9,329 -
FY2007 368,359 -3.1 12,889 -41.9 15,358 -44.3 16,522 42.1
Net Incom e Net Incom per
e
per Share Share (Diluted)
yen yen
FY2008 -17.74 -
FY2007 31.37 31.36
(2) Non-consolidated Financial Position
Shareholders' Equity Net Assets
Total Assets Net Assets
Ratio per Share
%
Millions of yen Millions of yen yen
FY2008 462,857 251,409 54.2 477.48
FY2007 471,988 278,171 58.9 528.61
(Note)Shareholders’ Equity March 31, 2009: 251,022 million yen March 31, 2008: 277,933 million yen
Notes: An explanation the application of these changes to the result forecast is presented in the section on
Other Item
Forecasts and forward looking statements presented in this report are based on the company’s assessment of
information and business conditions at the time of production of this report. Actual results can differ significantly
from forecasts due to changes in these business conditions. Please refer to page6, notes 3 “2) Full-year forecast”
for the assumptions underlying the forecasts, disclaimer on the use of forecasts, and other related
matters.
-3-
4. Sekisui Chemical (4204) Summary of Financial Results for the Fiscal Year 2008 Ended March 31, 2009
1. Consolidated Business Results
(1) Analysis of Operating Results
1) Fiscal Year 2007 (April 1, 2008, to March 31, 2009)
a. Consolidated Results
Net sales ¥934.2 billion (–2.6% year on year), operating income ¥33.5 billion (–21.9%), ordinary
income ¥29.4 billion (–23.6%), net income ¥1.0 billion yen (–95.8%).
The Company’s primary focus in the final year of the medium-term management plan GS21-Go!
Frontier was on revitalizing its domestic demand led core businesses and opening business growth
frontiers. While making progress in revitalizing domestic demand led core businesses by advancing
structural reform, growth business were developed through aggressive strategic investments,
primarily overseas, and by laying the groundwork for future business expansion. In Japan, steps
were taken to enhance management efficiency in Japan, and the steady housing orders through the
second quarter helped raise both net sales and operating income. Overseas, M&A and other strategic
activities helped further establish the foundational infrastructure for growth frontier operations.
Beginning in the third quarter, however, the deteriorating economic conditions worldwide strongly
affected the previously strong demand trends, mainly in the automotive and IT fields, and the sharp
contraction in demand led to declines in both sales and income. In addition, expenses from reforms
to the business structure and fines incurred for involvement in a price cartel for PVC pipes along
with a loss on devaluation of investments in securities and other extraordinary losses resulted in a
substantial decline in net income.
2) Business Results by Company
Housing
Net sales ¥424.4 billion (+1.1%), operating income ¥17.1 billion (+21.2%)
In the year under review, steep rises in raw material costs and the worldwide economic slowdown
considerably slowed the housing market. The Housing Company countered by introducing new
products, highlighting the environmental and economical features of its product lines, and
strengthening its sales force in the living environment business. The result was the achievement of
expanded orders and sales and continuing improvement in operating efficiency.
In the new housing construction business, the company expanded its product line targeting first-time
homebuyers with the additions including the bj new series in April, Grand to You WS series in May,
and the nationwide introduction of the Crescasa series in October. The company also promoted the
environmental, economical, and other features of its home models and increased the percentage of
its products offered with solar power generation systems, Warm Airy technology, and other high
value-added options.
-4-
5. Sekisui Chemical (4204) Summary of Financial Results for the Fiscal Year 2008 Ended March 31, 2009
The company also successfully increased sales and operating income over previous year levels in the
living environment business by efforts to fortify its marketing force and expand sales of its water
environment fixtures, solar power generation systems, and other feature products.
The Housing Company recorded year on year declines in orders beginning in the third quarter for
the new housing construction and living environment businesses. However, contributions from the
steady level of orders received in the first half of the year coupled with the tangible results from the
improved operating efficiency resulted in the Housing Company posting increases in both sales and
income for the full fiscal year.
Urban Infrastructure and Environmental Products
Net sales ¥225.2 billion (–3.7%), operating income ¥1.6 billion (–73.1%)
The UIEP Company achieved measurable expansion in its overseas operations and in other areas
during the year, but its performance was severely impacted by the slowdown in the domestic
housing construction starts and from the postponement and cancellation of construction projects in
reaction to the global economic slowdown.
The company responded to the harsh market conditions in Japan by making progress with the
structural reform of its domestic operations, including revising its operating structure and shifting
staff to business growth fields. The company also endeavored to reinforce its earning power by
revising its pricing structure to better reflect recent trends in materials prices. Despite these efforts,
the company struggled to overcome the impact of plummeting product sales volumes, particularly
for its core PVC pipes and construction materials.
In overseas operations, the UIEP Company continued to advance toward its objective of becoming
the world’s leading pipeline renewal company. In July 2008, the Company acquired Chevalier Pipe
Technologies (CPT) G.m.b.H., a leading pipeline renewal company in Europe, and in November
2008 established the sales company Sekisui CPT Asia Pte. Ltd., in Singapore in preparation for
full-fledged business development in Asia. In addition, the Company established the joint venture
company LLC Sumi-Lon as a local base for expanding sales in the rapidly expanding market for
reinforced plastic pipe in Russia.
High Performance Plastics
Net sales ¥262.6 billion (–6.4%), operating income ¥15.7 billion (–35.5%)
HPP Company focused management resources in its three strategic fields (automotive, IT, medical)
and achieved a degree of business expansion during the year. However, business suffered from the
-5-
6. Sekisui Chemical (4204) Summary of Financial Results for the Fiscal Year 2008 Ended March 31, 2009
rapid deterioration in market conditions in both Japan and overseas beginning in the third quarter
and from sharp drops in demand, particularly in the automotive and IT fields.
In the automotive field, the company focused on expanding sales of its high-performance interlayer
films, including introducing in October two new interlayer films for glass—the Head-up Display and
a windshield interlayer film that extends onto the vehicle roof—as a strategy to counter the negative
effects from the global economic conditions, the strong yen, and other adverse elements.
In addition, in July the company began expanding its interlayer film production bases in China and
Japan and in December committed to expanding production of interlayer film raw materials and
resins for laminated glass in the Netherlands. In the IT field, sales of liquid-crystal chemicals,
optical films, and other core products suffered. However, in anticipation of growing demand in the
medium and long term, in October the company commenced construction of the Taga Plant with the
aim of making it a primary production hub for adhesive film products. The new plant scheduled to
commence operations in January 2010.
In the medical field, sales remained strong, and the company continued to enhance its earning power
through business concentration and selectivity. In addition, the company launched full-fledged
business development overseas in the pharmacokinetics business following the August 2008
acquisition of XenoTech, LLC, of the United States, and with the March 2009 acquisition of
American Diagnostica Inc., a leading company in the clinical reagents field in the United States.
2) Full-year Forecasts
a. Consolidated Forecast
Net sales ¥860.0 billion (-7.9%), operating income ¥27.5 billion (-18.1%), ordinary income ¥24.5
billion (-16.8%), net income ¥10.0 billion (+887.1%)
Fiscal 2009 will mark the launch of the five-year medium-term business plan GS21-SHINKA! The
new business plan will seek to enhance the Company’s earning power and fortify the corporate
structure by establishing a course for steady income growth for the core businesses, with a focus on
the domestic businesses. The plan will also seek to expand business by concentrating management
resources in seven strategic high-growth fields, dubbed the “Frontier 7”*. The plan also outlines
objectives for a three pronged advance in global development, value chain development throughout
the business chain from front-end to post processes and new growth segment cultivation in new
markets for the Company, such as the environmental field and the housing stock business.
In the plan’s first year, fiscal 2009, amid an anticipated harsh economic environment, the Company
will implement structural reform aimed at fortifying the Company’s earning power while identifying
business opportunities and concentrating management resources in business fields and market
regions where increasing demand is expected.
-6-
7. Sekisui Chemical (4204) Summary of Financial Results for the Fiscal Year 2008 Ended March 31, 2009
* The Frontier 7 high-growth fields are housing stock, pipeline renewal business,
water infrastructure overseas, automotive materials (AT), IT-related materials (IT), and medical
products (MD).
b. Company Forecasts
Housing
Net sales ¥404.0 billion (-4.8%), operating income ¥17.5 billion (+2.1%)
The Housing Company in fiscal 2009 aims to continue its business growth in an unpredictable
operating environment by continuing to enhance its operating efficiency and cut costs while
establishing the housing stock business as a new revenue source. In the new housing construction
business, the company took steps to establish a high-revenue operating structure in the previous
fiscal year with the reorganization of its marketing network covering the Tokyo, Chubu, and Kinki
regions. In fiscal 2009, the company will aim to create a management structure with fully integrated
production and sales operations and to leverage it regional-based operating structure to attract
increased orders and improve its earning power.
On a backdrop of governmental economic stimulation policies, including tax breaks and subsidies,
intended to promoting housing construction, the company will seek to increase orders by further
differentiating the environmental and economical features of its housing products and introducing
products for the anticipated growth in the market for ¥500,000/tsubo price range housing.
In the living environment business, the company aims to increases earnings by enhancing its
marketing capabilities through ongoing staff education and training and by seeking to expand sales
of its feature products.
The business is also establishing a business model based on cyclical housing stock to meet the
evolving needs of occupants as they progress through life stages.
Urban Infrastructure and Environmental Products
Net sales ¥217.0 billion (-3.6%), operating income ¥1.7 billion (+3.0%)
The UIEP Company is laying the groundwork for new growth in both its domestic and overseas
operations while formulating a business structure resilient to fluctuating business conditions. The
company will partially revise its divisional system and continue to restructure its production and
sales operations to better meet the demands of the changing market environment. The company will
also implement measures to enhance its earning power in its core fields as well as to accelerate its
business expansion in its growth fields.
In Japan, the UIEP Company will focus primarily on the housing stock field. Business growth will
-7-
8. Sekisui Chemical (4204) Summary of Financial Results for the Fiscal Year 2008 Ended March 31, 2009
be accelerated in social infrastructure fields centered on the pipe restoration business. In fiscal 2009,
the company will also create a specialized operation for the construction stock field encompassing
condominiums, office buildings, and other structures, with the aim of quickly generating new
business.
Overseas, the company will endeavor to expand business in each of its three key fields of pipe
restoration, functional materials, and water infrastructure. With Sekisui CPT G.m.b.H. at the
forefront, the UIEP Company’s objective is to become the world’s leading pipe restoration company.
In addition, the company is examining the business potential for its water infrastructure business in
developing countries.
High Performance Plastics
Net sales ¥226.0 billion (-14.0%) to, operating income ¥10.5 billion (-33.5%)
The HPP Company is anticipating declining demand from the impact of the strong yen and the
worsening market conditions. The company’s top priority in fiscal 2009 will be to hold fixed costs
below the break-even point set by an increase in marginal income and the declining sales. Efforts to
regulate fixed costs will include constraining new capital investment and cutting costs.
To increase marginal income, the company will seek to boost sales by advancing the cultivation of
frontier fields and development of new products while conducting a comprehensive overhaul of
operations from sales and marketing to distribution and taking steps to offset the impact of high raw
material costs as well as other measures.
In addition, the company will prepare for a future recovery of demand by concentrating management
resources and laying the groundwork for business expansion in the strategic automotive, IT, and
medical fields. In the automotive field, the company is planning to expand production capacity for
its core interlayer film business as it seeks to raise its competitiveness to new level in the global
market. In the IT field, the company is setting a course for substantial growth in sales of its LCD
chemical products and optical films while also cultivating competitive next-generation products. In
the medical field, XenoTech, LLC. and American Diagnostica Inc. are expanding the HPP
company’s business content in the United States through aggressive development of their overseas
businesses in pharmacokinetics and clinical reagents.
2. Consolidated Financial Position
1) Cash Flow (April 1, 2008, to March 31, 2009)
Net cash provided by operating activities increased to ¥35.6 billion. Cash inflows included ¥12.8
billion in income before income taxes and minority interests, ¥36.5 billion in depreciation and
amortization, and a ¥20.3 billion decline in trade notes and accounts receivable, which exceeded
-8-
9. Sekisui Chemical (4204) Summary of Financial Results for the Fiscal Year 2008 Ended March 31, 2009
cash outflows that included a ¥17.3 billion increase in trade notes and accounts payable and ¥14.0
billion in income taxes paid.
Net cash used in investing activities decreased to ¥35.4 billion. The decline was primarily due to
aggressive investments including ¥25.7 billion to acquire tangible fixed assets focused on strategic
areas and growth fields and ¥9.5 billion to acquire subsidiary stock of XenoTech, LLC and
Chevalier Pipe Technologies G.m.b.H. to incorporate the companies as consolidated subsidiaries of
the Sekisui Chemical Group.
Net cash provided by financing activities increased ¥13.8 billion. The main elements were dividend
payments of ¥7.9 billion and a net increase in interest-bearing debt of ¥21.9 billion.
The result was cash and cash equivalents totaling ¥40.4 billion at the end of fiscal 2008.
2) Forecast
The Company will continue to advance its business activities with a strong emphasis on cash flow
and will continue fortifying the Company’s financial position while focusing investment on strategic
areas and growth fields.
Trend in Cash Flow Indicators
FY2004 FY2005 FY2006 FY2007 FY2008
Equity Ratio (%) 41.4 46.7 45.9 45.8 42.6
Shareholders’
Equity Ratio Based
55.4 65.3 56.6 40.5 34.0
on Market Value
(%)
Cash Flow to
Interested-bearing 2.5 2.5 2.7 2.9 3.6
Debt Ratio
Interest coverage Ratio 16.7 14.5 20.4 12.6 13.1
Notes: Equity ratio = Equity / Total assets
Shareholders’ equity ratio based on market value = Total market value of listed shares / Total assets
Interest coverage ratio = Operating cash flow / Interest payments
1. All indicators are calculated from consolidated figures.
2. Total market value of listed shares is calculated by multiplying the closing stock price at the
fiscal term end by the total number of shares outstanding excluding treasury stock at the fiscal
term end.
3. Cash flow is the cash flow from operating activities.
-9-
10. Sekisui Chemical (4204) Summary of Financial Results for the Fiscal Year 2008 Ended March 31, 2009
4. Interest-bearing debt represents the total amount of debt on which the company pays interest
reported in the consolidated balance sheet. The interest payment amount is the amount reported
in the consolidated statement of cash flows.
3) Fundamental Profit Distribution Policy and Dividends for Fiscal 2008 and Fiscal 2009
Increasing corporate value and returning profit to our shareholders are fundamental management
objectives at Sekisui Chemical. The Company’s objective for shareholder return is to maintain a
stable dividend level with a target consolidated-basis dividend payout ratio of 30%. The Company
pays dividends twice annually with the dates of record set as the last day of the first half (September
30) and the last day of the fiscal year (March 31). In line with company policy, when in possession
of surplus funds, these funds are used for share buyback programs to enhance shareholder return as
well as to improve capital efficiency and increase earnings per share. Internal cash reserves are
utilized for R&D, capital investment, strategic investment, loans and investments, and other
activities essential to the future growth of corporate value.
In fiscal 2008, Company’s performance in the extremely severe business environment necessitate a
revision to our planned dividend distributions resulting in a first half dividend of ¥7 and a second
half dividend of ¥3, resulting in a full-year dividend payment of ¥10 per share.
The Company is aware of the necessity to take a cautious stance when scrutinizing the economic
environment but is also mindful of its objective to provide reliable return to shareholders. In fiscal
2009, the Company plans to provide a first half dividend of ¥5 and a second half dividend of ¥5 for
a full-year dividend distribution of ¥10 per share.
2. Management Policies
1) Basic Management Policy
The Sekisui Chemical Group aims to grow its business based on satisfied customers and to
maximize corporate value and fulfill the expectations of our shareholders. We support the
self-fulfillment of our employees, who are the main component in our corporate activities, and seek
to deepen our relations with our client and partner companies. Through our business, products and
social contributions, we support local communities and the earth’s environment fully aware that we
play a part in the legacy we will leave to future generations. We at the Sekisui Chemical Group will
continue to grow as a prominent and highly profitable corporation while striving to meet the
expectations of our stakeholders.
2) Management Index Targets
The Sekisui Chemical Group considers operating income and the operating income ratio to be
important indicators of the Company’s business performance and strives to maintain and raise their
values.
- 10 -
11. Sekisui Chemical (4204) Summary of Financial Results for the Fiscal Year 2008 Ended March 31, 2009
3) Medium- and Long-term Business Strategy
The Company expects the worldwide economic crisis to produce a very severe business
environment. In these conditions, the Sekisui Chemical Group commenced a new management
structure in March 2009 and launched “the GS21-SHINKA!” medium-term business plan for the
five years from fiscal 2009 to fiscal 2013 with the aim of realizing the vision of becoming a
prominent and high-profit premium company. Shinka is the Japanese word meaning evolution or
advancement.
The first two years of “the GS21-SHINKA!” plan concentrate on overcoming the global recession
and taking steps to lay a strong foundation for future advances. In the remaining three years, the plan
focuses on strengthening its abilities to cultivate new business frontiers and implement new
enhancement to support the Group’s medium- and long-term development.
The plan denominates Frontier SHINKA, Manufacturing Development SHINKA, and Human
Resource SHINKA as the top priorities to be followed throughout the Group and makes the
application of these initiatives the fundamental driving strategy for the evolution and advancement
of the Group.
Frontier SHINKA focuses on global development, value chain development, and new growth
segment cultivation. The objective is to strengthen the Group’s global development capabilities and
conduct strategic investment in growth fields with the goal of doubling of net sales achieved
overseas, and to leverage the Company’s proprietary technology to create next-generation businesses
and cultivate new business frontiers.
Manufacturing Development SHINKA seeks to realize a reduction in costs by joining the
innovativeness of current the making of things activities with the advances made in production
technologies to transcend existing methods.
Human Resource SHINKA aims to achieve an evolution in human resources by enriching
employees so they can realize their career objectives. Human resources will be cultivated to be fully
professional and capable of flourishing on a global level, and worksite environments will have a
diverse range of personnel.
4) Critical Issues Facing the Company
The Sekisui Chemical Group is cognizant of the foremost priorities necessary for implementing and
fulfilling the objectives of the GS21-SHINKA! medium-term business plan. While swiftly carrying
out structural reform, substantially reducing fixed costs, and cutting back on standard investments in
order to improve the Group’s profitability, the Group will seek to adroitly and quickly identify
changes in the global markets and take steps to accelerate new business growth.
- 11 -
12. Sekisui Chemical (4204) Summary of Financial Results for the Fiscal Year 2008 Ended March 31, 2009
3. Other
3-1) Changes in accounting principles, methods or reporting methods affecting the production of the
consolidated financial statement
(Practical Solution on Unification of Accounting Policies Applied to Foreign Subsidiaries for
Consolidated Financial Statements)
Effective the year ended March 31, 2009, the Company and its overseas consolidated subsidiaries
have adopted the Practical Issues Task Force (PITF) No. 18 Practical Solution on Unification of
Accounting Policies Applied to Foreign Subsidiaries for Consolidated Financial Statements (issued
May 17, 2006) and have made necessary adjustments in the consolidation financial statements.
These revisions had a minimal effect on the consolidated financial statements and segment
information.
(Application of Accounting Standards for Lease Transactions)
Finance lease transactions without title transfer were formerly accounted as operating leases. On
March 30, 2007, the ASBJ issued ASBJ Statement No. 13, “Accounting Standard for Lease
Transactions,” which revised the former accounting standard for lease transactions issued on June 17,
1993, and ASBJ Guidance No. 16, “Guidance on Accounting Standard for Lease Transactions,”
which revised the former guidance issued on January 18, 1994. Accordingly, the Company has
applied the revised accounting standard from the first quarter of the fiscal year under review.
As a result of the adoption of this accounting standard and the related guidance, operating income
increased by ¥237 million, ordinary income increased by ¥144 million, and income before income
taxes and minority interests declined by ¥1 million for the year ended March 31, 2009, from the
corresponding amounts which would have been recorded under the method applied in the previous
year.
The effect of the changes on the segment data was insignificant.
(Supplementary Information)
Change in the Useful Lives of Property, Plant and Equipment
Upon the adoption of revisions to the Corporate Tax Law, the Company and its consolidated
subsidiaries in Japan revised the useful lives applied to a certain number of equipment and
machinery.
The effect of the changes on the consolidated balance sheets and segment data was insignificant.
- 12 -
13. Sekisui Chemical (4204) Summary of Financial Results for the Fiscal Year 2008 Ended March 31, 2009
4. Consolidated Financial Statement (Fiscal Year 2008)
(1)Consolidated Balance Sheets
(Millions of Yen)
End Fiscal 2007, End Fiscal Year 2008,
Condensed Consolidated Condensed Consolidated
Balance Sheet Balance Sheet
As of March. 31, 2008 As of March. 31, 2009
(Assets)
Current Assets
Cash and deposits 30,280 40,842
Trade notes receivable 55,515 44,435
Accounts receivable 112,929 97,950
Securities 29 1
Product inventories 41,595 44,333
Subdivision land 24,355 23,808
Work in progress 32,456 32,716
Raw materials 17,811 19,161
Advances 2,214 1,066
Prepaid expenses 2,057 1,967
Deferred tax assets 11,410 8,338
Short-term loans 897 1,395
Other 12,252 15,390
Allowance for doubtful accounts -1,356 -887
Total current assets 342,450 330,521
Fixed assets
Tangible fixed assets
Buildings & structures, net 89,137 82,743
Machinery, equipment and tools, net 69,731 60,788
Land 68,880 67,674
Leased assets (net value) 9,416
-
Construction in progress 7,450 11,630
Other (net) 8,266 6,576
Total tangible fixed assets 243,466 238,830
Intangible fixed assets
Goodwill 20,176 25,645
Software 4,244 4,227
Leased assets 354
-
Other 3,016 3,538
Total intangible assets 27,437 33,766
Investments and other assets
Investment securities 133,172 109,923
Long-term loans 1,006 593
Long-term prepaid expenses 1,440 1,404
Deferred income taxes 23,929 31,834
Other 11,278 10,366
Allowance for doubtful accounts -1,320 -790
Total investments and other assets 169,506 153,332
Total fixed assets 440,409 425,929
Total assets 782,859 756,450
-13-
14. Sekisui Chemical (4204) Summary of Financial Results for the Fiscal Year 2008 Ended March 31, 2009
(Millions of Yen)
End Fiscal 2007, End Fiscal Year 2008,
Condensed Consolidated Condensed Consolidated
Balance Sheet Balance Sheet
As of March. 31, 2008 As of March. 31, 2009
(Liabilities)
Current liabilities
Trade notes payable 14,141 11,469
Accounts payable 118,937 107,327
Short-term loans 34,478 32,446
Commercial paper 20,000
-
Current portion of corporate bonds 5,365
-
Lease obligation 4,431
-
Accrued charges 7,965
-
Accrued expenses 30,200 24,649
Accrued income taxes 11,661 6,297
Deferred tax liabilities 258 147
Provision for bonuses 13,009 12,809
Provision for directors' bonuses 299 160
Provision for compensation for completed constructions 996 1,010
Advances received 34,139 33,474
Other 34,613 34,478
Total current liabilities 292,736 302,033
Fixed liabilities
Bonds 15,608 10,000
Long-term loans 42,011 51,811
Lease obligation 5,353
-
Deferred tax liabilities 2,655 2,952
Provision for retirement allowances 54,575 48,195
Other 6,353 5,382
Total fixed liabilities 121,203 123,695
Total liabilities 413,940 425,729
(Net assets)
Shareholders’ equity
Common stock 100,002 100,002
Capital surplus 109,367 109,307
Retained earnings 154,073 146,931
Treasury stock -10,844 -10,833
Total shareholders’ equity 352,599 345,408
Revaluation and translation adjustments
Unrealized holding gain (loss) on securities -933 -11,227
Deferred gains or losses on hedges 7
-
Unrealized gain on land revaluation 217 224
Foreign currency translation adjustments 7,033 -12,411
Total revaluation and translation adjustments 6,317 -23,408
Share subscription rights 237 386
Minority shareholders' interests 9,764 8,334
Total net assets 368,919 330,721
Total liabilities, net assets 782,859 756,450
- 14 -
15. Sekisui Chemical (4204) Summary of Financial Results for the Fiscal Year 2008 Ended March 31, 2009
(2) Consolidated Profit and Loss Statement
(Fiscal Year 2008)
(Millions of Yen)
Fiscal 2007 Fiscal 2008
(From April. 1, 2007 (From April. 1, 2008
to March. 31, 2008) to March. 31, 2009)
Net sales 958,674 934,225
Cost of sales 685,902 680,446
Gross income 272,772 253,779
Selling, general & administrative expenses 229,766 220,189
Operating Income 43,005 33,589
Non-operating income
Interest income 1,299 1,230
Dividend income 2,620 2,268
Investment income by equity method 589 1,409
Miscellaneous income 3,453 2,454
Total non-operating income 7,963 7,363
Non-operating expenses
Interest expenses 2,127 2,480
Interest on Commercial Paper 12 31
Sales discounts 320 312
Foreign exchange loss(net) 3,784 2,616
Miscellaneous expenses 6,176 6,073
Total non-operating expenses 12,422 11,513
Recurring income 38,547 29,438
Extraordinary income
Gain on sales of property, plant, and equipment 687
-
Gain on sales of investments in securities 23,163 -
Proceeds from business transfer 478 -
Total extraordinary income 23,641 687
Extraordinary expenses
Charges 7,965
-
Structural improvement expenses 10,152 4,257
Loss from revaluation of investment securities 2,782
-
Loss on Valuation of Equity Securities for Nonconsolidated and Affiliates 453
-
Impairment loss 1,374 70
Loss from revaluation of product inventries 3,069 -
Loss on sales or disposal of property, plant, and equipment 2,600 1,753
Total extraordinary expenses 17,195 17,283
Income (loss) before income taxes and minority interests 44,993 12,842
Income taxes 16,433 9,029
Diferred Taxes 3,512 2,485
Minority interests 747 313
Net Income 24,300 1,013
- 15 -
16. Sekisui Chemical (4204) Summary of Financial Results for the Fiscal Year 2008 Ended March 31, 2009
(3) Consolidated Statements of Capital Surplus and Retained Earnings, and changes in Shareholders' Equity
(Millions of Yen)
Fiscal 2007 Fiscal 2008
(From April. 1, 2007 (From April. 1, 2008
to March. 31, 2008) to March. 31, 2009)
Shareholders’ Equity
Common stock
Balance at the end of the previous accouting period 100,002 100,002
Changes
Total Changes - -
Balance at the end of the current accouting period 100,002 100,002
Capital surplus
Balance at the end of the previous accouting period 109,420 109,367
Changes
Cancellation of treasury stock -53 -59
Total Changes -53 -59
Balance at the end of the current accouting period 109,367 109,307
Retained earnings
Balance at the end of the previous accouting period 137,712 154,073
Increase (Decrease) from changes due to accouting procedure
-42
-
in overseas bussidiaries
Changes
Dividends on retained earnings -7,924 -7,887
Net income 24,300 1,013
Decrease in retained earnings due to increase in consolidated subsidiaries -8 -226
Decrease in retained earnings due to exclusion in consolidated subsidiaries -6 -
Total Changes 16,361 -7,100
Balance at the end of the current accouting period 154,073 146,931
Treasury stock
Balance at the end of the previous accouting period -6,375 -10,844
Changes
Acquisition of treasury stock -4,734 -150
Cancellation of treasury stock 265 161
Total Changes -4,468 10
Balance at the end of the current accouting period -10,844 -10,833
Total shareholders' equity
Balance at the end of the previous accouting period 340,759 352,599
Increase (Decrease) from changes due to accouting procedure
-42
-
in overseas bussidiaries
Changes
Dividends on retained earnings -7,924 -7,887
Net income 24,300 1,013
Decrease in retained earnings due to increase in consolidated subsidiaries -8 -226
Decrease in retained earnings due to exclusion in consolidated subsidiaries -6 -
Acquisition of treasury stock -4,734 -150
Cancellation of treasury stock 212 102
Total Changes 11,839 -7,148
Balance at the end of the current accouting period 352,599 345,408
Revaluation and Translation Adjustments
Unrealized holding gain (loss) on securities
Balance at the end of the previous accouting period 57,427 -933
Changes
Changes in items other than shareholders' equity (net) -58,361 -10,294
Total Changes -58,361 -10,294
Balance at the end of the current accouting period -933 -11,227
Deferred gains or losses on hedges
Balance at the end of the previous accouting period - -
Changes
Changes in items other than shareholders' equity (net) 7
-
Total Changes 7
-
Balance at the end of the current accouting period 7
-
Unrealized gain on land revaluation
Balance at the end of the previous accouting period 216 217
Changes
Changes in items other than shareholders' equity (net) 1 6
Total Changes 1 6
Balance at the end of the current accouting period 217 224
Foreign currency translation adjustments
Balance at the end of the previous accouting period 5,419 7,033
Changes
Changes in items other than shareholders' equity (net) 1,614 -19,445
Total Changes 1,614 -19,445
Balance at the end of the current accouting period 7,033 -12,411
Total revaluation and translation adjustments
Balance at the end of the previous accouting period 63,063 6,317
Changes
Changes in items other than shareholders' equity (net) -56,745 -29,726
Total Changes -56,745 -29,726
Balance at the end of the current accouting period 6,317 -23,408
- 16 -
17. Sekisui Chemical (4204) Summary of Financial Results for the Fiscal Year 2008 Ended March 31, 2009
(Millions of Yen)
Fiscal 2007 Fiscal 2008
(From April. 1, 2007 (From April. 1, 2008
to March. 31, 2008) to March. 31, 2009)
Share subscription rights
Balance at the end of the previous accouting period 73 237
Changes
Changes in items other than shareholders' equity (net) 163 149
Total Changes 163 149
Balance at the end of the current accouting period 237 386
Minority shareholders' interests
Balance at the end of the previous accouting period 9,244 9,764
Changes
Changes in items other than shareholders' equity (net) 520 -1,430
Total Changes
520 -1,430
Balance at the end of the current accouting period 9,764 8,334
Total net assets
Balance at the end of the previous accouting period 413,141 368,919
Increase (Decrease) from changes due to accouting procedure -42
-
Changes
Dividends on retained earnings -7,924 -7,887
Net income 24,300 1,013
Decrease in retained earnings due to increase in consolidated subsidiaries -8 -226
Decrease in retained earnings due to exclusion in consolidated subsidiaries -6 -
Acquisition of treasury stock -4,734 -150
Cancellation of treasury stock 212 102
-56,061 -31,006
Changes in items other than shareholders' equity (net)
-44,222 -38,155
Total Changes
368,919 330,721
Balance at the end of the current accouting period
- 17 -
18. Sekisui Chemical (4204) Summary of Financial Results for the Fiscal Year 2008 Ended March 31, 2009
(4)Consolidated Statements of Cash Flows
(Fiscal Year 2008) (Millions of Yen)
Fiscal 2007 Fiscal 2008
(From April. 1, 2007 (From April. 1, 2008
to March. 31, 2008) to March. 31, 2009)
Operating activities
44,993 12,842
Income (loss) before income taxes and minority interests
Depreciation and amortization 30,503 36,529
Goodwill amortization 1,697 2,426
Impairment loss 1,374 70
Loss on disposal of property, plant and equipment 1,642
-
Loss on sales or disposal of property, plant, and equipment 2,600 -
Loss on sales of marketable and investment securities -23,163 -
Loss from revaluation of marketable and investment securities 2,782
-
Decrease in allowance for retirement benefits -6,126 -5,914
Interest and dividend income -3,920 -3,499
Interest expense 2,460 2,823
Equity in earnings of affiliates -589 -1,409
Decrease in trade notes and accounts receivable 9,587 20,363
Increase in inventories -5,309 -6,079
Decrease in account payable -6,267 -17,363
Increase in advances received -3,679 -733
Other 3,689 3,984
Subtotal 47,848 48,466
Interest and dividends received 4,344 3,952
Interest paid -2,517 -2,711
Income taxes paid -17,893 -14,096
Net cash (used in) provided by operating activities 31,782 35,611
Investing activities
Purchases of property, plant and equipment -32,363 -25,749
Proceeds from sales of property, plant and equipment 960 1,199
Purchases of investment securities -3,004 -3,876
Proceeds from sales or redemption of investment securities 53,627 5,373
-9,523
-
Purchase of stocks of newly consolidated subsidiaries
Proceeds from sales of shares of subsidiaries 1,381 -
Expenses associated with business transfer -5,780 -
Purchases of consolidated subsidiaries' share from minority shareholders -375 -
Purchases of intangible assets -1,913
-
-2,993 -
Purchases of intangible assets and long-term prepaid expenses
Increase (decrease) in short-term loans 1,604 -535
Purchases of long-term loans -281 -
Proceeds from recovery of long-term loans 68 -
Other 677 -378
Net cash (used in) provided by investing activities 13,521 -35,403
Financing activities
Decrease (increase) from short-term loans, net -110 -493
Payment for return of finance leases -5,850
-
Net increase (decrease) in commercial paper -3,000 20,000
Proceeds from long-term loans 15,713 15,592
Repayment of long-term loans -32,315 -7,299
Repayment of bonds -10,000 -
Dividends paid -7,921 -7,885
-185 -110
Cash dividends paid to minority shareholders of consolidated subsidiaries
Proceeds from sales of treasury stock 13 -
Purchase of treasury stock -4,733 -147
Other -261 84
Net cash used in financing activities -42,801 13,889
Effect of exchange rate changes on cash and cash equivalents -296 -3,825
Net increase in cash and cash equivalents 2,206 10,271
Cash and cash equivalents at beginning of term 25,968 29,852
Increase in cash and cash equivalents resulting from additional consolidation of subsidiaries 1,697 363
Decrease in cash and cash equivalents resulting from exclusion
-20 -
of subsidiaries from consolidation
Cash and cash equivalents at end of term 29,852 40,488
- 18 -
19. Sekisui Chemical (4204) Summary of Financial Results for the Fiscal Year 2008 Ended March 31, 2009
5. Segment Information
1) Business segments
Fiscal Year 2007(April. 1, 2007 to March. 31, 2008) (Millions of yen)
Eliminations
Urban
High
Other or
Infrastructure &
Housing Performance Total Consolidated
Business Unallocatable
Environmental
Plastics
Products Accounts
I. Net sales:
(1)To third parties 419,791 222,483 273,267 43,132 958,674 958,674
-
(2)Intersegment 187 11,273 7,219 5,409 24,090 -24,090 -
Total 419,978 233,756 280,487 48,541 982,764 -24,090 958,674
Operating expenses 405,846 227,625 255,997 49,948 939,418 -23,749 915,669
14,132 6,131 24,489 -1,406 43,346 -340 43,005
Operating income (loss)
II. Assets 179,871 177,627 249,562 42,959 650,021 132,838 782,859
Depreciation and amortization 5,595 7,053 15,235 1,917 29,803 699 30,503
Loss on asset impairment 1,374 1,374 1,374
-
- - -
Capital expenditures 5,570 8,210 15,183 1,439 30,404 863 31,267
Note 1. Companywide assets, including those listed in the eliminations or unallocatable accounts category, were 189,755 million yen
in fiscal year 2007. This mainly consisted of cash and cash equivalents and long-term investments (investment securities)
held by the parent company, assets related to administrative departments and deferred tax assets.
2.Changes in Accounting Methods(for the Fiscal Year 2007)
(1)Accounting Standards for Inventory Asset Valuation
The Accounting Standards for Valuation of Inventory Assets (Accounting Standard Statement 9, July 5, 2006) have been applied
beginning in the fiscal year under review. Compared to the previous method, the effect is a decrease in operating expenses
and an increase in operating income for the period under review. By company, operating expenses were as follows:
Housing Company, 429 million yen; Urban Infrastructure & Environmental Products Company, 725 million yen;
High Performance Plastics Company, 76 million yen; and Other Businesses, 16 million yen.
(2)Changes in the Depreciation Accounting Method for Tangible Fixed Assets
The company has revised its accounting method for tangible fixed asset depreciation. Compared to the previous method,
the effect was an increase in operating expenses and a decrease in operating income for the period under review.
By company, operating expenses were as follows: Housing Company, 387 million yen; Urban Infrastructure
& Environmental Products Company, 978 million yen; High Performance Plastics Company, 1,083 million yen;
Other Businesses, 281 million yen; and 15 million yen in eliminations or unallocatable accounts.
Fiscal Year 2008(April. 1, 2008 to March. 31, 2009) (Millions of yen)
Eliminations
Urban
High
Other or
Infrastructure &
Housing Performance Total Consolidated
Business Unallocatable
Environmental
Plastics
Products Accounts
I. Net sales:
(1)To third parties 424,436 213,642 255,450 40,695 934,225 934,225
-
(2)Intersegment 56 11,577 7,192 5,499 24,325 -24,325 -
Total 424,492 225,219 262,642 46,195 958,550 -24,325 934,225
Operating expenses 407,358 223,568 246,845 46,870 924,643 -24,007 900,635
17,134 1,650 15,797 -675 33,907 -317 33,589
Operating income (loss)
II. Assets 183,454 173,993 230,423 43,245 631,118 125,332 756,450
Depreciation and amortization 8,728 7,803 17,124 2,251 35,907 621 36,529
Loss on asset impairment 70 70 70
- - - -
6,202 6,233 19,132 1,926 33,495 1,044 34,539
Capital expenditures
Note. Companywide assets, including those listed in the eliminations or unallocatable accounts category, were 184,827 million yen
in fiscal year 2008. This mainly consisted of cash and cash equivalents and long-term investments (investment securities)
held by the parent company, assets related to administrative departments and deferred tax assets.
- 19 -
20. Sekisui Chemical (4204) Summary of Financial Results for the Fiscal Year 2008 Ended March 31, 2009
2) Geographical Segments
Fiscal Year 2007(April. 1, 2007 to March. 31, 2008) (Millions of yen)
Eliminations
Japan United States Europe Asia Others Total or unallocatable Consolidated
accounts
I. Net sales:
(1)To third parties -
825,747 33,811 41,510 53,212 4,392 958,674 958,674
(2)Intersegment -
32,599 1,009 1,124 2,259 69 37,062 -37,062
Total 858,347 34,820 42,635 55,472 4,462 995,737 -37,062 958,674
Operating expenses 827,250 31,830 37,915 51,685 4,063 952,744 -37,075 915,669
Operating income 31,096 2,990 4,719 3,786 398 42,992 13 43,005
II. Assets 529,236 29,181 40,579 49,775 4,006 652,778 130,081 782,859
Notes: 1. Country and regional segments are classified on the basis of geographic proximity.
2. Principal countries and regions other than Japan:
United States: The United States of America
Europe: Germany, the United Kingdom, the Netherlands, Switzerland, Italy, Spain and France
Asia: Thailand, South Korea, Singapore, China, and Taiwn
Other: Mexico and Australia
3. Please refer to Note 1 in the Segment Information section for the main items of company-wide assets included
under eliminations or unallocatable accounts in assets.
4.Changes in Accounting Methods(for the Fiscal Year 2007)
(1)Accounting Standards for Inventory Asset Valuation
The Accounting Standards for Valuation of Inventory Assets (Accounting Standard Statement 9, July 5, 2006) have been applied
beginning in the fiscal year under review. Compared to the previous method, the effect is a 1,246 million yen decrease
in operating expenses and an increase in operating income in the Japan geographical segment for the period under review.
(2)Changes in the Depreciation Accounting Method for Tangible Fixed Assets
The company has revised its accounting method for tangible fixed asset depreciation. Compared to the previous method,
the effect is a 2,746 million yen increase in operating expenses and a decrease in operating income
in the Japan geographical segment for the period under review.
Fiscal Year 2008(April. 1, 2008 to March. 31, 2009) (Millions of yen)
Eliminations
Japan United States Europe Asia Others Total or unallocatable Consolidated
accounts
I. Net sales:
(1)To third parties -
805,903 33,899 42,264 46,632 5,525 934,225 934,225
(2)Intersegment -
29,407 2,083 1,386 3,306 279 36,463 -36,463
Total 835,310 35,983 43,650 49,938 5,804 970,688 -36,463 934,225
Operating expenses 810,170 34,237 40,408 48,267 4,962 938,046 -37,410 900,635
Operating income 25,139 1,745 3,242 1,670 842 32,641 947 33,589
II. Assets 523,838 31,746 36,770 44,641 4,880 641,877 114,573 756,450
Notes: 1. Country and regional segments are classified on the basis of geographic proximity.
2. Principal countries and regions other than Japan:
United States: The United States of America
Europe: Germany, the United Kingdom, the Netherlands, Switzerland, Italy, Spain and France
Asia: Thailand, South Korea, Singapore, China, Taiwn, and UAE
Other: Mexico and Australia
3. Please refer to Note 1 in the Segment Information section for the main items of company-wide assets included
under eliminations or unallocatable accounts in assets.
- 20 -
21. Sekisui Chemical (4204) Summary of Financial Results for the Fiscal Year 2008 Ended March 31, 2009
3) Overseas net sales
Fiscal Year 2007(April. 1, 2007 to March. 31, 2008)
United
Europe Asia Others Total
States
I Overseas net sales (millions of yen) 38,557 45,032 66,767 4,767 155,124
II Consolidated net sales (millions of yen) 958,674
III Overseas net sales as a ratio of consolidated net sales (%) 4.0 4.7 7.0 0.5 16.2
Notes: 1. Country and regional segments are classified on the basis of geographic proximity.
2. Principal countries and regions:
United States: The United States of America
Europe: Germany, the United Kingdom, the Netherlands, Switzerland, Italy, Spain and France
Asia: Thailand, South Korea, Singapore, China, and Taiwan
Other: Mexico and Australia
3. Overseas sales represent the amount of sales within each country or region and exclude sales of the parent company and consolidated
subsidiaries in Japan.
Fiscal Year 2008(April. 1, 2008 to March. 31, 2009)
United
Europe Asia Others Total
States
I Overseas net sales (millions of yen) 38,985 47,626 59,022 5,961 151,596
II Consolidated net sales (millions of yen) 934,225
III Overseas net sales as a ratio of consolidated net sales (%) 4.2 5.1 6.3 0.6 16.2
Notes: 1. Country and regional segments are classified on the basis of geographic proximity.
2. Principal countries and regions:
United States: The United States of America
Europe: Germany, the United Kingdom, the Netherlands, Switzerland, Italy, Spain and France
Asia: Thailand, South Korea, Singapore, China, Taiwan, and UAE
Other: Mexico and Australia
3. Overseas sales represent the amount of sales within each country or region and exclude sales of the parent company and consolidated
subsidiaries in Japan.
- 21 -
22. Sekisui Chemical (4204) Summary of Financial Results for the Fiscal Year 2008 Ended March 31, 2009
Major Subsequent Events
Sekisui Chemicals passed the resolution at the Board of Directors’ meeting on April 27th, 2009,
to have one of its subsidiaries that are under plan to be newly established, to acquire the
polyvinyl alcohol (PVA) resin business from one of the group companies of the US-based
chemical company, Celanese Corporation.
A) The Subsidiary Under Plan to be Newly Established: The subsidiary is under plan to be
established on May, 2009 in the US and Spain in order for the transfer of the PVA resin
business of Celanese Corporation to take place.
B) The Objective of Business Transfer: To strengthen the business supply-chain.
Development of a stable raw materials supply system in the interlayer film business.
•
Acceleration of production in the point of demand.
•
Realization of technical synergy on the raw materials side.
•
C) Content of the Business to be Transferred: Assets relating to the PVA resin business of
Celanese Corporation, such as facilities and equipment, inventories, as well as intellectual
property rights, etc.
D) Schedule of Business Transfer: June, 2009 (under plan)
E) Cost of Transfer: 173 million dollars
-22-