SlideShare une entreprise Scribd logo
1  sur  7
Télécharger pour lire hors ligne
TORCHMARK CORPORATION
                                                           Operating Summary (Unaudited)
                                                          (In thousands, except per share amounts)


   3 Months Ended                                                                       1Q             4Q         3Q         2Q         1Q
 3/09          3/08                                                                    2009           2008       2008       2008       2008
                         UNDERWRITING INCOME
                           Life:
$412,748     $402,948          Premium                                                $412,748       $401,250   $406,114   $406,492   $402,948
-164,478     -166,868          Net Policy Obligations                                 -164,478       -158,453   -165,351   -172,032   -166,868
-137,800     -128,505          Commissions and Acquisition Expenses                   -137,800       -130,747   -132,753   -130,320   -128,505
 110,470      107,575             Underwriting Margin                                  110,470        112,050    108,010    104,140    107,575

                            Health:
 224,037      253,095         Premium                                                   224,037       224,954    230,855    242,400    253,095
-132,755     -157,113         Net Policy Obligations                                   -132,755      -138,058   -143,027   -151,000   -157,113
 -50,517      -50,478         Commissions and Acquisition Expenses                      -50,517       -44,989    -45,966    -47,723    -50,478
  40,765       45,504             Underwriting Margin                                    40,765        41,907     41,862     43,677     45,504

   4,819        4,899          Health - Part D Underwriting Margin                        4,819         4,978      6,446      5,438      4,899

  -4,096        1,125       Annuity Underwriting Margin                                  -4,096        -8,827       305        974       1,125

 151,958      159,103       Total Underwriting Margin                                  151,958        150,108    156,623    154,229    159,103

     666           847      Other Income                                                    666         1,127      1,157      1,023        847
 -39,417       -39,773      Admin. Expenses                                             -39,417       -43,032    -38,289    -38,189    -39,773

 113,207      120,177             Underwriting Income                                  113,207        108,203    119,491    117,063    120,177

                         EXCESS INVESTMENT INCOME

 168,977      166,837       Net Investment Income                                      168,977        167,666    168,968    167,760    166,837

 -73,218       -67,304      Required Interest on Net Policy Liabilities                 -73,218       -73,520    -70,354    -68,947    -67,304
 -15,598       -16,106      Interest on Debt                                            -15,598       -16,666    -15,441    -14,752    -16,106

  80,161       83,427       Total Excess Investment Income                              80,161         77,480     83,173     84,061     83,427

  -1,932        -1,659   Parent Company Expenses                                         -1,932        -4,477     -1,626     -2,693     -1,659


 191,436      201,945    Pre-Tax Operating Income                                      191,436        181,206    201,038    198,431    201,945

 -64,594       -68,488   Income Tax                                                     -64,594       -61,013    -66,973    -65,824    -68,488

$126,842     $133,457    Net Operating Income Before Stock Compensation Expense       $126,842       $120,193   $134,065   $132,607   $133,457

  -1,587        -1,622   Stock Compensation Expense, Net of Tax                          -1,587        -1,636     -1,771     -2,006     -1,622

$125,255     $131,835    Net Operating Income                                         $125,255       $118,557   $132,294   $130,601   $131,835

   $1.49        $1.43    Per Share                                                        $1.49         $1.40      $1.51      $1.44      $1.43

  83,875       91,877    Average Diluted Shares Outstanding                             83,875         84,987     87,811     90,698     91,877

                         Reconciling items, net of tax:
      $0           $12     Gain on Sale of Agency Buildings                                  $0            $0        $35      $134         $12
 -41,045        -4,526     Capital Gain (Loss) - Investments                            -41,045        11,046    -71,394     -5,004     -4,526
 -10,663        -8,626     Part D Adjustment                                            -10,663         7,572      3,172     -2,118     -8,626
   3,159             0     Tax Settlements                                                3,159           116        601     10,106          0
       0           862     Net Proceeds (Cost) from Legal Settlements                         0           -82     -1,557          7        862
       0        -1,384     Loss on Company Occupied Property                                  0             0          0          0     -1,384

 $76,706     $118,173    Net Income                                                    $76,706       $137,209    $63,151   $133,726   $118,173


                                                                             8
TORCHMARK CORPORATION
                                                                              Insurance Operations (Unaudited)
                                                                                       (In thousands)

                                                 LIFE                                     HEALTH                             HEALTH - PART D                     ANNUITY
                              1Q 2009        %          1Q 2008    %      1Q 2009     %        1Q 2008       %    1Q 2009      %       1Q 2008    %    1Q 2009             1Q 2008

LNL Exclusive Agency *
  Premium                          $74,921               $76,298          $106,211                $128,536
  Net Policy Obligations            32,612   44           34,956   46       62,594      59          80,619   63
  Comm. & Acq. Exp.                 25,478   34           22,983   30       26,817      25          26,255   20
      Underwriting Margin           16,831   22           18,359   24       16,800      16          21,662   17
UA Independent
   Premium                           7,481                 8,356             87,799                 94,996
   Net Policy Obligations            3,411   46            3,806   46        54,510     62          60,627   64
   Comm. & Acq. Exp.                 3,571   48            3,985   48        17,966     20          18,733   20
      Underwriting Margin              499    7              565    7        15,323     17          15,636   16
Direct Response
   Premium                         135,283               128,635             11,862                 11,647
   Net Policy Obligations           60,067   44           60,189   47         9,072     76           9,283   80
   Comm. & Acq. Exp.                42,413   31           38,127   30         1,011      9             830    7
       Underwriting Margin          32,803   24           30,319   24         1,779     15           1,534   13
American Income Agency
  Premium                          122,993               115,483             18,165                 17,916
  Net Policy Obligations            38,752   32           37,341   32         6,579     36           6,584   37
  Comm. & Acq. Exp.                 43,669   36           40,699   35         4,723     26           4,660   26
      Underwriting Margin           40,572   33           37,443   32         6,863     38           6,672   37
Military
    Premium                         49,675                50,651
    Net Policy Obligations          20,084   40           20,757   41
    Comm. & Acq. Exp.               16,321   33           16,617   33
       Underwriting Margin          13,270   27           13,277   26
Part D
   Premium                                                                                                         $45,888              $46,621
   Net Policy Obligations                                                                                           37,766      82       37,432   80
   Net Amortization of DAC                                                                                           1,422       3        1,166    3
   Fees to PBM                                                                                                       1,881       4        3,124    7
       Underwriting Margin                                                                                           4,819      11        4,899   11
Other Distribution
   Premium                          22,395                23,525                                                                                         $2,397              $3,981
   Net Policy Obligations            9,552   43            9,819   42                                                                                       239                -718
   Comm. & Acq. Exp.                 6,348   28            6,094   26                                                                                     6,254               3,574
      Underwriting Margin            6,495   29            7,612   32                                                                                    -4,096               1,125

Totals:
   Premium                        $412,748              $402,948          $224,037                $253,095         $45,888              $46,621          $2,397              $3,981
   Net Policy Obligations          164,478   40          166,868   41      132,755      59         157,113   62     37,766      82       37,432   80        239                -718
   Comm. & Acq. Exp.               137,800   33          128,505   32       50,517      23          50,478   20      3,303       7        4,290    9      6,254               3,574
       Underwriting Margin        $110,470   27         $107,575   27      $40,765      18         $45,504   18     $4,819      11       $4,899   11    -$4,096              $1,125

TOTAL UNDERWRITING MARGINS, ALL LINES                                     $151,958                $159,103
Other Income                                                                   666                     847
Administrative & Other Expenses                                             -39,417                -39,773
INSURANCE UNDERWRITING INCOME                                             $113,207                $120,177


* Components of underwriting margin for UA Branch Office Agency are now included in LNL Exclusive Agency


                                                                                              9
TORCHMARK CORPORATION
               Net Sales and First Year Collected Premium (Unaudited)
                                    (In thousands)


NET SALES *
                                          YTD              YTD          % Incr
                                          3/09             3/08         (Decr)
      LIFE
      Direct Response                     $34,201         $30,556           12
      American Income Agency               27,537          24,355           13
      LNL Agency:
        LNL Exclusive Agency               12,787          10,050            27
        UA Branch Office Agency             1,040           2,040           -49
      Military                              1,725           2,146           -20
      UA Independent                          140             164           -15
      Other Distribution                    1,027           1,183           -13
         Total Life                        78,457          70,494            11

      HEALTH
      Direct Response                         413            1,482          -72
      American Income Agency                2,782            2,771            0
      LNL Agency:
        LNL Exclusive Agency                3,525           2,299            53
        UA Branch Office Agency             6,460          25,331           -74
      UA Independent                        7,349           9,903           -26
         Total Health                      20,529          41,786           -51

      Part D                               10,119            9,225          10
      TOTAL NET SALES                   $109,105         $121,505           -10

*     Net sales is defined as annualized premium issued, net of cancellations in
       the first 30 days after issue, except at Direct Response where net sales
       is annualized premium issued at the time the first full premium is paid
       after any introductory offer period has expired.

FIRST YEAR COLLECTED PREMIUM
                                          YTD              YTD          % Incr
                                          3/09             3/08         (Decr)
      LIFE
      Direct Response                     $21,550         $20,602             5
      American Income Agency               21,894          19,237            14
      LNL Exclusive Agency **               8,648           7,845            10
      Military                              1,626           2,244           -28
      UA Independent                           98             102            -4
      Other Distribution                      943           1,232           -23
         Total Life                        54,759          51,262             7

      HEALTH
      Direct Response                         911           1,155           -21
      American Income Agency                2,814           2,788             1
      LNL Exclusive Agency **              11,242          27,867           -60
      UA Independent                        6,834           8,836           -23
         Total Health                      21,801          40,646           -46

      Part D                                5,687            4,079          39

      TOTAL FIRST YEAR
      COLLECTED PREMIUM                   $82,247         $95,987           -14

 **   UA Branch Office premiums are now included in LNL Exclusive Agency


                                          10
TORCHMARK CORPORATION
                     CONSOLIDATED BALANCE SHEET (UNAUDITED)
                              (Amounts in thousands)


                                                                At March 31,
                                                         2009                  2008
Assets
Investments:
    Fixed maturities available for sale *               $7,336,347         $9,108,559
    Equity securities available for sale                    16,215             19,831
    Mortgage loans                                          16,894             18,277
    Real estate                                              2,392              7,297
    Policy loans                                           363,564            346,599
    Other long-term investments                             39,837             49,160
    Short-term investments                                 292,251             84,368
        Total investments                                8,067,500          9,634,091
Cash                                                        46,685              7,944
Accrued investment income                                  185,932            182,952
Other receivables                                          179,906             91,482
Deferred acquisition costs                               3,389,096          3,158,017
Value of insurance purchased                                53,936             59,858
Property and equipment                                      51,112             49,681
Goodwill                                                   423,519            423,519
Other assets                                               157,147            129,020
Separate account assets                                    690,917          1,235,785
        Total assets                                   $13,245,750        $14,972,349
Liabilities and Shareholders' Equity
Liabilities:
    Future policy benefits                              $8,627,715         $8,125,428
    Unearned and advance premium                            89,457             87,468
    Policy claims and other benefits payable               242,979            258,002
    Other policy liabilities                                89,692             90,236
    Deferred and accrued income taxes                      345,895            898,156
    Short-term debt                                        372,847            241,099
    Long-term debt                                         622,903            721,849
    Other liabilities                                      187,744            234,506
    Separate account liabilities                           690,917          1,235,785
          Total liabilities                             11,270,149         11,892,529
Shareholders' equity:
   Preferred stock                                               0                  0
   Common stock                                             85,875             94,875
   Additional paid-in-capital                              444,039            480,673
   Unrealized investment gains (losses), net of tax     -1,438,446           -289,800
   Retained earnings                                     2,993,652          3,108,298
   Treasury stock, at cost                                -109,519           -314,226
       Total shareholders' equity                        1,975,601          3,079,820
       Total liabilities and shareholders' equity      $13,245,750        $14,972,349
Diluted Basis:
    Shares outstanding                                     82,735               90,785
    Book value per common share                            $23.88               $33.92
    Book value per common share excluding FAS 115          $40.36               $36.88

* Amortized cost of fixed maturities                    $9,568,614         $9,548,760


                                                  11
TORCHMARK CORPORATION
                                           Invested Assets
                                            (Millions of $)
                                           March 31, 2009


Investment Portfolio at 3/31/09                          Amort.     % of
                                                          Cost      Total    Industry

      Fixed maturities                                    $9,569      93%       78%
      Equities                                                17       0%        3%
      Mortgage loans                                          17       0%       10%
      Investment real estate                                   2       0%        1%
      Policy loans                                           364       4%        4%
      Other long-term investments                             40       0%        3%
      Short-term investments                                 292       3%        1%

         Total                                           $10,300     100%


Fixed Maturities at 3/31/09                                          Net                 % of
   Summary                                                         Unreal.               Total
                                               Amort.    Market     Gain     Average    Amort.
                                                Cost     Value     (Loss)     Rating     Cost

      Investment Grade                          $8,303    $6,634   -$1,669      A-        87%
      Below Investment Grade                     1,266       702      -563     BB-        13%

         Total                                  $9,569    $7,336   -$2,232    BBB+


   By Type

      Corporates                                $7,439    $5,974   -$1,465    BBB+        78%
      Redeemable preferred stock:
         U.S.                                    1,363      768       -595    BBB         14%
         Foreign                                   114       55        -59    BBB          1%
      Municipals                                   261      228        -33     AA          3%
      Government-sponsored enterprises             182      181         -1    AAA          2%
      Government & Agencies                         24       24          0    AA+          0%
      Residential mortgage-backed securities        22       24          2    AAA          0%
      Commercial mortgage-backed securities         16       16          0    AAA          0%
      CDO's                                        109       32        -77    BB+          1%
      Other asset-backed securities                 39       35         -4     A-          0%

         Total                                  $9,569    $7,336   -$2,232    BBB+


                                                12
TORCHMARK CORPORATION
                                               Invested Assets
                                                (Millions of $)
                                               March 31, 2009


                                                                           Net                 % of
                                                                         Unreal.               Total
                                             Amort.           Market      Gain      Average   Amort.
By Sector                                     Cost            Value      (Loss)      Rating    Cost

   Financial - Life/Health/PC Insurance       $1,767          $1,112       -$655     BBB+       18%
   Financial - Bank                            1,597           1,031        -566      A-        17%
   Financial - Financial Guarantor               106              45         -61     BBB-        1%
   Financial - Mortgage Insurer                   75              32         -43      B          1%
   Financial - Insurance Brokers                  50              32         -18     BBB-        1%
   Financial - Other                             279             179        -100     BBB+        3%
   Utilities                                   1,200           1,108         -92     BBB+       13%
   Energy                                        833             714        -119     BBB+        9%
   Consumer, Non-cyclical                        641             585         -56     BBB         7%
   Consumer, Cyclical                            457             350        -107     BBB         5%
   Communications                                572             465        -107     BBB         6%
   Basic Materials                               552             441        -111     BBB         6%
   Transportation                                297             270         -27     BBB         3%
   Other Industrials                             530             468         -62     BBB         6%
   ABS - CDO                                     109              32         -77     BB+         1%
   MBS                                            38              40           2     AAA         0%
   Government                                    466             433         -33     AA+         5%

      Total                                   $9,569          $7,336     -$2,232     BBB+


By Sector by Rating: Amortized Cost           AAA              AA          A         BBB       BIG     Total

   Financial - Life/Health/PC Insurance                             $1     $515      $1,085     $166    $1,767
   Financial - Bank                                 55              87      831         404      219     1,596
   Financial - Financial Guarantor                                           22          15       69       106
   Financial - Mortgage Insurer                                                                   75        75
   Financial - Insurance Brokers                                                        50                  50
   Financial - Other                                             108          15       114        41       278
   Utilities                                                                 342       804        55     1,201
   Energy                                                           41       142       651                 834
   Consumer, Non-cyclical                                            5       239       287       109       640
   Consumer, Cyclical                                               40        82       196       139       457
   Communications                                                            128       305       139       572
   Basic Materials                                                           117       375        60       552
   Transportation                                                    3        39       245        11       298
   Other Industrials                                                         181       246       103       530
   ABS - CDO                                                                  30                  79       109
   MBS                                            38                                                        38
   Government                                    254             122           90                          466

      Total - $                                $347             $407      $2,773     $4,777   $1,265    $9,569

              - % of Total                       4%              4%         29%        50%      13%      100%


                                                         13
TORCHMARK CORPORATION
                              Invested Assets
                               (Millions of $)
                              March 31, 2009


Below Investment Grade Bonds by Sector                                Increase /
                                               3/31/09    12/31/08   (Decrease)

   Financial - Life/Health/PC Insurance           $166         $51         $115
   Financial - Bank                                219           9          210
   Financial - Financial Guarantor                  69           9           60
   Financial - Mortgage Insurer                     75          75            0
   Financial - Insurance Brokers                     0           0            0
   Financial - Other                                41          30           11
   Utilities                                        55          55            0
   Energy                                            0          11          -11
   Consumer, Non-cyclical                          109         109            0
   Consumer, Cyclical                              139         115           25
   Communications                                  139         147           -8
   Basic Materials                                  60          40           20
   Transportation                                   11          11            0
   Other Industrials                               103          51           52
   ABS - CDO                                        79           0           79
   MBS                                               0           0            0
   Government                                        0           0            0

      Total                                     $1,265       $712          $553


Fixed Maturity Acquisitions:
                                               1Q'09       1Q'08

   Amount                                         $230       $431
   Yield                                          7.7%       7.2%
   Ratings                                           A-         A-
   Average Life To:
      First Call                                   24.7       22.0
      Maturity                                     25.6       34.6


                                          14

Contenu connexe

Tendances

4Q06OpStats_FNAL_022307
4Q06OpStats_FNAL_0223074Q06OpStats_FNAL_022307
4Q06OpStats_FNAL_022307
finance49
 
danaher 08_2Q_Release
danaher 08_2Q_Releasedanaher 08_2Q_Release
danaher 08_2Q_Release
finance24
 
coventry health care annual reports 2006
coventry health care annual reports 2006coventry health care annual reports 2006
coventry health care annual reports 2006
finance27
 
energy east Q12007ER
energy east Q12007ERenergy east Q12007ER
energy east Q12007ER
finance40
 
morgan stanley Annual Reports 2001
morgan stanley  Annual Reports 2001 morgan stanley  Annual Reports 2001
morgan stanley Annual Reports 2001
finance2
 
dover 3Q06_Earnings
dover 3Q06_Earningsdover 3Q06_Earnings
dover 3Q06_Earnings
finance30
 
conoco phillips 2007Fourth Quarter
conoco phillips 2007Fourth Quarterconoco phillips 2007Fourth Quarter
conoco phillips 2007Fourth Quarter
finance1
 
credit swisse Annual Report Part 3 Financial report 1998 /
credit swisse Annual Report Part 3 Financial report 1998 /credit swisse Annual Report Part 3 Financial report 1998 /
credit swisse Annual Report Part 3 Financial report 1998 /
QuarterlyEarningsReports2
 
occidental petroleum Consolidated Statements of Operations
occidental petroleum Consolidated Statements of Operationsoccidental petroleum Consolidated Statements of Operations
occidental petroleum Consolidated Statements of Operations
finance13
 
yrc worldwide4Q07_Release
yrc worldwide4Q07_Releaseyrc worldwide4Q07_Release
yrc worldwide4Q07_Release
finance41
 
.credit-suisse Annual Report Part 3 Financial report 1999 / 2000 continued
.credit-suisse Annual Report Part 3 Financial report 1999 / 2000 continued.credit-suisse Annual Report Part 3 Financial report 1999 / 2000 continued
.credit-suisse Annual Report Part 3 Financial report 1999 / 2000 continued
QuarterlyEarningsReports2
 
tjx Annual Reports1997
tjx Annual Reports1997tjx Annual Reports1997
tjx Annual Reports1997
finance14
 

Tendances (15)

Harley Davidson Financials, HOG Factbook, 2010 HD, Sales Growth Motorcycle Sales
Harley Davidson Financials, HOG Factbook, 2010 HD, Sales Growth Motorcycle SalesHarley Davidson Financials, HOG Factbook, 2010 HD, Sales Growth Motorcycle Sales
Harley Davidson Financials, HOG Factbook, 2010 HD, Sales Growth Motorcycle Sales
 
Comair - Interim Report Dec 2009 Final
Comair - Interim Report Dec 2009 FinalComair - Interim Report Dec 2009 Final
Comair - Interim Report Dec 2009 Final
 
4Q06OpStats_FNAL_022307
4Q06OpStats_FNAL_0223074Q06OpStats_FNAL_022307
4Q06OpStats_FNAL_022307
 
danaher 08_2Q_Release
danaher 08_2Q_Releasedanaher 08_2Q_Release
danaher 08_2Q_Release
 
coventry health care annual reports 2006
coventry health care annual reports 2006coventry health care annual reports 2006
coventry health care annual reports 2006
 
energy east Q12007ER
energy east Q12007ERenergy east Q12007ER
energy east Q12007ER
 
morgan stanley Annual Reports 2001
morgan stanley  Annual Reports 2001 morgan stanley  Annual Reports 2001
morgan stanley Annual Reports 2001
 
dover 3Q06_Earnings
dover 3Q06_Earningsdover 3Q06_Earnings
dover 3Q06_Earnings
 
conoco phillips 2007Fourth Quarter
conoco phillips 2007Fourth Quarterconoco phillips 2007Fourth Quarter
conoco phillips 2007Fourth Quarter
 
credit swisse Annual Report Part 3 Financial report 1998 /
credit swisse Annual Report Part 3 Financial report 1998 /credit swisse Annual Report Part 3 Financial report 1998 /
credit swisse Annual Report Part 3 Financial report 1998 /
 
occidental petroleum Consolidated Statements of Operations
occidental petroleum Consolidated Statements of Operationsoccidental petroleum Consolidated Statements of Operations
occidental petroleum Consolidated Statements of Operations
 
yrc worldwide4Q07_Release
yrc worldwide4Q07_Releaseyrc worldwide4Q07_Release
yrc worldwide4Q07_Release
 
.credit-suisse Annual Report Part 3 Financial report 1999 / 2000 continued
.credit-suisse Annual Report Part 3 Financial report 1999 / 2000 continued.credit-suisse Annual Report Part 3 Financial report 1999 / 2000 continued
.credit-suisse Annual Report Part 3 Financial report 1999 / 2000 continued
 
tjx Annual Reports1997
tjx Annual Reports1997tjx Annual Reports1997
tjx Annual Reports1997
 
Supporting documents for financial report analysis
Supporting documents for financial report analysisSupporting documents for financial report analysis
Supporting documents for financial report analysis
 

En vedette (7)

FEG Interview updated 10 27 2014
FEG Interview updated 10 27 2014FEG Interview updated 10 27 2014
FEG Interview updated 10 27 2014
 
Q1 2009 Earning Report of Genuine Parts Company
Q1 2009 Earning Report of Genuine Parts CompanyQ1 2009 Earning Report of Genuine Parts Company
Q1 2009 Earning Report of Genuine Parts Company
 
One nation under debt
One nation under debtOne nation under debt
One nation under debt
 
Viaje cultural a Brihuega
Viaje cultural a BrihuegaViaje cultural a Brihuega
Viaje cultural a Brihuega
 
Q1 2009 Earning Report of Olympic Steel Inc.
Q1 2009 Earning Report of Olympic Steel Inc.Q1 2009 Earning Report of Olympic Steel Inc.
Q1 2009 Earning Report of Olympic Steel Inc.
 
Q1 2009 Earning Report of Savvis Inc.
Q1 2009 Earning Report of Savvis Inc.Q1 2009 Earning Report of Savvis Inc.
Q1 2009 Earning Report of Savvis Inc.
 
Q3 2009 Earning Report of Nike, Inc.
Q3 2009 Earning Report of Nike, Inc.Q3 2009 Earning Report of Nike, Inc.
Q3 2009 Earning Report of Nike, Inc.
 

Similaire à Q1 2009 Financial Report of Torchmark Corp.

alltel 4q05supplement
alltel  4q05supplementalltel  4q05supplement
alltel 4q05supplement
finance27
 
conoco phillips 2007Third Quarter
conoco phillips 2007Third Quarterconoco phillips 2007Third Quarter
conoco phillips 2007Third Quarter
finance1
 
alltel 1Q06_Supplement
alltel  1Q06_Supplementalltel  1Q06_Supplement
alltel 1Q06_Supplement
finance27
 
alltel 3Q06_InvestorSupplementa
alltel  3Q06_InvestorSupplementaalltel  3Q06_InvestorSupplementa
alltel 3Q06_InvestorSupplementa
finance27
 
Liberty%20Tax%20Finanial%20Statements%20-%20FY%202006
Liberty%20Tax%20Finanial%20Statements%20-%20FY%202006Liberty%20Tax%20Finanial%20Statements%20-%20FY%202006
Liberty%20Tax%20Finanial%20Statements%20-%20FY%202006
finance41
 
conoco phillips 2006Third Quarter
conoco phillips 2006Third Quarterconoco phillips 2006Third Quarter
conoco phillips 2006Third Quarter
finance1
 
conoco phillips 2006Fourth Quarter
conoco phillips 2006Fourth Quarterconoco phillips 2006Fourth Quarter
conoco phillips 2006Fourth Quarter
finance1
 
alltel 2Q06_Supplement
alltel  2Q06_Supplementalltel  2Q06_Supplement
alltel 2Q06_Supplement
finance27
 
alltel 2Q06_Supplement
alltel  2Q06_Supplementalltel  2Q06_Supplement
alltel 2Q06_Supplement
finance27
 
qwest communications 1231 06
qwest communications 1231 06qwest communications 1231 06
qwest communications 1231 06
finance19
 
energy east 2Q08_EAS_release
energy east 2Q08_EAS_releaseenergy east 2Q08_EAS_release
energy east 2Q08_EAS_release
finance40
 
Intl Financial Highlights
Intl Financial HighlightsIntl Financial Highlights
Intl Financial Highlights
earnirgsreports
 
danaher 04-4Q-REL
danaher 04-4Q-RELdanaher 04-4Q-REL
danaher 04-4Q-REL
finance24
 
Cteep presentation 3_q11
Cteep presentation 3_q11Cteep presentation 3_q11
Cteep presentation 3_q11
Cteep
 
energy east Q12007ER
energy east Q12007ERenergy east Q12007ER
energy east Q12007ER
finance40
 
whole food market fr08_is
whole food market  fr08_iswhole food market  fr08_is
whole food market fr08_is
finance44
 
coventry health care annual reports 2004
coventry health care annual reports 2004coventry health care annual reports 2004
coventry health care annual reports 2004
finance27
 

Similaire à Q1 2009 Financial Report of Torchmark Corp. (20)

alltel 4q05supplement
alltel  4q05supplementalltel  4q05supplement
alltel 4q05supplement
 
conoco phillips 2007Third Quarter
conoco phillips 2007Third Quarterconoco phillips 2007Third Quarter
conoco phillips 2007Third Quarter
 
alltel 1Q06_Supplement
alltel  1Q06_Supplementalltel  1Q06_Supplement
alltel 1Q06_Supplement
 
fr06_is
fr06_isfr06_is
fr06_is
 
alltel 3Q06_InvestorSupplementa
alltel  3Q06_InvestorSupplementaalltel  3Q06_InvestorSupplementa
alltel 3Q06_InvestorSupplementa
 
Liberty%20Tax%20Finanial%20Statements%20-%20FY%202006
Liberty%20Tax%20Finanial%20Statements%20-%20FY%202006Liberty%20Tax%20Finanial%20Statements%20-%20FY%202006
Liberty%20Tax%20Finanial%20Statements%20-%20FY%202006
 
conoco phillips 2006Third Quarter
conoco phillips 2006Third Quarterconoco phillips 2006Third Quarter
conoco phillips 2006Third Quarter
 
conoco phillips 2006Fourth Quarter
conoco phillips 2006Fourth Quarterconoco phillips 2006Fourth Quarter
conoco phillips 2006Fourth Quarter
 
alltel 2Q06_Supplement
alltel  2Q06_Supplementalltel  2Q06_Supplement
alltel 2Q06_Supplement
 
alltel 2Q06_Supplement
alltel  2Q06_Supplementalltel  2Q06_Supplement
alltel 2Q06_Supplement
 
EAS_Q108_ER
EAS_Q108_EREAS_Q108_ER
EAS_Q108_ER
 
qwest communications 1231 06
qwest communications 1231 06qwest communications 1231 06
qwest communications 1231 06
 
energy east 2Q08_EAS_release
energy east 2Q08_EAS_releaseenergy east 2Q08_EAS_release
energy east 2Q08_EAS_release
 
Intl Financial Highlights
Intl Financial HighlightsIntl Financial Highlights
Intl Financial Highlights
 
danaher 04-4Q-REL
danaher 04-4Q-RELdanaher 04-4Q-REL
danaher 04-4Q-REL
 
Cteep presentation 3_q11
Cteep presentation 3_q11Cteep presentation 3_q11
Cteep presentation 3_q11
 
energy east Q12007ER
energy east Q12007ERenergy east Q12007ER
energy east Q12007ER
 
whole food market fr08_is
whole food market  fr08_iswhole food market  fr08_is
whole food market fr08_is
 
fr08_is
fr08_isfr08_is
fr08_is
 
coventry health care annual reports 2004
coventry health care annual reports 2004coventry health care annual reports 2004
coventry health care annual reports 2004
 

Plus de earningreport earningreport

Q3 2009 Earning Report of Boston Scientific Corporation
Q3 2009 Earning Report of Boston Scientific CorporationQ3 2009 Earning Report of Boston Scientific Corporation
Q3 2009 Earning Report of Boston Scientific Corporation
earningreport earningreport
 
Q3 2009 Earning Report of Boston Scientific Corporation
Q3 2009 Earning Report of Boston Scientific CorporationQ3 2009 Earning Report of Boston Scientific Corporation
Q3 2009 Earning Report of Boston Scientific Corporation
earningreport earningreport
 
Q3 2009 Earning Report of Atheros Communications, Inc.
Q3 2009 Earning Report of Atheros Communications, Inc.Q3 2009 Earning Report of Atheros Communications, Inc.
Q3 2009 Earning Report of Atheros Communications, Inc.
earningreport earningreport
 
Q3 2009 Earning Report of Hancock Holding Company
Q3 2009 Earning Report of Hancock Holding CompanyQ3 2009 Earning Report of Hancock Holding Company
Q3 2009 Earning Report of Hancock Holding Company
earningreport earningreport
 
Q3 2009 Earning Report of Infosys Technologies Ltd.
Q3 2009 Earning Report of Infosys Technologies Ltd.Q3 2009 Earning Report of Infosys Technologies Ltd.
Q3 2009 Earning Report of Infosys Technologies Ltd.
earningreport earningreport
 
Q3 2009 Earning Report of Marriott International
Q3 2009 Earning Report of Marriott InternationalQ3 2009 Earning Report of Marriott International
Q3 2009 Earning Report of Marriott International
earningreport earningreport
 
Q3 2009 Earning Report of Worthington Industries, Inc.
Q3 2009 Earning Report of Worthington Industries, Inc.Q3 2009 Earning Report of Worthington Industries, Inc.
Q3 2009 Earning Report of Worthington Industries, Inc.
earningreport earningreport
 

Plus de earningreport earningreport (20)

Q3 2009 Earning Report of Banco Santander S.A.
Q3 2009 Earning Report of Banco Santander S.A.Q3 2009 Earning Report of Banco Santander S.A.
Q3 2009 Earning Report of Banco Santander S.A.
 
Q3 Earning report of Daimler AG
Q3 Earning report of Daimler AGQ3 Earning report of Daimler AG
Q3 Earning report of Daimler AG
 
Q3 Earning Report of BB&T Corporation
Q3 Earning Report of BB&T CorporationQ3 Earning Report of BB&T Corporation
Q3 Earning Report of BB&T Corporation
 
Q3 Earning Report of BB&T Corporation
Q3 Earning Report of BB&T CorporationQ3 Earning Report of BB&T Corporation
Q3 Earning Report of BB&T Corporation
 
Q3 2009 Earning Report of Brown & Brown
Q3 2009 Earning Report of Brown & BrownQ3 2009 Earning Report of Brown & Brown
Q3 2009 Earning Report of Brown & Brown
 
Q3 2009 Earning Report of Boston Scientific Corporation
Q3 2009 Earning Report of Boston Scientific CorporationQ3 2009 Earning Report of Boston Scientific Corporation
Q3 2009 Earning Report of Boston Scientific Corporation
 
Q3 2009 Earning Report of Boston Scientific Corporation
Q3 2009 Earning Report of Boston Scientific CorporationQ3 2009 Earning Report of Boston Scientific Corporation
Q3 2009 Earning Report of Boston Scientific Corporation
 
Q3 2009 Earning Report of Atheros Communications, Inc.
Q3 2009 Earning Report of Atheros Communications, Inc.Q3 2009 Earning Report of Atheros Communications, Inc.
Q3 2009 Earning Report of Atheros Communications, Inc.
 
Q3 2009 Earning Report of Apple Inc.
Q3 2009 Earning Report of Apple Inc.Q3 2009 Earning Report of Apple Inc.
Q3 2009 Earning Report of Apple Inc.
 
Q3 2009 Earning Report of Hancock Holding Company
Q3 2009 Earning Report of Hancock Holding CompanyQ3 2009 Earning Report of Hancock Holding Company
Q3 2009 Earning Report of Hancock Holding Company
 
Q3 2009 Earning Report of Walgreen Co.
Q3 2009 Earning Report of Walgreen Co.Q3 2009 Earning Report of Walgreen Co.
Q3 2009 Earning Report of Walgreen Co.
 
Q3 2009 Earning Report of Infosys Technologies Ltd.
Q3 2009 Earning Report of Infosys Technologies Ltd.Q3 2009 Earning Report of Infosys Technologies Ltd.
Q3 2009 Earning Report of Infosys Technologies Ltd.
 
Q3 2009 Earning Report of Marriott International
Q3 2009 Earning Report of Marriott InternationalQ3 2009 Earning Report of Marriott International
Q3 2009 Earning Report of Marriott International
 
Q3 2009 Earning Report of PepsiCo.
Q3 2009 Earning Report of PepsiCo.Q3 2009 Earning Report of PepsiCo.
Q3 2009 Earning Report of PepsiCo.
 
Q3 2009 Earning Report of Alcoa, Inc.
Q3 2009 Earning Report of Alcoa, Inc.Q3 2009 Earning Report of Alcoa, Inc.
Q3 2009 Earning Report of Alcoa, Inc.
 
Q3 2009 Earning Report of Pepsi Bottling Group
Q3 2009 Earning Report of Pepsi Bottling GroupQ3 2009 Earning Report of Pepsi Bottling Group
Q3 2009 Earning Report of Pepsi Bottling Group
 
Q3 2009 Earning Report of Jean Coutu Group
Q3 2009 Earning Report of Jean Coutu GroupQ3 2009 Earning Report of Jean Coutu Group
Q3 2009 Earning Report of Jean Coutu Group
 
Q3 2009 Earning Report of Minerva plc
Q3 2009 Earning Report of Minerva plcQ3 2009 Earning Report of Minerva plc
Q3 2009 Earning Report of Minerva plc
 
Q3 2009 Earning Report of Worthington Industries, Inc.
Q3 2009 Earning Report of Worthington Industries, Inc.Q3 2009 Earning Report of Worthington Industries, Inc.
Q3 2009 Earning Report of Worthington Industries, Inc.
 
Q3 2009 Earning Report of Walgreen
Q3 2009 Earning Report of WalgreenQ3 2009 Earning Report of Walgreen
Q3 2009 Earning Report of Walgreen
 

Dernier

Abortion pills in Saudi Arabia (+919707899604)cytotec pills in dammam
Abortion pills in Saudi Arabia (+919707899604)cytotec pills in dammamAbortion pills in Saudi Arabia (+919707899604)cytotec pills in dammam
Abortion pills in Saudi Arabia (+919707899604)cytotec pills in dammam
samsungultra782445
 

Dernier (20)

Famous Kala Jadu, Black magic expert in Faisalabad and Kala ilam specialist i...
Famous Kala Jadu, Black magic expert in Faisalabad and Kala ilam specialist i...Famous Kala Jadu, Black magic expert in Faisalabad and Kala ilam specialist i...
Famous Kala Jadu, Black magic expert in Faisalabad and Kala ilam specialist i...
 
Webinar on E-Invoicing for Fintech Belgium
Webinar on E-Invoicing for Fintech BelgiumWebinar on E-Invoicing for Fintech Belgium
Webinar on E-Invoicing for Fintech Belgium
 
Test bank for advanced assessment interpreting findings and formulating diffe...
Test bank for advanced assessment interpreting findings and formulating diffe...Test bank for advanced assessment interpreting findings and formulating diffe...
Test bank for advanced assessment interpreting findings and formulating diffe...
 
Collecting banker, Capacity of collecting Banker, conditions under section 13...
Collecting banker, Capacity of collecting Banker, conditions under section 13...Collecting banker, Capacity of collecting Banker, conditions under section 13...
Collecting banker, Capacity of collecting Banker, conditions under section 13...
 
logistics industry development power point ppt.pdf
logistics industry development power point ppt.pdflogistics industry development power point ppt.pdf
logistics industry development power point ppt.pdf
 
7 tips trading Deriv Accumulator Options
7 tips trading Deriv Accumulator Options7 tips trading Deriv Accumulator Options
7 tips trading Deriv Accumulator Options
 
Business Principles, Tools, and Techniques in Participating in Various Types...
Business Principles, Tools, and Techniques  in Participating in Various Types...Business Principles, Tools, and Techniques  in Participating in Various Types...
Business Principles, Tools, and Techniques in Participating in Various Types...
 
Certified Kala Jadu, Black magic specialist in Rawalpindi and Bangali Amil ba...
Certified Kala Jadu, Black magic specialist in Rawalpindi and Bangali Amil ba...Certified Kala Jadu, Black magic specialist in Rawalpindi and Bangali Amil ba...
Certified Kala Jadu, Black magic specialist in Rawalpindi and Bangali Amil ba...
 
Avoidable Errors in Payroll Compliance for Payroll Services Providers - Globu...
Avoidable Errors in Payroll Compliance for Payroll Services Providers - Globu...Avoidable Errors in Payroll Compliance for Payroll Services Providers - Globu...
Avoidable Errors in Payroll Compliance for Payroll Services Providers - Globu...
 
Stock Market Brief Deck (Under Pressure).pdf
Stock Market Brief Deck (Under Pressure).pdfStock Market Brief Deck (Under Pressure).pdf
Stock Market Brief Deck (Under Pressure).pdf
 
falcon-invoice-discounting-unlocking-prime-investment-opportunities
falcon-invoice-discounting-unlocking-prime-investment-opportunitiesfalcon-invoice-discounting-unlocking-prime-investment-opportunities
falcon-invoice-discounting-unlocking-prime-investment-opportunities
 
Responsible Finance Principles and Implication
Responsible Finance Principles and ImplicationResponsible Finance Principles and Implication
Responsible Finance Principles and Implication
 
Toronto dominion bank investor presentation.pdf
Toronto dominion bank investor presentation.pdfToronto dominion bank investor presentation.pdf
Toronto dominion bank investor presentation.pdf
 
In Sharjah ௵(+971)558539980 *_௵abortion pills now available.
In Sharjah ௵(+971)558539980 *_௵abortion pills now available.In Sharjah ௵(+971)558539980 *_௵abortion pills now available.
In Sharjah ௵(+971)558539980 *_௵abortion pills now available.
 
Seeman_Fiintouch_LLP_Newsletter_May-2024.pdf
Seeman_Fiintouch_LLP_Newsletter_May-2024.pdfSeeman_Fiintouch_LLP_Newsletter_May-2024.pdf
Seeman_Fiintouch_LLP_Newsletter_May-2024.pdf
 
Explore Dual Citizenship in Africa | Citizenship Benefits & Requirements
Explore Dual Citizenship in Africa | Citizenship Benefits & RequirementsExplore Dual Citizenship in Africa | Citizenship Benefits & Requirements
Explore Dual Citizenship in Africa | Citizenship Benefits & Requirements
 
Bhubaneswar🌹Ravi Tailkes ❤CALL GIRLS 9777949614 💟 CALL GIRLS IN bhubaneswar ...
Bhubaneswar🌹Ravi Tailkes  ❤CALL GIRLS 9777949614 💟 CALL GIRLS IN bhubaneswar ...Bhubaneswar🌹Ravi Tailkes  ❤CALL GIRLS 9777949614 💟 CALL GIRLS IN bhubaneswar ...
Bhubaneswar🌹Ravi Tailkes ❤CALL GIRLS 9777949614 💟 CALL GIRLS IN bhubaneswar ...
 
Pension dashboards forum 1 May 2024 (1).pdf
Pension dashboards forum 1 May 2024 (1).pdfPension dashboards forum 1 May 2024 (1).pdf
Pension dashboards forum 1 May 2024 (1).pdf
 
劳伦森大学毕业证
劳伦森大学毕业证劳伦森大学毕业证
劳伦森大学毕业证
 
Abortion pills in Saudi Arabia (+919707899604)cytotec pills in dammam
Abortion pills in Saudi Arabia (+919707899604)cytotec pills in dammamAbortion pills in Saudi Arabia (+919707899604)cytotec pills in dammam
Abortion pills in Saudi Arabia (+919707899604)cytotec pills in dammam
 

Q1 2009 Financial Report of Torchmark Corp.

  • 1. TORCHMARK CORPORATION Operating Summary (Unaudited) (In thousands, except per share amounts) 3 Months Ended 1Q 4Q 3Q 2Q 1Q 3/09 3/08 2009 2008 2008 2008 2008 UNDERWRITING INCOME Life: $412,748 $402,948 Premium $412,748 $401,250 $406,114 $406,492 $402,948 -164,478 -166,868 Net Policy Obligations -164,478 -158,453 -165,351 -172,032 -166,868 -137,800 -128,505 Commissions and Acquisition Expenses -137,800 -130,747 -132,753 -130,320 -128,505 110,470 107,575 Underwriting Margin 110,470 112,050 108,010 104,140 107,575 Health: 224,037 253,095 Premium 224,037 224,954 230,855 242,400 253,095 -132,755 -157,113 Net Policy Obligations -132,755 -138,058 -143,027 -151,000 -157,113 -50,517 -50,478 Commissions and Acquisition Expenses -50,517 -44,989 -45,966 -47,723 -50,478 40,765 45,504 Underwriting Margin 40,765 41,907 41,862 43,677 45,504 4,819 4,899 Health - Part D Underwriting Margin 4,819 4,978 6,446 5,438 4,899 -4,096 1,125 Annuity Underwriting Margin -4,096 -8,827 305 974 1,125 151,958 159,103 Total Underwriting Margin 151,958 150,108 156,623 154,229 159,103 666 847 Other Income 666 1,127 1,157 1,023 847 -39,417 -39,773 Admin. Expenses -39,417 -43,032 -38,289 -38,189 -39,773 113,207 120,177 Underwriting Income 113,207 108,203 119,491 117,063 120,177 EXCESS INVESTMENT INCOME 168,977 166,837 Net Investment Income 168,977 167,666 168,968 167,760 166,837 -73,218 -67,304 Required Interest on Net Policy Liabilities -73,218 -73,520 -70,354 -68,947 -67,304 -15,598 -16,106 Interest on Debt -15,598 -16,666 -15,441 -14,752 -16,106 80,161 83,427 Total Excess Investment Income 80,161 77,480 83,173 84,061 83,427 -1,932 -1,659 Parent Company Expenses -1,932 -4,477 -1,626 -2,693 -1,659 191,436 201,945 Pre-Tax Operating Income 191,436 181,206 201,038 198,431 201,945 -64,594 -68,488 Income Tax -64,594 -61,013 -66,973 -65,824 -68,488 $126,842 $133,457 Net Operating Income Before Stock Compensation Expense $126,842 $120,193 $134,065 $132,607 $133,457 -1,587 -1,622 Stock Compensation Expense, Net of Tax -1,587 -1,636 -1,771 -2,006 -1,622 $125,255 $131,835 Net Operating Income $125,255 $118,557 $132,294 $130,601 $131,835 $1.49 $1.43 Per Share $1.49 $1.40 $1.51 $1.44 $1.43 83,875 91,877 Average Diluted Shares Outstanding 83,875 84,987 87,811 90,698 91,877 Reconciling items, net of tax: $0 $12 Gain on Sale of Agency Buildings $0 $0 $35 $134 $12 -41,045 -4,526 Capital Gain (Loss) - Investments -41,045 11,046 -71,394 -5,004 -4,526 -10,663 -8,626 Part D Adjustment -10,663 7,572 3,172 -2,118 -8,626 3,159 0 Tax Settlements 3,159 116 601 10,106 0 0 862 Net Proceeds (Cost) from Legal Settlements 0 -82 -1,557 7 862 0 -1,384 Loss on Company Occupied Property 0 0 0 0 -1,384 $76,706 $118,173 Net Income $76,706 $137,209 $63,151 $133,726 $118,173 8
  • 2. TORCHMARK CORPORATION Insurance Operations (Unaudited) (In thousands) LIFE HEALTH HEALTH - PART D ANNUITY 1Q 2009 % 1Q 2008 % 1Q 2009 % 1Q 2008 % 1Q 2009 % 1Q 2008 % 1Q 2009 1Q 2008 LNL Exclusive Agency * Premium $74,921 $76,298 $106,211 $128,536 Net Policy Obligations 32,612 44 34,956 46 62,594 59 80,619 63 Comm. & Acq. Exp. 25,478 34 22,983 30 26,817 25 26,255 20 Underwriting Margin 16,831 22 18,359 24 16,800 16 21,662 17 UA Independent Premium 7,481 8,356 87,799 94,996 Net Policy Obligations 3,411 46 3,806 46 54,510 62 60,627 64 Comm. & Acq. Exp. 3,571 48 3,985 48 17,966 20 18,733 20 Underwriting Margin 499 7 565 7 15,323 17 15,636 16 Direct Response Premium 135,283 128,635 11,862 11,647 Net Policy Obligations 60,067 44 60,189 47 9,072 76 9,283 80 Comm. & Acq. Exp. 42,413 31 38,127 30 1,011 9 830 7 Underwriting Margin 32,803 24 30,319 24 1,779 15 1,534 13 American Income Agency Premium 122,993 115,483 18,165 17,916 Net Policy Obligations 38,752 32 37,341 32 6,579 36 6,584 37 Comm. & Acq. Exp. 43,669 36 40,699 35 4,723 26 4,660 26 Underwriting Margin 40,572 33 37,443 32 6,863 38 6,672 37 Military Premium 49,675 50,651 Net Policy Obligations 20,084 40 20,757 41 Comm. & Acq. Exp. 16,321 33 16,617 33 Underwriting Margin 13,270 27 13,277 26 Part D Premium $45,888 $46,621 Net Policy Obligations 37,766 82 37,432 80 Net Amortization of DAC 1,422 3 1,166 3 Fees to PBM 1,881 4 3,124 7 Underwriting Margin 4,819 11 4,899 11 Other Distribution Premium 22,395 23,525 $2,397 $3,981 Net Policy Obligations 9,552 43 9,819 42 239 -718 Comm. & Acq. Exp. 6,348 28 6,094 26 6,254 3,574 Underwriting Margin 6,495 29 7,612 32 -4,096 1,125 Totals: Premium $412,748 $402,948 $224,037 $253,095 $45,888 $46,621 $2,397 $3,981 Net Policy Obligations 164,478 40 166,868 41 132,755 59 157,113 62 37,766 82 37,432 80 239 -718 Comm. & Acq. Exp. 137,800 33 128,505 32 50,517 23 50,478 20 3,303 7 4,290 9 6,254 3,574 Underwriting Margin $110,470 27 $107,575 27 $40,765 18 $45,504 18 $4,819 11 $4,899 11 -$4,096 $1,125 TOTAL UNDERWRITING MARGINS, ALL LINES $151,958 $159,103 Other Income 666 847 Administrative & Other Expenses -39,417 -39,773 INSURANCE UNDERWRITING INCOME $113,207 $120,177 * Components of underwriting margin for UA Branch Office Agency are now included in LNL Exclusive Agency 9
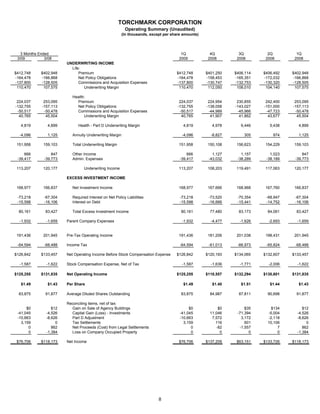
  • 3. TORCHMARK CORPORATION Net Sales and First Year Collected Premium (Unaudited) (In thousands) NET SALES * YTD YTD % Incr 3/09 3/08 (Decr) LIFE Direct Response $34,201 $30,556 12 American Income Agency 27,537 24,355 13 LNL Agency: LNL Exclusive Agency 12,787 10,050 27 UA Branch Office Agency 1,040 2,040 -49 Military 1,725 2,146 -20 UA Independent 140 164 -15 Other Distribution 1,027 1,183 -13 Total Life 78,457 70,494 11 HEALTH Direct Response 413 1,482 -72 American Income Agency 2,782 2,771 0 LNL Agency: LNL Exclusive Agency 3,525 2,299 53 UA Branch Office Agency 6,460 25,331 -74 UA Independent 7,349 9,903 -26 Total Health 20,529 41,786 -51 Part D 10,119 9,225 10 TOTAL NET SALES $109,105 $121,505 -10 * Net sales is defined as annualized premium issued, net of cancellations in the first 30 days after issue, except at Direct Response where net sales is annualized premium issued at the time the first full premium is paid after any introductory offer period has expired. FIRST YEAR COLLECTED PREMIUM YTD YTD % Incr 3/09 3/08 (Decr) LIFE Direct Response $21,550 $20,602 5 American Income Agency 21,894 19,237 14 LNL Exclusive Agency ** 8,648 7,845 10 Military 1,626 2,244 -28 UA Independent 98 102 -4 Other Distribution 943 1,232 -23 Total Life 54,759 51,262 7 HEALTH Direct Response 911 1,155 -21 American Income Agency 2,814 2,788 1 LNL Exclusive Agency ** 11,242 27,867 -60 UA Independent 6,834 8,836 -23 Total Health 21,801 40,646 -46 Part D 5,687 4,079 39 TOTAL FIRST YEAR COLLECTED PREMIUM $82,247 $95,987 -14 ** UA Branch Office premiums are now included in LNL Exclusive Agency 10
  • 4. TORCHMARK CORPORATION CONSOLIDATED BALANCE SHEET (UNAUDITED) (Amounts in thousands) At March 31, 2009 2008 Assets Investments: Fixed maturities available for sale * $7,336,347 $9,108,559 Equity securities available for sale 16,215 19,831 Mortgage loans 16,894 18,277 Real estate 2,392 7,297 Policy loans 363,564 346,599 Other long-term investments 39,837 49,160 Short-term investments 292,251 84,368 Total investments 8,067,500 9,634,091 Cash 46,685 7,944 Accrued investment income 185,932 182,952 Other receivables 179,906 91,482 Deferred acquisition costs 3,389,096 3,158,017 Value of insurance purchased 53,936 59,858 Property and equipment 51,112 49,681 Goodwill 423,519 423,519 Other assets 157,147 129,020 Separate account assets 690,917 1,235,785 Total assets $13,245,750 $14,972,349 Liabilities and Shareholders' Equity Liabilities: Future policy benefits $8,627,715 $8,125,428 Unearned and advance premium 89,457 87,468 Policy claims and other benefits payable 242,979 258,002 Other policy liabilities 89,692 90,236 Deferred and accrued income taxes 345,895 898,156 Short-term debt 372,847 241,099 Long-term debt 622,903 721,849 Other liabilities 187,744 234,506 Separate account liabilities 690,917 1,235,785 Total liabilities 11,270,149 11,892,529 Shareholders' equity: Preferred stock 0 0 Common stock 85,875 94,875 Additional paid-in-capital 444,039 480,673 Unrealized investment gains (losses), net of tax -1,438,446 -289,800 Retained earnings 2,993,652 3,108,298 Treasury stock, at cost -109,519 -314,226 Total shareholders' equity 1,975,601 3,079,820 Total liabilities and shareholders' equity $13,245,750 $14,972,349 Diluted Basis: Shares outstanding 82,735 90,785 Book value per common share $23.88 $33.92 Book value per common share excluding FAS 115 $40.36 $36.88 * Amortized cost of fixed maturities $9,568,614 $9,548,760 11
  • 5. TORCHMARK CORPORATION Invested Assets (Millions of $) March 31, 2009 Investment Portfolio at 3/31/09 Amort. % of Cost Total Industry Fixed maturities $9,569 93% 78% Equities 17 0% 3% Mortgage loans 17 0% 10% Investment real estate 2 0% 1% Policy loans 364 4% 4% Other long-term investments 40 0% 3% Short-term investments 292 3% 1% Total $10,300 100% Fixed Maturities at 3/31/09 Net % of Summary Unreal. Total Amort. Market Gain Average Amort. Cost Value (Loss) Rating Cost Investment Grade $8,303 $6,634 -$1,669 A- 87% Below Investment Grade 1,266 702 -563 BB- 13% Total $9,569 $7,336 -$2,232 BBB+ By Type Corporates $7,439 $5,974 -$1,465 BBB+ 78% Redeemable preferred stock: U.S. 1,363 768 -595 BBB 14% Foreign 114 55 -59 BBB 1% Municipals 261 228 -33 AA 3% Government-sponsored enterprises 182 181 -1 AAA 2% Government & Agencies 24 24 0 AA+ 0% Residential mortgage-backed securities 22 24 2 AAA 0% Commercial mortgage-backed securities 16 16 0 AAA 0% CDO's 109 32 -77 BB+ 1% Other asset-backed securities 39 35 -4 A- 0% Total $9,569 $7,336 -$2,232 BBB+ 12
  • 6. TORCHMARK CORPORATION Invested Assets (Millions of $) March 31, 2009 Net % of Unreal. Total Amort. Market Gain Average Amort. By Sector Cost Value (Loss) Rating Cost Financial - Life/Health/PC Insurance $1,767 $1,112 -$655 BBB+ 18% Financial - Bank 1,597 1,031 -566 A- 17% Financial - Financial Guarantor 106 45 -61 BBB- 1% Financial - Mortgage Insurer 75 32 -43 B 1% Financial - Insurance Brokers 50 32 -18 BBB- 1% Financial - Other 279 179 -100 BBB+ 3% Utilities 1,200 1,108 -92 BBB+ 13% Energy 833 714 -119 BBB+ 9% Consumer, Non-cyclical 641 585 -56 BBB 7% Consumer, Cyclical 457 350 -107 BBB 5% Communications 572 465 -107 BBB 6% Basic Materials 552 441 -111 BBB 6% Transportation 297 270 -27 BBB 3% Other Industrials 530 468 -62 BBB 6% ABS - CDO 109 32 -77 BB+ 1% MBS 38 40 2 AAA 0% Government 466 433 -33 AA+ 5% Total $9,569 $7,336 -$2,232 BBB+ By Sector by Rating: Amortized Cost AAA AA A BBB BIG Total Financial - Life/Health/PC Insurance $1 $515 $1,085 $166 $1,767 Financial - Bank 55 87 831 404 219 1,596 Financial - Financial Guarantor 22 15 69 106 Financial - Mortgage Insurer 75 75 Financial - Insurance Brokers 50 50 Financial - Other 108 15 114 41 278 Utilities 342 804 55 1,201 Energy 41 142 651 834 Consumer, Non-cyclical 5 239 287 109 640 Consumer, Cyclical 40 82 196 139 457 Communications 128 305 139 572 Basic Materials 117 375 60 552 Transportation 3 39 245 11 298 Other Industrials 181 246 103 530 ABS - CDO 30 79 109 MBS 38 38 Government 254 122 90 466 Total - $ $347 $407 $2,773 $4,777 $1,265 $9,569 - % of Total 4% 4% 29% 50% 13% 100% 13
  • 7. TORCHMARK CORPORATION Invested Assets (Millions of $) March 31, 2009 Below Investment Grade Bonds by Sector Increase / 3/31/09 12/31/08 (Decrease) Financial - Life/Health/PC Insurance $166 $51 $115 Financial - Bank 219 9 210 Financial - Financial Guarantor 69 9 60 Financial - Mortgage Insurer 75 75 0 Financial - Insurance Brokers 0 0 0 Financial - Other 41 30 11 Utilities 55 55 0 Energy 0 11 -11 Consumer, Non-cyclical 109 109 0 Consumer, Cyclical 139 115 25 Communications 139 147 -8 Basic Materials 60 40 20 Transportation 11 11 0 Other Industrials 103 51 52 ABS - CDO 79 0 79 MBS 0 0 0 Government 0 0 0 Total $1,265 $712 $553 Fixed Maturity Acquisitions: 1Q'09 1Q'08 Amount $230 $431 Yield 7.7% 7.2% Ratings A- A- Average Life To: First Call 24.7 22.0 Maturity 25.6 34.6 14