![Outline of talk ,[object Object],[object Object],[object Object],[object Object]](data:image/gif;base64,R0lGODlhAQABAIAAAAAAAP///yH5BAEAAAAALAAAAAABAAEAAAIBRAA7)
Recommandé
Recommandé
Contenu connexe
Tendances
Tendances (20)
En vedette
En vedette (20)
Similaire à Iab2008 goa0811120(1)
Similaire à Iab2008 goa0811120(1) (20)
Dernier
Dernier (20)
Iab2008 goa0811120(1)
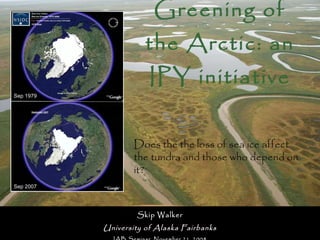
- 1. Greening of the Arctic: an IPY initiative Skip Walker University of Alaska Fairbanks IAB Seminar, November 21, 2008 Does the the loss of sea ice affect the tundra and those who depend on it? Sep 1979 Sep 2007
- 3. Trend in Arctic sea-ice Since 1980, perennial sea ice extent in the Arctic has declined at the rate of 10.1% per decade, and area trend is -11.4% decade. 2007 2007 minimum sea-ice extent, 4.5 million km 2 . NSIDC. Comiso et al. 2008, Geophysical Research Letters 35: L01703.
- 4. 2008 sea-ice 2008 was the second lowest minimum. The Arctic coasts of North America and Asia were simultaneously ice free for the first time on record. 2007! NSIDC: http://nsidc.org/data/virtual_globes/images/seaice_2008_climatology_lr.mov Sep 2007 Sep 2008
- 6. Normalized Difference Vegetation Index (NDVI): An index of greenness CAVM Team. 2003 In general, land cover with high reflectance in the NIR and low reflectance in the visible portion of the spectrum has dense green vegetation. Reflectance spectra of common ground-cover types Normalized Difference Vegetation Index NDVI = (NIR - VIS) / (NIR + VIS) NIR = spectral reflectance in the near-infrared band (0.7 - 1.1µm), where light scattering from the cell-structure of the leaves dominates. VIS = reflectance in the visible, chlorophyll-absorbing portion of the spectrum (0.4 to 0.7µm). Circumpolar patterns of NDVI
- 11. GOA studies are focused along two Arctic transects. CAVM Team. 2003 Transects in North America and Eurasia through all five bioclimate subzones as portrayed on the CAVM. Two Arctic Transects
- 20. Trend in patterned-ground along the Arctic bioclimate gradient Sub- zone: A B C D E Drawings modified from Chernov and Matveyeva 1997 Small non-sorted polygons Non-sorted circles Earth hummocks
- 22. In the Russian literature, subzone A is treated as an entirely separate bioclimate “Zone” -- the true “polar desert” of Gorodkov, Alexandrova and others. If the Tundra Zone is defined by its proximity to the Arctic Ocean, subzone A is defined by its proximity to perennial sea ice. Isachsen, Nunuvut, Canada Barren sea cliffs at Isachsen coast Special significance of the Subzone A site at Isachsen
- 24. Small differences in microclimate or moisture make a huge difference in vegetation production. A warming of only 2 ˚C will convert this to Subzone B climate with a potential doubling of the vascular-plant species that could colonize the area. Vegetation at base of snow bed, Isachsen Papaver polare on dry zonal sites Vegetation on warmer mesic site, Isachsen Subzone A: “the Poppy zone”
- 25. Lessons from 2007 minimum sea-ice event : Modeled predictions of sea-ice ages in Arctic Basin indicate that the oldest ice is in the vicinity of the western Canadian Archipelago and will be the last to melt in the Arctic. This is also the region of bioclimate subzone A. The terrestrial ecosystems in this region are dependent on the summer sea ice to maintain the cold temperatures. If summer arctic ice vanishes, so does Subzone A. Subzone A is a rare and endangered bioclimate subzone! Modified from Nghiem et al. 2008. Minimum Summer Sea Ice Extent Modeled Observed Isachsen Mould Bay
- 26. Legacy from the Biocomplexity Project Datasets from the NAAT provide an important baseline of information for future climate change studies across the complete Arctic climate gradient. Macroscale Mesoscale Microscale Climate Permafrost Geology/ Geomorph. Soils Microflora/ fauna Vegetation Microscale (plots) Mesoscale (Regional to toposequence) Macroscale (panArctic) Multi-scale Databases from the NAAT
- 28. Other publications Carbon is sequestered by patterned-ground formation processes deep in the active layer and permafrost, contributing to the high carbon stocks in Arctic soils.
- 29. Other publications from the Biocomplexity project and North American Arctic Transect Ninth International Permafrost Conference papers (6): Other journal publications (30 + 2 in prep): Data reports (9):
- 30. The Yamal Peninsula Transect: Cumulative effects of resource development, reindeer herding, and climate change on the Yamal Peninsula, Russia Funded by NASA Photo: Bryan and Cherry Alexander
- 33. Working with permafrost experts, sociologists, biologists, and soil scientists with long experience on the Yamal Peninsula Elina Karleja ärvi (Arctic Centre, graduate student, botanist), Nataliya Moskalenko (ECI, ecologist), Howie Epstein (U Va Co-PI, ecosystem ecologist), Marina Leibman (ECI, Permafrost, geomorphologist), Patrick Kuss (UAF, Post Doc, botanist), Anatoly Gubarkov (ECI, graduate student, permafrost, industrial impacts), Artem Khumotov (ECI, graduate student, GIS), George Mateyshak (MSU, Soil Scientist) Photo: D.A. Walker Earth Cryosphere Institute, Russian Academy of Science, Moscow organized the expeditions. Led by Marina Liebman and Nataliya Moskalenko.
- 37. Extensive nutrient-poor surface sands with lichens that are easily overgrazed by reindeer. Underlain by permafrost with massive pure ice. Extensive landslides are rapidly eroding the landscape. This exposes salt-rich and nutrient-rich clays. Complex vegetation succession process that results in willow-shrub tundra in the interior parts of the peninsula. Extraordinarily Sensitive Permafrost Landscapes Photos: D.A. Walker and M. Liebman (upper right)
- 38. Yamal: Center of future gas production in Russia Courtesy of A. Gubarkov
- 39. Courtesy of A. Gubarkov Large-scale development will occur once road, railroad and pipeline links to the south are built. Yamal Peninsula Yamal Peninsula
- 40. Relaxed Regulatory Environment Photos: D.A. Walker
- 42. Graphics: Florian Stammler: Yamal LCLUC Workshop, Moscow, 28-30 Jan 2008. Photos: D.A. Walker The Nentsy and their reindeer
- 43. Effects of reindeer herding Photos: Bruce Forbes . Overgrazing Trampling Grassification Wind erosion
- 44. The Nentsy use the entire Yamal Peninsula. Photos: D.A. Walker . Photos: D.A. Walker
- 45. Analysis of impacts of resource extraction to pasturelands Brigade migration corridors VIII and IV
- 49. Effects of climate change: Analysis of biomass and NDVI trends across the climate gradient Plant Cover NDVI & LAI Active layer Soils Field data collected: Plant Biomass Ground temperatures Data Report http://www.geobotany.uaf.edu/yamal/documents/yamal_2007_dr080211
- 54. “ What does NDVI really mean in tundra systems… particularly for reindeer and caribou?” Some areas with low NDVI have high forage quality for reindeer. Bright green areas may be dominated by species such as alder or dwarf-birch, which have abundant toxic secondary plant compounds that protect them from grazing. Shrub tundra at Laborovaya Lichen-woodland at Nadym Photos: D.A. Walker
- 55. AVHRR-Derived NDVI of the Yamal Peninsula Martha Raynolds: Yamal LCLUC meeting, Moscow 28-31 Jan 2008. landschaft elevation lithology veget-id lake area SWI Analysis of NDVI in relation to GIS databases
- 56. Summer warmth index (SWI) of Yamal Peninsula, based on AVHRR satellite-derived land-surface temperatures (mean of 1982-2003, Comiso). Vaskiny Dachi Laborovaya Belyy Ostrov Marre Sale Kharasavey Novii Port YAMAL Martha Raynolds: Yamal LCLUC meeting, Moscow 28-31 Jan 2008. Land-surface summer warmth on the Yamal
- 59. Areas with less NDVI than expected are brown, areas with more NDVI than expected are green. Comparison of actual NDVI and predicted NDVI based on SWI/NDVI relationship for entire Arctic 0 < - 0.3 > + 0.3 Martha Raynolds: Yamal LCLUC meeting, Moscow 28-31 Jan 2008. Most of the peninsula is greener than we expected.
- 60. Extensive willow shrublands due to landslide disturbances
- 65. Sea-ice and temperature trends in Beaufort Sea and Kara/Yamal region of Russia, 1982-2007 Beaufort Negative sea-ice trend (-29%) correlated with positive temperature trend (+16%) and very high inter-annual variability. Kara/Yamal Negative sea-ice trend (-25%) but nearly flat temperature trend (+4%). Bhatt et al.: NASA LCLUC Workshop, 2008. None of the trends are significant at p = 0.05 because of high interannual variability.
- 69. Seasonality trends NDVI Sea-ice concentration Jia et al. in press, JGR-Biogeosciences Bhatt et al. in prep., Earth Interactions
- 70. Controls on seasonality Biweekly sea-ice concentration in Arctic Alaska Seas Jun-Aug Wind patterns Bhatt et al. in prep., Atmospheric Research Beaufort East Chukchi East Bering Beaufort East Chukchi East Bering NARR long term climatological 10-m vector winds (1979-2000) averaged for June-August in m s- 1 . Data for image provided by the NOAA-ESRL Physical Sciences Division, Boulder Colorado from their Web site at http://www.cdc.noaa.gov . Weekly climatological sea ice based on the 1982-2007 period for the 50-km coastal ocean domain. Future analyses will examine the controls of sea-ice, winds, snow, atmospheric circulation and ocean circulation on seasonal patterns of NDVI. Proposed to NSF by Epstein, Bhatt, Walker, and Steele.
- 77. Yamal: Center of future gas production in Russia Courtesy of A. Gubarkov
- 78. Courtesy of A. Gubarkov
- 79. Relaxed Regulatory Environment Photos: D.A. Walker
- 81. Extensive nutrient-poor surface sands. Underlain by massive pure ice, Subject to erosion and landslides, That expose salt-rich and nutrient-rich clays, leading to Complex successional process that results in willow-shrub tundra in the interior parts of the peninsula. Extraordinarily Sensitive Permafrost Landscapes Photos: D.A. Walker and M. Liebman (upper right)
- 82. Graphics: Florian Stammler: Yamal LCLUC Workshop, Moscow, 28-30 Jan 2008. Photos: D.A. Walker The Nentsy and their reindeer
- 83. Effects of reindeer herding Photos: Bruce Forbes . Overgrazing Trampling Grassification Wind erosion
- 84. The Nentsy use the entire Yamal Peninsula. Photos: D.A. Walker . Photos: D.A. Walker
- 85. Analysis of impacts of resource extraction to pasturelands Brigade migration corridors VIII and IV
- 89. Analysis of biomass and NDVI trends across the climate gradient Plant Cover NDVI & LAI Active layer Soils Field data collected: Plant Biomass Ground temperatures Data Report http://www.geobotany.uaf.edu/yamal/documents/yamal_2007_dr080211
- 93. AVHRR-Derived NDVI of the Yamal Peninsula Martha Raynolds: Yamal LCLUC meeting, Moscow 28-31 Jan 2008. landschaft elevation lithology veget-id lake area SWI Analysis of remotely sensed data and regional data in GIS databases
- 94. Summer warmth index (SWI) of Yamal Peninsula, based on satellite-derived land-surface temperatures (mean of 1982-2003, Comiso). Vaskiny Dachi Laborovaya Belyy Ostrov Marre Sale Kharasavey Novii Port YAMAL Martha Raynolds: Yamal LCLUC meeting, Moscow 28-31 Jan 2008.
- 97. Areas with less NDVI than expected are brown, areas with more NDVI than expected are green. Comparison of actual NDVI and predicted NDVI based on SWI/NDVI relationship for entire Arctic 0 < - 0.3 > + 0.3 Martha Raynolds: Yamal LCLUC meeting, Moscow 28-31 Jan 2008.
- 98. Analysis of Circumpolar patterns of NDVI CAVM Team. 2003 Raynolds, M.K., D. A. Walker and H. A. Maier. 2006. NDVI patterns and phytomass distribution in the circumpolar Arctic. Remote Sensing of Environment 102:271-28 . Raynolds, M. K., J. C. Comiso, D. A. Walker, D. Verbyla. 2008. Relationship between satellite-derived land surface temperatures, arctic vegetation types, and NDVI. Remote Sensing of Environment 112:1884-1894. Raynolds, M. K. and Walker, D. A. 2008. Relationship of permafrost characteristics, NDVI, and arctic vegetation types. Proceedings of the Ninth International Conference on Permafrost: 1469-1474. Raynolds, M. K. and Walker, D. A. 2008 (submitted): The effects of deglaciation on circumpolar distribution of arctic vegetation. Canadian Journal of Remote Sensing. Martha Raynolds: Ph.D. Thesis
- 100. Summer land-surface temperature as shown by the summer warmth index(SWI) Summer Warm Index (SWI, ˚C mo) Area (km^2 x 100) Subzone E D C B A SWI derived from 20-yr mean AVHRR thermal data (Raynolds et al. 2008 Rem. Sens. Envir.)
- 101. Areas with less NDVI than expected are brown, areas with more NDVI than expected are green. Expected NDVI value as calculated by SWI regression equation
- 105. Sea-ice and temperature trends in Beaufort Sea and Kara/Yamal region of Russia, 1982-2007 Beaufort Negative sea-ice trend (-29%) correlated with positive temperature trend (+16%) and very high interannual variability. Kara/Yamal Negative sea-ice trend (-25%) but nearly flat temperature trend (+4%). Bhatt et al.: NASA LCLUC Workshop, 2008. None of the trends are significant at p = 0.05 because of high interannual variability.
- 109. Bhatt et al., in progress, 2008. NPI AO PDO NPI AO PDO NPI AO PDO NAO NAO NAO Climate index 0 0 0 .24 0 0 .10 0 0 .15 -.16 .14 .22 -.25 .10 .15 0 0 0 -.22 0 .25 -.26 0 .49 -.63 .45 .27 -.41 .41 .16 0 -.13 .40 -.29 .14 .23 .20 -.24 0 0 .26 -.17 .15 0 -.11 0 0 0 0 0 .16 -.27 0 0 .10 -.25 0 .14 -.24 -.11 .20 -.26 -.26 .49 -.56 -.17 .43 -.53 0 0 0 -.34 .48 -.57 -.20 -.3 .42 .19 -.10 .14 .16 -.15 0 .15 0 0 0 0 .13 .11 0 .40 .22 -.11 0 .13 -.26 0 .37 -.28 .12 .32 -.43 .33 .15 -.31 .19 -.2 -.14 -.40 .14 0 .12 .14 .3 0 Correlations with climate indices 50-km zones with climate indices during preceding winter (DJFM) Red values are positive correlations, blue are negative. Bold values are significant at 90% level or greater. .13 .43 -.1 Grnland Sea 0 0 0 Baffin Sea -.31 .18 -.2 Davis Straits 0 .14 .19 Canadian Arch -.12 0 .48 Beaufort 0 0 0 E. Bering 0 -.11 0 W. Bering -.17 .19 -.1 Chukchi 0.19 -.27 .14 E.Siberian 0.60 -.56 .33 Laptev 0 0 - .2 Kara-East 0 -.54 .27 Kara-Yamal .11 -0.2 .38 Barents Integrated NDVI Sea Ice SWI
- 111. Seasonality trends NDVI Sea-ice concentration Jia et al. in press, JGR-Biogeosciences Bhatt et al. in prep., Earth Interactions
- 112. Controls on seasonality Biweekly sea-ice concentration in Arctic Alaska Seas Jun-Aug Wind patterns Bhatt et al. in prep., Atmospheric Research Beaufort East Chukchi East Bering Beaufort East Chukchi East Bering NARR long term climatological 10-m vector winds (1979-2000) averaged for June-August in m s- 1 . Data for image provided by the NOAA-ESRL Physical Sciences Division, Boulder Colorado from their Web site at http://www.cdc.noaa.gov . Weekly climatological sea ice based on the 1982-2007 period for the 50-km coastal ocean domain. Future analyses will examine the controls of sea-ice, winds, snow, atmospheric circulation and ocean circulation on seasonal patterns of NDVI. Proposed to NSF by Epstein, Bhatt, Walker, and Steele.
- 114. “ What does NDVI really mean in tundra systems… particularly for reindeer and caribou?” Some areas with low NDVI have high forage quality for reindeer. Bright green areas may be dominated by species such as alder or dwarf-birch, which have abundant toxic secondary plant compounds that protect them from grazing. Shrub tundra at Laborovaya Lichen-woodland at Nadym Photos: D.A. Walker