Call Girls Ludhiana Just Call 98765-12871 Top Class Call Girl Service Available
Release Results 4Q12
1. 4th Quarter and Fiscal Year 2012
Results in IFRS
EMBRAER RELEASES 4TH QUARTER AND FISCAL YEAR 2012 RESULTS
HIGHLIGHTS
th
During the 4 quarter of 2012 (4Q12), Embraer delivered 23 commercial and 53 executive aircraft and
ended the year with total deliveries of 106 commercial and 99 executive aircraft (77 light jets and 22 large
jets);
As a consequence, 2012 Revenues totaled US$ 6,177.9 million, in line with the annual Revenue guidance
range of US$ 5.8 to US$ 6.2 billion;
1 2
4Q12 EBIT and EBITDA margins were strong and reached 12.0% and 16.4%, respectively. As a result,
2012 EBIT and EBITDA margins were 9.9% and 14.4%, respectively, surpassing the Company’s EBIT and
EBITDA margin guidance for the year of 9.0% to 9.5% and 12.5% to 13.5% respectively;
3
Positive operating cash generation of US$ 525 million in 4Q12 increased the Company’s net cash position
to US$ 312.9 million at the end of 2012;
Net income attributable to Embraer Shareholders was US$ 123.2 million in 4Q12 and totaled US$ 347.8
million for 2012. Earnings per ADS for 4Q12 and 2012 totaled US$ 0.6797 and US$ 1.9188, respectively.
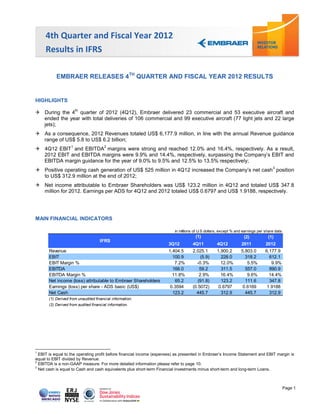
MAIN FINANCIAL INDICATORS
in millions of U.S dollars, except % and earnings per share data
(1) (2) (1)
IFRS
3Q12 4Q11 4Q12 2011 2012
Revenue 1,404.5 2,025.1 1,900.2 5,803.0 6,177.9
EBIT 100.9 (5.9) 228.0 318.2 612.1
EBIT Margin % 7.2% -0.3% 12.0% 5.5% 9.9%
EBITDA 166.0 59.2 311.5 557.0 890.9
EBITDA Margin % 11.8% 2.9% 16.4% 9.6% 14.4%
Net income (loss) attributable to Embraer Shareholders 65.2 (91.8) 123.2 111.6 347.8
Earnings (loss) per share - ADS basic (US$) 0.3594 (0.5072) 0.6797 0.6169 1.9188
Net Cash 123.2 445.7 312.9 445.7 312.9
(1) Derived from unaudited financial information.
(2) Derived from audited financial information.
1
EBIT is equal to the operating profit before financial income (expenses) as presented in Embraer’s Income Statement and EBIT margin is
equal to EBIT divided by Revenue.
2
EBITDA is a non-GAAP measure. For more detailed information please refer to page 10.
3
Net cash is equal to Cash and cash equivalents plus short-term Financial investments minus short-term and long-term Loans.
Page 1
2. 4th Quarter and Fiscal Year 2012
Results in IFRS
São José dos Campos, March 12, 2013 - (BM&FBOVESPA: EMBR3, NYSE: ERJ) The Company's operating
and financial information is presented, except where otherwise stated, on a consolidated basis in United States
dollars (US$) in accordance with IFRS. The financial data presented in this document as of and for the quarters
ended December 31, 2012 (4Q12), December 31, 2011 (4Q11) and September 30, 2012 (3Q12), are derived
from the unaudited financial statements.
NET SALES AND GROSS MARGIN
Embraer delivered 23 commercial and 53 executive aircraft in 4Q12, for an accumulated total of 106
commercial and 99 executive aircraft (77 light jets and 22 large jets) in 2012. As a result, 4Q12 and 2012
Revenues totaled US$ 1,900.2 and US$ 6,177.9 million, respectively, and therefore reached the upper end of
the US$ 5.8 - US$ 6.2 billion 2012 Revenue guidance range. The mix of products and revenues for the year,
the Company’s ongoing focus on its programs directed towards improving productivity and efficiency, the
appreciation of the US Dollar against the Real, as well as the stimulus packages implemented in Brazil, all
contributed towards a Gross Margin of 24.2% for 2012, compared to 22.5% in 2011.
EBIT
4Q12 EBIT and EBIT margin were US$ 228.0 million and 12.0%, respectively, for an accumulated EBIT of
US$ 612.1 million and EBIT margin of 9.9% in 2012, surpassing the Company’s guidance for the year of
US$ 520 to US$ 590 million and 9.0% to 9.5%, respectively. These results demonstrate the Company’s strong
operating leverage, which comes as a result of the high Revenue generation in the last quarter of the year,
allowing the Company to maximize the utilization of its installed capacity and dilute fixed costs in a more
efficient manner. Research expenses for 4Q12 totaled US$ 25.3 million, bringing total 2012 Research spending
to US$ 77.3 million, below the Company’s guidance of US$ 100 million. General and Administrative expenses
for 4Q12 totaled US$ 75.1 million, remaining stable when compared to the US$ 71.5 million spent in 4Q11.
Selling expenses of US$ 143.7 million in 4Q12 were higher than the US$ 113.9 million spent in 4Q11, primarily
as a result of the sales and product mix in the period. For 2012, SG&A and Research expenses totaled
US$ 839.8 million compared to US$ 767.1 million in 2011. Such increase comes primarily as a result of the
increase in Selling expenses, which grew by US$ 62.7 million, from US$ 419.3 million in 2011 to US$ 482
million in 2012, due mainly to the 6.5% growth in the Company’s 2012 Revenues compared to 2011.
NET INCOME
Net income attributable to Embraer Shareholders and Earnings per ADS for 4Q12 were US$ 123.2 million and
US$ 0.6797, respectively, bringing total 2012 Net income attributable to Embraer Shareholders and Earnings
per ADS to US$ 347.8 million and US$ 1.9188, respectively. 2012 Net margin reached 5.6%, and was
significantly higher when compared to the 2.1% achieved in 2011. The improvement in Net margin comes
mainly from the fact that the 2011 Net margin was negatively impacted by the provisions related to financial
guarantees in connection with the American Airlines Chapter 11 restructuring process.
Page 2
3. 4th Quarter and Fiscal Year 2012
Results in IFRS
MONETARY FINANCIAL POSITION ACCOUNTS AND OTHER MEASURES
Embraer had significant positive cash generation during 4Q12, and the Company’s Net cash position for the
period increased by US$ 189.7 million and reached US$ 312.9 million at the end of 2012.
in millions of U.S.dollars
(2) (1) (1)
Financial Position Data
4Q11 3Q12 4Q12
Cash and cash equivalents 1,350.2 1,573.0 1,801.2
Financial investments 753.6 635.4 578.2
Total cash position 2,103.8 2,208.4 2,379.4
Loans short-term 251.8 364.0 336.3
Loans long-term 1,406.3 1,721.2 1,730.2
Total loans position 1,658.1 2,085.2 2,066.5
Net cash* 445.7 123.2 312.9
* Net cash = Cash and cash equivalents + short-term Financial investments - short-
term and long-term Loans
(1) Derived from unaudited financial information.
(2) Derived from audited financial information.
This cash generation comes mainly as a consequence of strong financial results from operations, coupled with
a reduction in Inventories. Furthermore, the cash generated by operating activities helped offset the 4Q12 cash
requirements related to PP&E and Intangibles.
in millions of U.S.dollars
IFRS 4Q11 2011 1Q12 2Q12 3Q12 4Q12 2012
Net cash generated (used) by operating activities 178.8 480.2 (128.9) 189.1 109.7 524.9 694.8
Financial investments adjustment (1) 234.8 72.8 59.2 (34.3) (139.8) (81.1) (195.9)
Additions to property, plant and equipment (76.8) (334.3) (39.6) (75.5) (50.2) (162.7) (328.0)
Additions to intangible assets (60.1) (217.4) (64.6) (54.6) (57.5) (75.7) (252.4)
Free cash flow 276.7 1.3 (173.9) 24.7 (137.8) 205.4 (81.5)
(1) Financial investments and unrealized gain (losses)
Additions to PP&E totaled US$ 162.7 million in 4Q12 and accumulated 2012 additions to PP&E totaled
US$ 328 million. Total PP&E includes values related to Pool programs spare parts, aircraft under lease or
available for lease and CAPEX. CAPEX investments for 2012 totaled US$ 207.9 million, in line with Company
guidance of US$ 200 million. As the Company continued to build up its inventory of spare parts through 2012 to
adjust for the growing demand of its spare parts Pool programs from its customer base, total investments in
Pool program spare parts totaled US$ 63.9 million for 2012, below the US$ 105.4 million invested in 2011 and
consistent with the Company’s strategy. The Company also added a total of US$ 252.4 million to Intangible
assets, related to all investments made for product development throughout 2012. Furthermore, 2012
investments in Development (net of contributions from suppliers) totaled US$ 251.4 million, below Company’s
guidance of US$ 350 million. It is important to note that such reduction does not affect the development
schedule of the respective programs, particularly the Legacy 450 & 500 aircraft. The following tables outline the
investments in PP&E and R&D for 2012.
Page 3
4. 4th Quarter and Fiscal Year 2012
Results in IFRS
in millions of U.S.dollars
4Q11 2011 1Q12 2Q12 3Q12 4Q12 2012
Additions 60.1 217.4 64.6 54.6 57.5 75.7 252.4
Contributions from suppliers (0.3) (85.8) (0.2) (0.4) (0.2) (0.2) (1.0)
Development (Net of contributions from suppliers) 59.8 131.6 64.4 54.2 57.3 75.5 251.4
Research 26.0 85.3 16.0 14.5 21.5 25.3 77.3
R&D 85.8 216.9 80.4 68.7 78.8 100.8 328.7
4Q11 2011 1Q12 2Q12 3Q12 4Q12 2012
CAPEX 53.2 162.2 31.6 52.0 48.6 75.7 207.9
Additions of aircraft available for or under lease 7.6 66.7 - 2.3 0.5 (30.8) 56.2
Additions of Pool programs spare parts 16.0 105.4 8.0 21.2 1.1 33.6 63.9
PP&E 76.8 334.3 39.6 75.5 50.2 78.5 328.0
Indebtedness Maturity
During 4Q12, the Company’s total debt decreased to
15% 22% 17% 16% US$ 2,066.5 million, compared to US$ 2,085.2 million
26%
in 3Q12. This decrease in the Company’s total debt
4.8 6.1 6.0 5.8
4.2
comes as a result of the debt maturity schedule. In
4Q12 Short-term loans accounted for 16.3% of total
85% 78% 83% 84% loans, compared to 17.5% in 3Q12. Considering the
74%
Company’s current debt profile, the average loan
maturity decreased from 6 years in 3Q12 to 5.8 years
in 4Q12.
4Q11 1Q12 2Q12 3Q12 4Q12
Long-term Short-term Loans Average Maturity (Years)
Furthermore, from 3Q12 to 4Q12, the cost of Dollar
denominated loans increased from 5.7% to 6.1% p.a.
and the cost of Real denominated loans decreased from 4.9% to 4.7% p.a. The Adjusted EBITDA to financial
expense (gross) ratio (for more detailed information please refer to page 10) increased in 4Q12 compared to
3Q12, going from 5.49 to 7.51. As of 4Q12, 24.5% of total debt was denominated in Reals.
Total Cash - Currency Ratio Embraer’s cash allocation management strategy
continues to be one of its most important tools to
mitigate exchange rate risks. By balancing cash
57% 50%
60%
allocation in Real and Dollar denominated assets,
61% 62%
the Company attempts to neutralize its balance
sheet exchange rate exposure. Of total cash at the
end of 4Q12, 40% was denominated in Real.
43% 50%
39% 38% 40%
4Q11 1Q12 2Q12 3Q12 4Q12
Brazilian Currency Other Currencies (primarily US Dollars)
Page 4
5. 4th Quarter and Fiscal Year 2012
Results in IFRS
OPERATIONAL BALANCE SHEET ACCOUNTS
As a result of the large number of aircraft delivered during 4Q12, Inventories decreased by US$ 429.4 million,
compared to 3Q12, and totaled US$ 2,155.3, bringing 4Q12 Inventories to a level US$ 132.3 million below
4Q11. Trade accounts payable decreased to US$ 758.9 million in 4Q12, as a consequence of adjustments in
procurement activity, in line with a lower number of aircraft expected to be delivered during the first quarter of
2013, compared to 4Q12. Trade accounts receivable remained stable in 4Q12 and totaled US$ 539.1 million.
in millions of U.S.dollars
(2) (1) (1)
Financial Position Data
4Q11 3Q12 4Q12
4
Trade accounts receivable 506.0 558.6 539.1
Customer and commercial financing 102.2 116.3 109.6
Inventories 2,287.6 2,584.7 2,155.3
Property, plant and equipment 1,450.4 1,491.5 1,738.5
Intangible 808.3 909.3 958.9
Trade accounts payable 829.9 787.7 758.9
Advances from customers 1,070.1 1,045.2 1,002.4
Total shareholders' equity 3,117.8 3,286.3 3,350.3
(1) Derived from unaudited financial information.
(2) Derived from audited financial information.
Property, plant and equipment (PP&E) increased by US$ 247 million, compared to 3Q12, mainly driven by used
aircraft received in trade-in, spare parts pool and investments made in the construction of the Company’s
facilities located in Evora, Portugal. Customer and commercial financing decreased by US$ 6.7 million,
compared to 3Q12, mainly driven by the reduction of temporary financing structures related to aircraft deliveries.
Advances from customers decreased to US$ 1,002.4 million, primarily as a result of the evolution of the number
of deliveries and new orders in 4Q12. Intangible assets totaled US$ 958.9 million in 4Q12, increasing US$ 49.6
million compared to 3Q12 as a result of investments made in aircraft program development, mainly the Legacy
450 & 500.
SEGMENT RESULTS
4Q12 Revenues mix by segment varied when compared to 4Q11, as a result of a higher participation from the
Executive aviation and Defense & Security segments, which represented 37.5% and 15.8% of total Company
Revenues, respectively. This increase was offset by the lower participation from the Commercial Aviation and
Others segments, which reached 45.4% and 1.3% of Revenues, respectively. Consistent with the Company’s
strategy, the Defense & Security and Executive aviation segments continued to present strong growth and 2012
Net revenues for these segments grew by 24% and 15.5%, respectively, when compared to 2011.
in millions of U.S.dollars
Net revenue (1) (1) (1) (2) (1)
by segment 3Q12 % 4Q11 % 4Q12 % 2011 % 2012 %
Commercial Aviation 956.3 68.1 1,096.5 54.1 863.5 45.4 3,751.2 64.6 3,755.4 60.8
- Commercial Aviation services 101.2 7.2 108.6 5.4 113.2 409.4 423.9 22.3
Defense and Security 258.8 18.4 293.0 14.5 299.5 15.8 852.0 14.7 1,056.2 17.1
- Defense and Security services 46.7 3.3 54.8 2.7 50.2 2.6 188.5 3.2 198.2 10.4
Executive Aviation 167.4 11.9 604.1 29.8 712.0 37.5 1,118.8 19.4 1,292.0 20.9
- Executive Aviation services 31.0 2.2 26.4 1.3 31.5 1.7 101.1 1.7 118.8 6.3
Others 22.0 1.6 31.6 1.6 25.2 1.3 81.0 1.3 74.3 1.2
Total 1,404.5 100.0 2,025.1 100.0 1,900.2 100.0 5,803.0 100.0 6,177.9 100.0
(1) Derived from unaudited financial information.
(2) Derived from audited financial information.
Page 5
6. 4th Quarter and Fiscal Year 2012
Results in IFRS
COMMERCIAL AVIATION
As per IATA (International Air Transport Association), global air transport demand increased 5.3% in 2012,
above the historical average of 5.0%. The international traffic growth was 6.0%, mainly due to emerging
countries, Europe despite the Euro Zone crisis, increased 5.3% and North America only 1.3%. Domestic
demand grew 4.0%, higher growth was experienced in China with 9.5% and Brazil with 8.6%, while United
States air transport demand grew only 0.8% and India decreased 2.1%. IATA projects an air transport industry
net profit of US$ 6.7bn in 2012 and US$ 8.4bn in 2013, supported by emerging country economies and better
capacity management from airlines, especially in the United States.
Embraer delivered 23 jets in the 4Q2012 and 106 in 2012 for commercial aviation. 56 new E-Jets were sold in
2012 to companies that are expanding their E-Jets fleet, such as the leasing company Aldus Aviation from
Ireland (five E175 and 15 E190), Azul from Brazil with 10 E195 (total of 62 aircraft contracted, 57 E195 and 5
E190), Hebei from China (five E190), BA Cityflyer from England (one E190), Fuji Dream (two E175) and JAL
(one E170) from Japan and for new customers Conviasa from Venezuela (six E190) and Azerbaijan Airlines
from Azerbaijan (four E190).
th
Embraer achieved an important milestone last October 2012 with the 900 delivery of E-Jets, an E190 to Kenya
Airways. In addition, the E-Jets family continued to grow with new operators Bulgaria Air, Estonian, Belavia,
th
Conviasa (11 E-Jets customer in Latin America), Myanma Airways, TUI Travel – Jetairfly and FLYNONSTOP.
Deliveries 3Q12 4Q11 4Q12 2011 2012
Commercial Aviation 27 32 23 105 106
ERJ 145 - - - 2 -
EMBRAER 170 - - 1 1 1
EMBRAER 175 7 7 3 10 20
EMBRAER 190 17 18 10 68 62
EMBRAER 195 3 7 9 24 23
In 2012, Embraer continued the development of E-Jets improvements to be implemented until 2014 and the
second generation E-Jets analysis with a potential entry into service scheduled for 2018.
The E-Jets order book registered 1,093 firm orders as of December 31, 2012.
Commercial Aviation
Firm Orders Options Total Deliveries Firm Backlog
Backlog
EMBRAER 170 193 29 222 183 10
EMBRAER 175 198 266 464 163 35
EMBRAER 190 560 265 825 451 109
EMBRAER 195 142 20 162 111 31
TOTAL E-JETS 1,093 580 1,673 908 185
EXECUTIVE AVIATION
The Executive Aviation segment delivered 37 light jets and 16 large jets, totaling 53 aircraft, in the 4Q12. In
2012, the Executive Aviation segment delivered 77 light jets and 22 large jets, totaling 99 aircraft.
Deliveries 3Q12 4Q11 4Q12 2011 2012
Executive Aviation 13 50 53 99 99
Light Jets 11 40 37 83 77
Large Jets 2 10 16 16 22
Page 6
7. 4th Quarter and Fiscal Year 2012
Results in IFRS
The year of 2012 was marked by both positive and negative signs of market recovery. On one hand, not only
the American corporate profits but also the number of millionaires in the world has surpassed their respective
record levels. On the other hand, the slow growth of the economies around the world, the uncertainties
regarding the future of the European economies, the stagnation of the pre-owned aircraft market and the
reduction of the utilization of business jets are still factors that jeopardize a full recovery of the demand for
business jets.
In October 2012, for the first time Embraer Executive Jets displayed a complete mockup of the interior of the
Legacy 450 jet at the National Business Aviation Association Convention in Orlando, FL. In the same event,
Embraer Executive Jets signed an Authorized Service Center agreement with ExecuJet Haite Aviation Services
China Co., Ltd. (ExecuJet Haite), from China, to supply a complete maintenance service for the Legacy 600/650
jet family and for the Lineage 1000 jet. With this agreement, ExecuJet Haite became the first Authorized Service
Center in Mainland, China.
In November 2012, a new generation of business jets reached an important milestone when Embraer’s midsize
jet Legacy 500 made a successful first flight, marking the beginning of the flight test program for this aircraft, the
entrance into service of which is expected for the first semester of 2014.
In the same month, Embraer delivered the 200th Legacy 600/650 jet, a remarkable milestone for this jet family.
The aircraft was delivered to Minsheng Financial Leasing Co. (MSFL), from China, in a ceremony held at
Embraer headquarter at Sao Jose dos Campos, Brazil.
Finally, in December 2012, Embraer Executive Jets’ first made-in-the-USA Phenom 300 was rolled out and
made its first flight.
DEFENSE AND SECURITY BUSINESS
Embraer Defense and Security presented a solid growth in 2012, with net revenues of US$ 1.056 million, or
24% above the previous year. The Defense and Security market presents a favorable perspective for growth,
with sales campaigns underway for various applications including intelligence, surveillance and reconnaissance
systems; aircraft modernization; transportation of officials and authorities; training and light attack; command
and control systems and services. Embraer has also positioned itself to play a major role in projects focused on
border surveillance as well as security for upcoming major sporting events.
Regarding the projects for border security, the Tepro Consortium – constituted by Savis Tecnologia e Sistemas
S/A and OrbiSat Indústria e Aerolevantamento S.A., companies controlled by Embraer, signed the contract for
the implementation of the 1st phase of the Integrated System for Border Monitoring (SISFRON). This 1st phase
will provide border security for 650km of border between Brazil, Paraguay and Bolivia.
In the area of unmanned aircrafts, Harpia Sistemas S.A. was strengthened by the entry of Avibras Divisão
Aérea e Naval S.A. into its capital. In addition to acquiring 9% of Harpia’s capital, Avibras also added the aircraft
Falcão to Harpia line of products. Falcão is being developed for use by the Brazilian Armed Forces and will be
able to conduct reconnaissance, target acquisition, fire control support, damage assessment, land and maritime
surveillance missions.
The development of the military transport and refueling aircraft, the KC-390, is progressing on schedule. In
2012 the Preliminary Design Review (PDR) phase of the KC-390 was successfully completed. The event was
an important milestone in the program, with the participation of Embraer and the Brazilian Air Force (FAB). In
this opportunity it was demonstrated the technical aspects and the design solutions adopted for the structure
and for several systems of the aircraft, including the main components and their interfaces, demonstrating that
the project has reached the expected maturity for the phase.
Page 7
8. 4th Quarter and Fiscal Year 2012
Results in IFRS
In 2012 a cooperation agreement was signed between Embraer and Boeing Defense and Security for the KC-
390 program. The agreement provides for the sharing of expertise and joint evaluation of specific markets
where sales strategies can be established for medium-sized military transport aircraft. This agreement allows
the KC-390 to have penetration in markets not previously considered in the original business plan of the aircraft.
Regarding the modernization programs, by the end of 2012, 16 AMX (A-1) aircraft had been received by
Embraer for the modernization effort. In June Embraer flew the first prototype of the A-1M, the modernized
version, for the first time, starting the flight test campaign. The first deliveries will happen in 2013.
The Brazilian Navy´s AF-1 (A-4 Skyhawk) modernization program of 12 aircraft continues on track, with 2
aircraft already at Embraer’s facilities.
In 2012, two of the first three EMB 145 AEW&C (Airborne Early Warning and Control) were delivered to the
Indian Government. The last delivery is scheduled for late 2013.
Regarding the light attack aircraft, Embraer delivered the first four A-29 aircraft to the Indonesian Air Force, of
the first batch of 8 aircraft contracted in 2010. Indonesia becomes the first Super Tucano operator in Asia. In
addition, the Indonesian Air Force also signed a contract for a second batch of eight aircraft, including a flight
simulator that will be used for instruction and training of Indonesian pilots. The deliveries of the second batch
are expected for 2014.
In 2012, Embraer has exhibited the A-29 aircraft for the first time at the AirVenture Convention, a traditional
convention that takes place in Oshkosh (USA). Another participation, this time at the Air Force Association
Convention in Washington, allowed Embraer to show the qualities and advantages of the A-29 Super Tucano, a
low-cost, combat-proven aircraft. These opportunities brought visibility to the A-29 in the moment that the US
Air Force was evaluating it as a contender for the Light Air Support (LAS) program.
Also in relation to the LAS, Embraer and Boeing signed an agreement that will add new capabilities to the A-29
Super Tucano by the integration of weapons that meet the future demands of its customers. This integration
enhanced the content of the proposal submitted to the USAF, offering features that not only meet the
requirements of the LAS program, but also outperform them significantly.
Regarding the Services and Logistic Support area, in 2012 Embraer and FAB signed a contract for logistic
support for the fleet of 24 ERJ-145 family aircrafts operated by FAB. The contract, that can reach US$ 130
million – including US$ 32 million of additional services, covers a wide range of services, aimed at increasing
availability of aircrafts.
Embraer has hosted, together with OGMA, the Embraer Defense Operators’ Meeting 2012, in Lisbon, Portugal.
The event gathered military clients and governments that operate the fleet of ERJ 145 and Legacy, from
Embraer, and owners of other military aircrafts supported by OGMA.
In 2012 Visiona Tecnologia Espacial S.A., a company with the initial objective of delivering the first Brazilian
Geostationary Satellite was established, as a joint venture between Embraer (51%) and Telebras (49%). This is
a key step for Embraer to enter into the space segment. Throughout 2012, Visiona has discussed the
requirements of the satellite, identified the suppliers, and initiated the contract negotiations with the client, with
contract signature expected for 2013.
Page 8
9. 4th Quarter and Fiscal Year 2012
Results in IFRS
TOTAL BACKLOG
Embraer’s firm order backlog at the end of 4Q12 totaled US$ 12.5 billion. The following chart presents the
Company’s backlog evolution through 2012.
15.4 14.7
12.9 12.4 12.5
4Q11 1Q12 2Q12 3Q12 4Q12
SEC/DOJ INVESTIGATIONS UPDATE
We received a subpoena from the SEC in September, 2010, which inquired about certain operations concerning
sales of aircraft abroad. In response to this SEC-issued subpoena and associated inquiries into the possibility of
non-compliance with the U.S. Foreign Corrupt Practices Act, or FCPA, we retained outside counsel to conduct
an internal investigation on transactions carried out in three specific countries.
Further, the Company has voluntarily expanded the scope of the internal investigation to include two additional
countries and has reported on those matters. The investigation remains ongoing and we, through our outside
counsel, continue to cooperate fully with the SEC and U.S. Department of Justice, which are the authorities
responsible for reviewing the matter. The Company, with the support of our outside counsel, has concluded that
it is still not possible to estimate the duration, scope or results of the internal investigation or government's
review. In the event that the authorities take action against us or the parties enter into an agreement to settle
the matter, we may be required to pay substantial fines and/or to incur other sanctions. The Company, based
upon the opinion of our outside counsel, believes that, there is no basis for estimating reserves or quantifying
any possible contingency.
RECONCILIATION OF IFRS AND “NON GAAP” INFORMATION
We define Free cash flow as operating cash flow less Additions to property, plant and equipment, Additions to
intangible assets, Financial investments and Other assets. Free cash flow is not an accounting measure under
IFRS. Free cash flow is presented because it is used internally as a measure for evaluating certain aspects of
our business. The Company also believes that some investors find it to be a useful tool for measuring
Embraer's cash position. Free cash flow should not be considered as a measure of the Company's liquidity or
as a measure of its cash flows as reported under IFRS. In addition, free cash flow should not be interpreted as
a measure of residual cash flow available to the Company for discretionary expenditures, since the Company
may have mandatory debt service requirements or other nondiscretionary expenditures that are not deducted
from this measure. Other companies in the industry may calculate free cash flow differently from Embraer for
Page 9
10. 4th Quarter and Fiscal Year 2012
Results in IFRS
in millions of U.S.dollars
purposes of their earnings release, thus Adjusted EBITDA Reconciliation (1) (2) (1)
limiting the usefulness of this measure LTM* (IFRS) 3Q12 2011 2012
as a tool for comparing Embraer to other Net Income Attributable to Embraer 132.8 111.6 347.8
companies in the industry. Noncontrolling interest 4.4 8.8 0.8
Income tax (expense) income 124.7 127.1 265.5
Adjusted EBITDA represents earnings
Financial income (expense), net 123.8 90.7 6.8
before interest, taxation, depreciation Foreign exchange gain (loss), net (7.6) (20.0) (8.8)
and amortization accumulated over a Depreciation and amortization 260.5 238.8 278.8
period of the last 12 months. It is not a Adjusted EBITDA 638.6 557.0 890.9
financial measurement of the (1) Derived from unaudited financial information.
Company’s financial performance under (2) Derived from audited financial information.
IFRS. Adjusted EBITDA is presented * Last Twelve Months
because it is used internally as a
measure to evaluate certain aspects of the business. The Company also believes that some investors find it to
be a useful tool for measuring a Company’s financial performance. Adjusted EBITDA should not be considered
as an alternative to, in isolation from, or a substitution for, analysis of the Company’s financial condition or
results of operations, as reported under IFRS. Other companies in the industry may calculate adjusted EBITDA
differently from Embraer, for the purposes of their earnings releases, limiting the adjusted EBITDA’s usefulness
as a comparative measure.
SOME FINANCIAL RATIOS BASED ON “NON GAAP” INFORMATION
(1) (2) (1)
Certain Financial Ratios - IFRS
3Q12 4Q11 4Q12
Total debt to Adjusted EBITDA (i) 3.27 2.98 2.32
Net cash to Adjusted EBITDA (ii) 0.19 0.80 0.35
Total debt to capitalization (iii) 0.39 0.35 0.38
LTM Adjusted EBITDA to financial expense (gross) (iv) 5.49 5.43 7.51
LTM Adjusted EBITDA (v) 638.6 557.0 890.9
LTM Interest and commissions on loans (vi) 116.3 102.6 118.7
(1) Derived from unaudited financial information.
(2) Derived from audited financial information.
(i) Total debt represents short and long-term loans and financing.
(ii) Net cash represents cash and cash equivalents, plus financial investments, minus short and long-term loans and financing.
(iii) Total capitalization represents short and long-term loans and financing, plus shareholders equity.
(iv) Interest expense (gross) includes only interest and commissions on loans.
(v) The table at the end of this release sets forth the reconciliation of Net income to adjusted EBITDA, calculated on the basis of financial information prepared
with IFRS data, for the indicated periods.
(vi) Interest expense (gross) includes only interest and commissions on loans, which are included in Interest income (expense), net presented in the Company’s
consolidated Income Statement
Page 10
11. 4th Quarter and Fiscal Year 2012
Results in IFRS
EMBRAER - S.A.
CONSOLIDATED STATEMENTS OF INCOME
(in millions of U.S.dollars, except earnings per share)
Three months ended on Twelve months ended on
(1) (2) (1)
31 Dec, 2011 31 Dec, 2012 31 Dec, 2011 31 Dec, 2012
REVENUE 2,025.1 1,900.2 5,803.0 6,177.9
Cost of sales and services (1,568.7) (1,433.8) (4,495.9) (4,683.0)
Gross profit 456.4 466.4 1,307.1 1,494.9
OPERATING INCOME ( EXPENSE )
Administrative (71.5) (75.1) (262.5) (280.5)
Selling (113.9) (143.7) (419.3) (482.0)
Research (26.0) (25.3) (85.3) (77.3)
Other operating income (expense), net (250.6) 5.7 (221.5) (42.8)
Equity in losses of associates (0.3) - (0.3) (0.2)
OPERATING PROFIT (LOSS) BEFORE FINANCIAL INCOME (5.9) 228.0 318.2 612.1
Financial (expenses) income, net (115.2) 1.8 (90.7) (6.8)
Foreign exchange gain, net (6.9) (5.7) 20.0 8.8
PROFIT (LOSS) BEFORE TAXES ON INCOME (128.0) 224.1 247.5 614.1
Income tax (expense) income 39.4 (101.4) (127.1) (265.5)
NET INCOME (LOSS) (88.6) 122.7 120.4 348.6
Attributable to:
Owners of Embraer (91.8) 123.2 111.6 347.8
Noncontrolling interest 3.2 (0.5) 8.8 0.8
Weighted average number of shares (in thousands)
Basic 723.7 725.0 723.7 725.0
Diluted 724.4 727.7 724.8 727.7
Earnings (loss) per share
Basic (0.12681) 0.16993 0.15423 0.4797
Diluted (0.12669) 0.16931 0.15397 0.4780
Earnings (loss) per share - ADS basic (US$) (0.5072) 0.6797 0.6169 1.9188
Earnings (loss) per share - ADS diluted (US$) (0.5068) 0.6772 0.6159 1.9121
(1) Derived from unaudited financial statements.
(2) Derived from audited financial statements.
Page 11
12. 4th Quarter and Fiscal Year 2012
Results in IFRS
EMBRAER - S.A.
CONSOLIDATED STATEMENTS OF CASH FLOWS
(in millions of U.S.dollars)
Three months ended on Twelve months ended on
(1) (2) (1)
31 Dec, 2011 31 Dec, 2012 31 Dec, 2011 31 Dec, 2012
Operating activities
Net income (loss) (88.6) 122.7 120.4 348.6
Items not affecting cash and cash equivalents
Depreciation 20.4 42.6 109.3 139.9
Amortization 44.7 40.9 129.5 138.9
Allowance (reversal) for inventory obsolescence (15.6) 14.2 (12.8) 10.2
Inventory reserves 5.3 28.4 5.3 34.1
Deferred income tax and social contribution (48.6) 11.0 85.0 75.4
Accrued interest (3.2) (12.4) 1.7 (5.5)
Equity in the losses of associates 0.3 - 0.3 0.2
Share-based remuneration 2.0 1.7 9.7 8.0
Foreign exchange gain (loss), net 8.3 8.2 (13.0) 4.4
Residual value guarantee 33.8 (8.6) 34.4 14.0
Other (1.6) 2.9 (5.9) 12.3
Changes in assets:
Financial investments (3) (243.1) 76.6 (124.3) 160.0
Collateralized accounts receivable and accounts receivable 17.5 68.6 (126.2) 9.6
Customer and commercial financing 18.3 6.7 (31.8) (7.3)
Inventories 517.1 353.1 (97.9) 76.9
Other assets 30.2 (66.3) (8.8) (167.4)
Changes in liabilities:
Trade accounts payable (159.3) (29.2) 83.8 (72.7)
Non-recourse and recourse debt (2.7) (54.7) (7.7) (62.4)
Other payables (25.5) (108.8) (26.0) (39.4)
Contribution from suppliers (8.1) (7.1) 40.2 (31.8)
Advances from customers (113.4) (41.3) 85.7 (47.5)
Taxes and payroll charges payable (6.7) (42.2) (1.2) 23.6
Financial guarantee 271.6 88.8 240.9 (8.6)
Provisions (62.3) 15.0 (4.1) 54.6
Unearned income (12.1) 14.1 (6.3) 26.8
Net cash generated by operating activities 178.7 524.9 480.2 694.8
Investing activities
Additions to property, plant and equipment (76.8) (162.7) (334.3) (328.0)
Proceeds from sale of property, plant and equipment 0.1 1.2 0.3 1.3
Additions to intangible assets (60.1) (75.7) (217.4) (252.4)
Investments in associates 3.0 2.5 (3.0) 2.5
Business acquisitions, net of cash acquired (0.6) (6.2) (51.5) (6.2)
Bonds and securities (1.6) (21.6) 3.9 (17.1)
Net cash (used in) investing activities (136.0) (262.4) (602.0) (599.9)
Financing activities
Proceeds from borrowings 633.1 144.2 2,362.5 1,692.6
Repayment of borrowings (768.6) (150.8) (2,082.7) (1,225.3)
Dividends and interest on own capital (30.8) (23.4) (183.4) (59.5)
Acquisition of non controlling interest - - - (17.4)
Treasury shares - 2.6 - 14.5
Net cash (used in) generated by financing activities (166.3) (27.4) 96.4 404.9
Effects of exchange rate changes on cash and cash equivalents 39.7 (6.9) (17.5) (49.0)
Increase (decrease) in cash and cash equivalents (83.9) 228.2 (42.9) 451.0
Cash and cash equivalents at the beginning of the period 1,434.1 1,573.0 1,393.1 1,350.2
Cash and cash equivalents at the end of the period 1,350.2 1,801.2 1,350.2 1,801.2
(1) Derived from unaudited financial statements.
(2) Derived from audited financial statements
(3) Include Unrealized (gain) on Financial investments, 4Q11 (8.3), 4Q12 (4.4), 12M11 (51.5) and 12M12 (35.9)
Page 12
13. 4th Quarter and Fiscal Year 2012
Results in IFRS
EMBRAER - S.A.
CONSOLIDATED STATEMENT OF FINANCIAL POSITION
(in millions of U.S. dollars)
(2) (1)
AS S ETS As of December 31, As of December 31,
2011 2012
Current assets
Cash and cash equivalents 1,350.2 1,801.2
Financial assets
Financial investments 753.6 578.2
Trade accounts receivable, net 505.8 529.2
Derivative financial instruments 8.2 11.2
Customer and commercial financing 12.0 22.7
Collateralized accounts receivable 14.9 13.0
Inventories 2,283.4 2,155.3
Other assets 241.3 255.1
5,169.4 5,365.9
Non-current assets
Financial investments 54.7 51.3
Financialaccounts receivable
Trade assets 0.2 9.9
Derivative financial instruments 22.7 24.8
Customer and commercial financing 90.2 86.9
Collateralized accounts receivable 472.7 413.0
Guarantee deposits 471.4 581.5
Deferred income tax 65.9 12.9
Inventories 4.2 -
Other assets 245.4 246.8
Investments 2.8 -
Property, plant and equipment
Property, plant and equipment, net 1,450.4 1,738.5
Intangible assets 808.3 958.9
3,688.9 4,124.5
TOTAL ASSETS 8,858.3 9,490.4
(1) Derived from unaudited financial information.
(2) Derived from audited financial information.
Page 13
14. 4th Quarter and Fiscal Year 2012
Results in IFRS
EMBRAER - S.A.
CONSOLIDATED STATEMENT OF FINANCIAL POSITION
(in millions of U.S. dollars)
(2) (1)
LIABILITIES As of December 31, As of December 31,
2011 2012
Current liabilities
Trade accounts payable 829.9 758.9
Loans and financing 251.8 336.3
Non-recourse and recourse debt 312.8 11.9
Other payables 261.1 277.6
Contribution from suppliers 0.9 0.9
Advances from customers 856.1 902.0
Derivative financial instruments 1.0 0.9
Taxes and payroll charges payable 89.2 65.4
Income tax and social contribution 11.2 63.6
Financial guarantee and residual value guarantee - 114.1
Provisions 96.5 96.7
Dividends payable 0.1 30.4
Unearned income 131.1 133.7
2,841.7 2,792.4
Non-current liabilities
Loans and financing 1,406.3 1,730.2
Non-recourse and recourse debt 149.8 388.3
Other payables 14.0 11.1
Contribution from suppliers 1.0 -
Advances from customers 214.0 100.4
Derivative financial instruments 0.2 -
Taxes and payroll charges payable 386.8 350.0
Deferred income tax and social contribution 23.0 26.5
Financial guarantee and residual value guarantee 494.9 470.3
Provisions 124.8 162.7
Unearned income 84.0 108.2
2,898.8 3,347.7
TOTAL LIABILITIES 5,740.5 6,140.1
SHAREHOLDERS' EQUITY
Capital 1,438.0 1,438.0
Treasury shares (183.7) (154.2)
Revenue reserves 1,737.3 1,980.3
Share-based remuneration 13.1 21.0
Other Comprehensive Income 2.6 (26.8)
3,007.3 3,258.3
Non-controlling interest 110.5 92.0
Total company's shareholders' equity 3,117.8 3,350.3
TOTAL LIABILITIES AND SHAREHOLDERS' EQUITY 8,858.3 9,490.4
(1) Derived from unaudited financial information.
(2) Derived from audited financial information.
Page 14
15. 4th Quarter and Fiscal Year 2012
Results in IFRS
INVESTOR RELATIONS
Luciano Froes, Caio Pinez, Cláudio Massuda, Juliana Villarinho and Paulo Ferreira
(+55 12) 3927-4404
investor.relations@embraer.com.br
http://ri.embraer.com.br
Follow Embraer’s IR Department on twitter: @IREmbraer
CONFERENCE CALL INFORMATION
th
Embraer will host a conference call to present its 4Q and FY2012 Results in IFRS on Wednesday, March 13 ,
2013 at 10:30AM (SP) / 09:30AM (NY). The conference call will also be broadcast live over the web at
http://ri.embraer.com.br
Telephones:
Operator Assisted (US/ Canada) Toll-Free Dial-In Number: (877) 846-1574
Operator Assisted International Dial-In Number: (+1 708) 290-0687
Your own International Toll-Free number for Brazil: 0800 047 4803 (land line) and 0800 047 4801 (cell phone)
Code: 74559173
ABOUT EMBRAER
Embraer S.A. (NYSE: ERJ; BM&FBOVESPA: EMBR3) is the world’s largest manufacturer of commercial jets up
to 120 seats, and one of Brazil’s leading exporters. Embraer’s headquarters are located in São José dos
Campos, São Paulo, and it has offices, industrial operations and customer service facilities in Brazil, China,
France, Portugal, Singapore, and the U.S. Founded in 1969, the Company designs, develops, manufactures
and sells aircraft and systems for the commercial aviation, executive aviation, and defense and security
segments. It also provides after sales support and services to customers worldwide. For more information,
please visit www.embraer.com.br.
This document may contain projections, statements and estimates regarding circumstances or events yet to take place.
Those projections and estimates are based largely on current expectations, forecasts on future events and financial trends
that affect Embraer’s businesses. Those estimates are subject to risks, uncertainties and suppositions that include, among
others: general economic, political and trade conditions in Brazil and in those markets where Embraer does business;
expectations on industry trends; the company’s investment plans; its capacity to develop and deliver products on the dates
previously agreed upon, and existing and future governmental regulations. The words “believe”, “may”, “is able”, “will be
able”, “intend”, “continue”, “anticipate”, “expect” and other similar terms are intended to identify potentialities. Embraer does
not undertake any obligation to publish updates nor to revise any estimates due to new information, future events or any
other facts. In view of the inherent risks and uncertainties, such estimates, events and circumstances may not take place.
The actual results can therefore differ substantially from those previously published as Embraer expectations.
Page 15