SlideShare une entreprise Scribd logo
1  sur  14
Télécharger pour lire hors ligne
Questions for Review
1. First, Keynes conjectured that the marginal propensity to consume—the amount con-
sumed out of an additional dollar of income—is between zero and one. This means that
if an individual’s income increases by a dollar, both consumption and saving increase.
Second, Keynes conjectured that the ratio of consumption to income—called the
average propensity to consume—falls as income rises. This implies that the rich save a
higher proportion of their income than do the poor.
Third, Keynes conjectured that income is the primary determinant of consump-
tion. In particular, he believed that the interest rate does not have an important effect
on consumption.
A consumption function that satisfies these three conjectures is
C = C + cY.
C is a constant level of “autonomous consumption,” and Y is disposable income; c is the
marginal propensity to consume, and is between zero and one.
2. The evidence that was consistent with Keynes’s conjectures came from studies of house-
hold data and short time-series. There were two observations from household data.
First, households with higher income consumed more and saved more, implying that
the marginal propensity to consume is between zero and one. Second, higher-income
households saved a larger fraction of their income than lower-income households,
implying that the average propensity to consume falls with income.
There were three additional observations from short time-series. First, in years
when aggregate income was low, both consumption and saving were low, implying that
the marginal propensity to consume is between zero and one. Second, in years with low
income, the ratio of consumption to income was high, implying that the average propen-
sity to consume falls as income rises. Third, the correlation between income and con-
sumption seemed so strong that no variables other than income seemed important in
explaining consumption.
The first piece of evidence against Keynes’s three conjectures came from the fail-
ure of “secular stagnation” to occur after World War II. Based on the Keynesian con-
sumption function, some economists expected that as income increased over time, the
saving rate would also increase; they feared that there might not be enough profitable
investment projects to absorb this saving, and the economy might enter a long depres-
sion of indefinite duration. This did not happen.
The second piece of evidence against Keynes’s conjectures came from studies of
long time-series of consumption and income. Simon Kuznets found that the ratio of con-
sumption to income was stable from decade to decade; that is, the average propensity to
consume did not seem to be falling over time as income increased.
3. Both the life-cycle and permanent-income hypotheses emphasize that an individual’s
time horizon is longer than a single year. Thus, consumption is not simply a function of
current income.
The life-cycle hypothesis stresses that income varies over a person’s life; saving
allows consumers to move income from those times in life when income is high to those
times when it is low. The life-cycle hypothesis predicts that consumption should depend
on both wealth and income, since these determine a person’s lifetime resources. Hence,
we expect the consumption function to look like
C = αW + βY.
170
C H A P T E R 16 Understanding Consumer Behavior
Chapter 16 Understanding Consumer Behavior 171
In the short run, with wealth fixed, we get a “conventional” Keynesian consumption
function. In the long run, wealth increases, so the short-run consumption function
shifts upward, as shown in Figure 16-1.
The permanent-income hypothesis also implies that people try to smooth con-
sumption, though its emphasis is slightly different. Rather than focusing on the pat-
tern of income over a lifetime, the permanent-income hypothesis emphasizes that peo-
ple experience random and temporary changes in their income from year to year. The
permanent-income hypothesis views current income as the sum of permanent income
Y
p
and transitory income Y
t
. Milton Friedman hypothesized that consumption should
depend primarily on permanent income:
C = αY
p
.
The permanent-income hypothesis explains the consumption puzzle by suggesting
that the standard Keynesian consumption function uses the wrong variable for income.
For example, if a household has high transitory income, it will not have higher con-
sumption; hence, if much of the variability in income is transitory, a researcher would
find that high-income households had, on average, a lower average propensity to con-
sume. This is also true in short time-series if much of the year-to-year variation in
income is transitory. In long time-series, however, variations in income are largely per-
manent; therefore, consumers do not save any increases in income, but consume them
instead.
C
Y
Income
αw
αw
Consumption
'
Figure 16-1
172 Answers to Textbook Questions and Problems
4. Fisher’s model of consumption looks at how a consumer who lives two periods will
make consumption choices in order to be as well off as possible. Figure 16-2(A) shows
the effect of an increase in second-period income if the consumer does not face a binding
borrowing constraint. The budget constraint shifts outward, and the consumer increas-
es consumption in both the first and the second period. In Figure 16-2(A), Y1 is the first
period income and Y2 is second period income. In choosing to consume at point A or B,
the consumer is consuming more than their income in period 1 and less than their
income in period 2.
Figure 16-2(B) shows what happens if there is a binding borrowing constraint.
The consumer would like to borrow to increase first-period consumption but cannot. If
income increases in the second period, the consumer is unable to increase first-period
consumption. Therefore, the consumer continues to consume his or her entire income in
each period. That is, for those consumers who would like to borrow but cannot, con-
sumption depends only on current income.
C2
Y2
Y2
+ Δ Y2
Second-period
consumption
I2
I1
C1
Y1
First-period consumption
B
A
Old
budget
constraint
New budget constraint
Figure 16-2A
New
budget
constraint
Old
budget
constraint
B
A
C2
Y2
+ ΔY2
Y2
Second-period
consumption
Y1
C1
First-period consumption
I1
I2
Figure 16-2B
Chapter 16 Understanding Consumer Behavior 173
5. The permanent-income hypothesis implies that consumers try to smooth consumption
over time, so that current consumption is based on current expectations about lifetime
income. It follows that changes in consumption reflect “surprises” about lifetime
income. If consumers have rational expectations, then these surprises are unpre-
dictable. Hence, consumption changes are also unpredictable.
6. Section 16.6 included several examples of time-inconsistent behavior, in which con-
sumers alter their decisions simply because time passes. For example, a person may
legitimately want to lose weight, but decide to eat a large dinner today and eat a small
dinner tomorrow and thereafter. But the next day, they may once again make the same
choice—eating a large dinner that day while promising to eat less on following days.
Problems and Applications
1. Figure 16-3 shows the effect of an increase in the interest rate on a consumer who bor-
rows in the first period. The increase in the real interest rate causes the budget line to
rotate around the point (Y1, Y2), becoming steeper.
We can break the effect on consumption from this change into an income and sub-
stitution effect. The income effect is the change in consumption that results from the
movement to a different indifference curve. Because the consumer is a borrower, the
increase in the interest rate makes the consumer worse off—that is, he or she cannot
achieve as high an indifference curve. If consumption in each period is a normal good,
this tends to reduce both C1 and C2.
The substitution effect is the change in consumption that results from the change
in the relative price of consumption in the two periods. The increase in the interest rate
makes second-period consumption relatively less expensive; this tends to make the con-
sumer choose more consumption in the second period and less consumption in the first
period.
On net, we find that for a borrower, first-period consumption falls unambiguously
when the real interest rate rises, since both the income and substitution effects push in
the same direction. Second-period consumption might rise or fall, depending on which
New budget
constraint
Old
budget
constraint
C2
Y2
ΔC2
Second-period
consumption
I1
I2
C1
Y1
ΔC1
First-period consumption
B A
Figure 16-3
174 Answers to Textbook Questions and Problems
effect is stronger. In Figure 16-3, we show the case in which the substitution effect is
stronger than the income effect, so that C2 increases.
2. a. We can use Jill’s intertemporal budget constraint to solve for the interest rate:
C1 + = Y1 +
$100 + = $0 +
r = 10%.
Jill borrowed $100 for consumption in the first period and in the second period
used her $210 income to pay $110 on the loan (principal plus interest) and $100
for consumption.
b. The rise in interest rates leads Jack to consume less today and more tomorrow.
This is because of the substitution effect: it costs him more to consume today than
tomorrow, because of the higher opportunity cost in terms of forgone interest. This
is shown in Figure 16-4.
By revealed preference we know Jack is better off: at the new interest rate he
could still consume $100 in each period, so the only reason he would change his
consumption pattern is if the change makes him better off.
C2
1 + r
$100
1 + r
$210
1 + r
Y2
1 + r
B
A
100 191 C1
Consumption today
Consumption
tomorrow
100
210
C2
Figure 16-4
Chapter 16 Understanding Consumer Behavior 175
c. Jill consumes less today, while her consumption tomorrow can either rise or fall.
She faces both a substitution effect and income effect. Because consumption today
is more expensive, she substitutes out of it. Also, since all her income is in the sec-
ond period, the higher interest rate raises her cost of borrowing and, thus, lowers
her income. Assuming consumption in period one is a normal good, this provides
an additional incentive for lowering it. Her new consumption choice is at point B
in Figure 16-5.
We know Jill is worse off with the higher interest rates because she could have
consumed at point B before (by not spending all of her second-period money) but
chose not to because point A had higher utility.
3. a. A consumer who consumes less than his income in period one is a saver and faces
an interest rate rs. His budget constraint is
C1 + C2/(1 + rs) = Y1 + Y2/(1 + rs).
b. A consumer who consumes more than income in period one is a borrower and faces
an interest rate rb. The budget constraint is
C1 + C2/(1 + rb) = Y1 + Y2/(1 + rb).
B
A
100 191 C1
Consumption today
Consumption
tomorrow
100
210
C2
Figure 16-5
176 Answers to Textbook Questions and Problems
c. Figure 16-6 shows the two budget constraints; they intersect at the point (Y1, Y2),
where the consumer is neither a borrower nor a lender. The shaded area repre-
sents the combinations of first-period and second-period consumption that the con-
sumer can choose. To the left of the point (Y1, Y2), the interest rate is rb.
d. Figure 16-7 shows the three cases. Figure 16-7(A) shows the case of a saver for
whom the indifference curve is tangent to the budget constraint along the line seg-
ment to the left of (Y1, Y2). Figure 16-7(B) shows the case of a borrower for whom
the indifference curve is tangent to the budget constraint along the line segment
to the right of (Y1, Y2). Finally, Figure 16-7(C) shows the case in which the con-
sumer is neither a borrower nor a lender: the highest indifference curve the con-
sumer can reach is the one that passes through the point (Y1, Y2).
C1
Y1
First-period consumption
Y2
C2
Second-period
consumption
Interest rate
of rs
Interest rate
of rb
Figure 16-6
Chapter 16 Understanding Consumer Behavior 177
I
C2
C2
Y2
Second-period
consumption
C1
First-period consumption
Y1
C1
Figure 16-7A
I
C2
C2
Y2
Second-period
consumption
C1
C1
Y1
Figure 16-7B
I
C2
Y2
Second-period
consumption
C1
Y1
First-period consumption
Figure 16-7C
178 Answers to Textbook Questions and Problems
e. If the consumer is a saver, then consumption in the first period depends on [Y1 +
Y2/(1 + rs)]—that is, income in both periods, Y1 and Y2, and the interest rate rs. If
the consumer is a borrower, then consumption in the first period depends on [Y1 +
Y2/(1 + rb)]—that is, income in both periods, Y1 and Y2, and the interest rate rb.
Note that borrowers discount future income more than savers.
If the consumer is neither a borrower nor a lender, then consumption in the
first period depends just on Y1.
4. The potency of fiscal policy to influence aggregate demand depends on the effect on con-
sumption: if consumption changes a lot, then fiscal policy will have a large multiplier.
If consumption changes only a little, then fiscal policy will have a small multiplier.
That is, the fiscal-policy multipliers are higher if the marginal propensity to consume is
higher.
a. Consider a two-period Fisher diagram. A temporary tax cut means an increase in
first-period disposable income Y1. Figure 16-8(A) shows the effect of this tax cut on
a consumer who does not face a binding borrowing constraint, whereas Figure 16-
8(B) shows the effect of this tax cut on a consumer who is constrained.
The consumer with the constraint would have liked to get a loan to increase C1,
but could not. The temporary tax cut increases disposable income: as shown in the
figure, the consumer’s consumption rises by the full amount that taxes fall. The
consumer who is constrained thus increases first-period consumption C1 by more
A
B
A B
C2
Y2
C2
Y2
Second-period
consumption
Second-period
consumption
Y1
+ Δ Y1
Y1
First-period consumption
Y1
+ Δ Y1
I1
C1
I1
Y1
C1
I2
I2
Figure 16-8A
Figure 16-8B
Chapter 16 Understanding Consumer Behavior 179
than the consumer who is not constrained—that is, the marginal propensity to
consume is higher for a consumer who faces a borrowing constraint. Therefore, fis-
cal policy is more potent with binding borrowing constraints than it is without
them.
b. Again, consider a two-period Fisher diagram. The announcement of a future tax
cut increases Y2. Figure 16-9(A) shows the effect of this tax cut on a consumer who
does not face a binding borrowing constraint, whereas Figure 16-9(B) shows the
effect of this tax cut on a consumer who is constrained.
The consumer who is not constrained immediately increases consumption C1. The
consumer who is constrained cannot increase C1, because disposable income has
not changed. Therefore, the announcement of a future tax cut has no effect on con-
sumption or aggregate demand if consumers face binding borrowing constraints:
fiscal policy is less potent.
5. a. The life-cycle hypothesis states that individuals want to smooth their consumption
as much as possible during their lifetime. People will add up their expected earn-
ings and divide by the number of years they expect to live. Early in life they will
save, and later in life they will dissave. Wealth will rise until they retire, and then
will decline. Table 16-1, which follows, shows the consumption for Dave and
Christy across five years, and Table 16-2, which follows, shows their saving across
B
A
B
A
I1
C1
Y1
Y2
C2
Y2
+ Δ Y2
Second-period
consumption
Second-period
consumption
C2
Y2
+ Δ Y2
Y2
C1
Y1
I2
New budget
constraint
First-period consumption
I2
I1
New budget
constraint
Figure 16-9A
Figure 16-9B
180 Answers to Textbook Questions and Problems
the five years. Note that Christy saves nothing during the first year because her
income is less than her consumption. In the second year, when her income rises, she
consumes $60,000, pays off her debt of $20,000, and saves the remaining $20,000.
Table 16-1
C1 C2 C3 C4 C5
Dave 60,000 60,000 60,000 60,000 60,000
Christy 60,000 60,000 60,000 60,000 60,000
Table 16-2
S1 S2 S3 S4 S5
Dave 40,000 40,000 40,000 0 0
Christy 0 20,000 100,000 0 0
b. Table 16-3, which follows, identifies the level of wealth for Dave and Christy at the
beginning of each across the five years. Both individuals start with no wealth. At the
beginning of the second year, Dave has $40,000 of wealth due to his saving. Christy has
–$20,000 because she had to borrow.
Table 16-3
W1 W2 W3 W4 W5 W6
Dave 0 40,000 80,000 120,000 60,000 0
Christy 0 –20,000 20,000 120,000 60,000 0
c. Figure 16-10 shows Dave’s consumption, income, and wealth across the five years. Note
that Dave’s wealth increases steadily to a level of $120,000 and then declines to zero
over the last two years. Figure 16-11 shows Christy’s consumption, income, and wealth
across the five years. Note that Christy’s wealth is negative in the first year, and then
rises to its peak of $120,000 by the beginning of the fourth year.
Wealth
Income
Consumption
Time
20,000
60,000
100,000
$
1 2 3 4 5
Figure 16-10
Chapter 16 Understanding Consumer Behavior 181
d. If there is no borrowing, then nothing changes for Dave because he never borrowed.
Since Christy is unable to borrow in year 1 when her income is low, she will consume
her entire income of $40,000. Her consumption in the remaining years is now higher
than it was when she could borrow because her income is much higher in years 2 and 3.
She spreads this higher income across the remaining 4 years and saves accordingly.
Tables 16-4, 16-5, and 16-6, which follow, identify Dave’s and Christy’s consumption,
saving, and wealth when there is no borrowing across the five years. Figure 16-12,
which follows, illustrates Christy’s new consumption, income, and wealth levels across
the five years.
Table 16-4
C1 C2 C3 C4 C5
Dave 60,000 60,000 60,000 60,000 60,000
Christy 40,000 65,000 65,000 65,000 65,000
Table 16-5
S1 S2 S3 S4 S5
Dave 40,000 40,000 40,000 0 0
Christy 0 35,000 95,000 0 0
Table 16-6
W1 W2 W3 W4 W5 W6
Dave 0 40,000 80,000 120,000 60,000 0
Christy 0 0 35,000 130,000 65,000 0
Wealth
Income
Consumption
Time
–20,000
40,000
80,000
120,000
160,000
$
1 2 3 4 5
Figure 16-11
182 Answers to Textbook Questions and Problems
6. The life-cycle model predicts that an important source of saving is that people save
while they work to finance consumption after they retire. That is, the young save, and
the old dissave. If the fraction of the population that is elderly will increase over the
next 20 years, the life-cycle model predicts that as these elderly retire, they will begin
to dissave their accumulated wealth in order to finance their retirement consumption:
thus, the national saving rate should fall over the next 20 years.
7. a. In this chapter, we discussed two explanations for why the elderly do not dissave
as rapidly as the life-cycle model predicts. First, because of the possibility of
unpredictable and costly events, they may keep some precautionary saving as a
buffer in case they live longer than expected or have large medical bills. Second,
they may want to leave bequests to their children, relatives, or charities, so again,
they do not dissave all of their wealth during retirement.
b. If the elderly who do not have children dissave at the same rate as the elderly who
do have children, this seems to imply that the reason for low dissaving is the pre-
cautionary motive; the bequest motive is presumably stronger for people who have
children than for those who don’t. An alternative interpretation is that perhaps
having children does not increase desired saving. For example, having children
raises the bequest motive, but it may also lower the precautionary motive: you can
rely on your children in case of financial emergency. Perhaps the two effects on
saving cancel each other.
8. a. If you are a fully rational and time-consistent consumer, you would certainly pre-
fer the saving account that lets you take the money out on demand. After all, you
get the same return on that account, but in unexpected circumstances (e.g., if you
suffer an unexpected, temporary decline in income), you can use the funds in the
account to finance your consumption.
b. By contrast, if you face the “pull of instant gratification,” you may prefer the
account that requires a 30-day notification before withdrawals. In this way, you
precommit yourself to not using the funds to satisfy a desire for instant gratifica-
tion. This precommitment offers a way to overcome the time-inconsistency prob-
lem. That is, some people would like to save more, but at any particular moment,
they face such a strong desire for instant gratification that they always choose to
consume rather than save.
c. If you prefer the account that lets you take money out on demand, then you are
the type of consumer described by the models of Irving Fisher, Franco Modigliani,
and Milton Friedman. If you prefer the account that requires 30-day notice to
withdraw funds, then you are the type of consumer described by the model of
David Laibson.
Wealth
Income
Consumption
Time
40,000
35,000
80,000
65,000
120,000
130,000
160,000
$
1 2 3 4 5
Figure 16-12
Chapter 16 Understanding Consumer Behavior 183
9. a. According to Fisher’s model, consumers allocate their income across time periods
so that the marginal rate of substitution between consumption in any two periods
is equal to 1 + r, where r is the real interest rate. In this problem, the real interest
rate is zero. The marginal rate of substitution is the ratio of the marginal utilities
in any two periods. To find the marginal utility, differentiate the utility function
with respect to Ci to find MUi = 1/Ci. For time periods 1 and 2, we find:
For time periods 2 and 3, we find:
Therefore, C1 = C2 = C3 = $40,000.
b. David also sets his marginal rate of substitution between any two periods equal to
1. For time periods 1 and 2, we find:
For time periods 2 and 3, we find:
We also know C1 + C2 + C3 = $120,000. Substitute in for C1 and C3 from the pre-
ceding equations to find 2C2 + C2 + C2 = $120,000, such that C1 = $60,000 and C2 =
C3 = $30,000. After period 1, David has $60,000 in wealth.
c. In period 2, David now gets twice as much utility as in period 3. Following the
same process as in the preceding, we find C2 = 2C3, such that David will con-
sume $40,000 in period 2 and $20,000 in period 3. David has revised his decision
from period 1 because he values present consumption twice as high as future
consumption.
d. If David could constrain his choices in period 2, he would prefer to consume
$30,000 in period 2 and $30,000 in period 3. Given his utility function, he prefers
to consume $60,000 in year 1 and $30,000 in each of the two next years. David’s
preferences are an example of Laibson’s pull of instant gratification model. David
may know he is an imperfect decision maker, so he may prefer to constrain his
future decisions.
1
1
1
1
2
1 2
/
/
C
C
C C
=
=
1
1
1
2
3
2 3
/
/
C
C
C C
=
=
2
1
1
2
1
2
1 2
/
/
C
C
C C
=
=
1
1
1
2
3
2 3
/
/
C
C
C C
=
=

Contenu connexe

Similaire à Mankiw8e sm macro-chap16_170-183

Mankiw_7e_Chapter17 (1).ppt
Mankiw_7e_Chapter17 (1).pptMankiw_7e_Chapter17 (1).ppt
Mankiw_7e_Chapter17 (1).pptMoatazMohamed98
 
Macroeconomics chapter 16
Macroeconomics chapter 16Macroeconomics chapter 16
Macroeconomics chapter 16MDevSNPT
 
Consumption theories.pdf
Consumption theories.pdfConsumption theories.pdf
Consumption theories.pdfAyushi Thakur
 
Income and consumption function hypothesis.pptx
Income and consumption function hypothesis.pptxIncome and consumption function hypothesis.pptx
Income and consumption function hypothesis.pptxVinothM59282
 
Gregory mankiw macroeconomic 7th edition chapter (16)
Gregory mankiw macroeconomic 7th edition chapter  (16)Gregory mankiw macroeconomic 7th edition chapter  (16)
Gregory mankiw macroeconomic 7th edition chapter (16)Kyaw Thiha
 
Richardian Equivalence
Richardian EquivalenceRichardian Equivalence
Richardian EquivalenceThomasReader
 
Consumption function
Consumption functionConsumption function
Consumption functionArpan Ramtek
 
Consumption.ppt
Consumption.pptConsumption.ppt
Consumption.pptJaafar47
 
Chap01.ppt
Chap01.pptChap01.ppt
Chap01.pptMjMj96
 
AN ENQUIRY INTO CONSUMPTION THEORIES.pdf
AN ENQUIRY INTO CONSUMPTION THEORIES.pdfAN ENQUIRY INTO CONSUMPTION THEORIES.pdf
AN ENQUIRY INTO CONSUMPTION THEORIES.pdfFinmonkeyIn
 
Consumption function and investment function chapter 2
Consumption function and investment function chapter 2Consumption function and investment function chapter 2
Consumption function and investment function chapter 2Nayan Vaghela
 
MACROECONOMICS-CH15
MACROECONOMICS-CH15MACROECONOMICS-CH15
MACROECONOMICS-CH15kkjjkevin03
 
Chapter 3 -consumption and investment for BBA
Chapter 3 -consumption and investment for BBAChapter 3 -consumption and investment for BBA
Chapter 3 -consumption and investment for BBAginish9841502661
 
Macro eco
Macro ecoMacro eco
Macro ecoJapan27
 

Similaire à Mankiw8e sm macro-chap16_170-183 (20)

Ma II.pptx
Ma II.pptxMa II.pptx
Ma II.pptx
 
Mankiw_7e_Chapter17 (1).ppt
Mankiw_7e_Chapter17 (1).pptMankiw_7e_Chapter17 (1).ppt
Mankiw_7e_Chapter17 (1).ppt
 
Macroeconomics chapter 16
Macroeconomics chapter 16Macroeconomics chapter 16
Macroeconomics chapter 16
 
23 consumption
23 consumption23 consumption
23 consumption
 
Consumption theories.pdf
Consumption theories.pdfConsumption theories.pdf
Consumption theories.pdf
 
Income and consumption function hypothesis.pptx
Income and consumption function hypothesis.pptxIncome and consumption function hypothesis.pptx
Income and consumption function hypothesis.pptx
 
Gregory mankiw macroeconomic 7th edition chapter (16)
Gregory mankiw macroeconomic 7th edition chapter  (16)Gregory mankiw macroeconomic 7th edition chapter  (16)
Gregory mankiw macroeconomic 7th edition chapter (16)
 
Consumption hypotheses
Consumption hypothesesConsumption hypotheses
Consumption hypotheses
 
Theory of consumption
Theory of consumptionTheory of consumption
Theory of consumption
 
Richardian Equivalence
Richardian EquivalenceRichardian Equivalence
Richardian Equivalence
 
consumption 2.ppt
consumption 2.pptconsumption 2.ppt
consumption 2.ppt
 
Consumption function
Consumption functionConsumption function
Consumption function
 
Consumption.ppt
Consumption.pptConsumption.ppt
Consumption.ppt
 
Chap01.ppt
Chap01.pptChap01.ppt
Chap01.ppt
 
AN ENQUIRY INTO CONSUMPTION THEORIES.pdf
AN ENQUIRY INTO CONSUMPTION THEORIES.pdfAN ENQUIRY INTO CONSUMPTION THEORIES.pdf
AN ENQUIRY INTO CONSUMPTION THEORIES.pdf
 
Consumption function and investment function chapter 2
Consumption function and investment function chapter 2Consumption function and investment function chapter 2
Consumption function and investment function chapter 2
 
MACROECONOMICS-CH15
MACROECONOMICS-CH15MACROECONOMICS-CH15
MACROECONOMICS-CH15
 
Chapter 3 -consumption and investment for BBA
Chapter 3 -consumption and investment for BBAChapter 3 -consumption and investment for BBA
Chapter 3 -consumption and investment for BBA
 
Fiscal Policy
Fiscal PolicyFiscal Policy
Fiscal Policy
 
Macro eco
Macro ecoMacro eco
Macro eco
 

Dernier

TEST BANK For Corporate Finance, 13th Edition By Stephen Ross, Randolph Weste...
TEST BANK For Corporate Finance, 13th Edition By Stephen Ross, Randolph Weste...TEST BANK For Corporate Finance, 13th Edition By Stephen Ross, Randolph Weste...
TEST BANK For Corporate Finance, 13th Edition By Stephen Ross, Randolph Weste...ssifa0344
 
The Economic History of the U.S. Lecture 23.pdf
The Economic History of the U.S. Lecture 23.pdfThe Economic History of the U.S. Lecture 23.pdf
The Economic History of the U.S. Lecture 23.pdfGale Pooley
 
Vip Call US 📞 7738631006 ✅Call Girls In Sakinaka ( Mumbai )
Vip Call US 📞 7738631006 ✅Call Girls In Sakinaka ( Mumbai )Vip Call US 📞 7738631006 ✅Call Girls In Sakinaka ( Mumbai )
Vip Call US 📞 7738631006 ✅Call Girls In Sakinaka ( Mumbai )Pooja Nehwal
 
WhatsApp 📞 Call : 9892124323 ✅Call Girls In Chembur ( Mumbai ) secure service
WhatsApp 📞 Call : 9892124323  ✅Call Girls In Chembur ( Mumbai ) secure serviceWhatsApp 📞 Call : 9892124323  ✅Call Girls In Chembur ( Mumbai ) secure service
WhatsApp 📞 Call : 9892124323 ✅Call Girls In Chembur ( Mumbai ) secure servicePooja Nehwal
 
VIP Independent Call Girls in Andheri 🌹 9920725232 ( Call Me ) Mumbai Escorts...
VIP Independent Call Girls in Andheri 🌹 9920725232 ( Call Me ) Mumbai Escorts...VIP Independent Call Girls in Andheri 🌹 9920725232 ( Call Me ) Mumbai Escorts...
VIP Independent Call Girls in Andheri 🌹 9920725232 ( Call Me ) Mumbai Escorts...dipikadinghjn ( Why You Choose Us? ) Escorts
 
05_Annelore Lenoir_Docbyte_MeetupDora&Cybersecurity.pptx
05_Annelore Lenoir_Docbyte_MeetupDora&Cybersecurity.pptx05_Annelore Lenoir_Docbyte_MeetupDora&Cybersecurity.pptx
05_Annelore Lenoir_Docbyte_MeetupDora&Cybersecurity.pptxFinTech Belgium
 
Top Rated Pune Call Girls Dighi ⟟ 6297143586 ⟟ Call Me For Genuine Sex Servi...
Top Rated  Pune Call Girls Dighi ⟟ 6297143586 ⟟ Call Me For Genuine Sex Servi...Top Rated  Pune Call Girls Dighi ⟟ 6297143586 ⟟ Call Me For Genuine Sex Servi...
Top Rated Pune Call Girls Dighi ⟟ 6297143586 ⟟ Call Me For Genuine Sex Servi...Call Girls in Nagpur High Profile
 
Vasai-Virar Fantastic Call Girls-9833754194-Call Girls MUmbai
Vasai-Virar Fantastic Call Girls-9833754194-Call Girls MUmbaiVasai-Virar Fantastic Call Girls-9833754194-Call Girls MUmbai
Vasai-Virar Fantastic Call Girls-9833754194-Call Girls MUmbaipriyasharma62062
 
VIP Independent Call Girls in Mumbai 🌹 9920725232 ( Call Me ) Mumbai Escorts ...
VIP Independent Call Girls in Mumbai 🌹 9920725232 ( Call Me ) Mumbai Escorts ...VIP Independent Call Girls in Mumbai 🌹 9920725232 ( Call Me ) Mumbai Escorts ...
VIP Independent Call Girls in Mumbai 🌹 9920725232 ( Call Me ) Mumbai Escorts ...dipikadinghjn ( Why You Choose Us? ) Escorts
 
Stock Market Brief Deck (Under Pressure).pdf
Stock Market Brief Deck (Under Pressure).pdfStock Market Brief Deck (Under Pressure).pdf
Stock Market Brief Deck (Under Pressure).pdfMichael Silva
 
The Economic History of the U.S. Lecture 26.pdf
The Economic History of the U.S. Lecture 26.pdfThe Economic History of the U.S. Lecture 26.pdf
The Economic History of the U.S. Lecture 26.pdfGale Pooley
 
VIP Independent Call Girls in Mira Bhayandar 🌹 9920725232 ( Call Me ) Mumbai ...
VIP Independent Call Girls in Mira Bhayandar 🌹 9920725232 ( Call Me ) Mumbai ...VIP Independent Call Girls in Mira Bhayandar 🌹 9920725232 ( Call Me ) Mumbai ...
VIP Independent Call Girls in Mira Bhayandar 🌹 9920725232 ( Call Me ) Mumbai ...dipikadinghjn ( Why You Choose Us? ) Escorts
 
The Economic History of the U.S. Lecture 17.pdf
The Economic History of the U.S. Lecture 17.pdfThe Economic History of the U.S. Lecture 17.pdf
The Economic History of the U.S. Lecture 17.pdfGale Pooley
 
The Economic History of the U.S. Lecture 19.pdf
The Economic History of the U.S. Lecture 19.pdfThe Economic History of the U.S. Lecture 19.pdf
The Economic History of the U.S. Lecture 19.pdfGale Pooley
 
( Jasmin ) Top VIP Escorts Service Dindigul 💧 7737669865 💧 by Dindigul Call G...
( Jasmin ) Top VIP Escorts Service Dindigul 💧 7737669865 💧 by Dindigul Call G...( Jasmin ) Top VIP Escorts Service Dindigul 💧 7737669865 💧 by Dindigul Call G...
( Jasmin ) Top VIP Escorts Service Dindigul 💧 7737669865 💧 by Dindigul Call G...dipikadinghjn ( Why You Choose Us? ) Escorts
 
The Economic History of the U.S. Lecture 25.pdf
The Economic History of the U.S. Lecture 25.pdfThe Economic History of the U.S. Lecture 25.pdf
The Economic History of the U.S. Lecture 25.pdfGale Pooley
 
Shrambal_Distributors_Newsletter_Apr-2024 (1).pdf
Shrambal_Distributors_Newsletter_Apr-2024 (1).pdfShrambal_Distributors_Newsletter_Apr-2024 (1).pdf
Shrambal_Distributors_Newsletter_Apr-2024 (1).pdfvikashdidwania1
 
The Economic History of the U.S. Lecture 20.pdf
The Economic History of the U.S. Lecture 20.pdfThe Economic History of the U.S. Lecture 20.pdf
The Economic History of the U.S. Lecture 20.pdfGale Pooley
 
VIP Call Girl in Mumbai 💧 9920725232 ( Call Me ) Get A New Crush Everyday Wit...
VIP Call Girl in Mumbai 💧 9920725232 ( Call Me ) Get A New Crush Everyday Wit...VIP Call Girl in Mumbai 💧 9920725232 ( Call Me ) Get A New Crush Everyday Wit...
VIP Call Girl in Mumbai 💧 9920725232 ( Call Me ) Get A New Crush Everyday Wit...dipikadinghjn ( Why You Choose Us? ) Escorts
 
Booking open Available Pune Call Girls Shivane 6297143586 Call Hot Indian Gi...
Booking open Available Pune Call Girls Shivane  6297143586 Call Hot Indian Gi...Booking open Available Pune Call Girls Shivane  6297143586 Call Hot Indian Gi...
Booking open Available Pune Call Girls Shivane 6297143586 Call Hot Indian Gi...Call Girls in Nagpur High Profile
 

Dernier (20)

TEST BANK For Corporate Finance, 13th Edition By Stephen Ross, Randolph Weste...
TEST BANK For Corporate Finance, 13th Edition By Stephen Ross, Randolph Weste...TEST BANK For Corporate Finance, 13th Edition By Stephen Ross, Randolph Weste...
TEST BANK For Corporate Finance, 13th Edition By Stephen Ross, Randolph Weste...
 
The Economic History of the U.S. Lecture 23.pdf
The Economic History of the U.S. Lecture 23.pdfThe Economic History of the U.S. Lecture 23.pdf
The Economic History of the U.S. Lecture 23.pdf
 
Vip Call US 📞 7738631006 ✅Call Girls In Sakinaka ( Mumbai )
Vip Call US 📞 7738631006 ✅Call Girls In Sakinaka ( Mumbai )Vip Call US 📞 7738631006 ✅Call Girls In Sakinaka ( Mumbai )
Vip Call US 📞 7738631006 ✅Call Girls In Sakinaka ( Mumbai )
 
WhatsApp 📞 Call : 9892124323 ✅Call Girls In Chembur ( Mumbai ) secure service
WhatsApp 📞 Call : 9892124323  ✅Call Girls In Chembur ( Mumbai ) secure serviceWhatsApp 📞 Call : 9892124323  ✅Call Girls In Chembur ( Mumbai ) secure service
WhatsApp 📞 Call : 9892124323 ✅Call Girls In Chembur ( Mumbai ) secure service
 
VIP Independent Call Girls in Andheri 🌹 9920725232 ( Call Me ) Mumbai Escorts...
VIP Independent Call Girls in Andheri 🌹 9920725232 ( Call Me ) Mumbai Escorts...VIP Independent Call Girls in Andheri 🌹 9920725232 ( Call Me ) Mumbai Escorts...
VIP Independent Call Girls in Andheri 🌹 9920725232 ( Call Me ) Mumbai Escorts...
 
05_Annelore Lenoir_Docbyte_MeetupDora&Cybersecurity.pptx
05_Annelore Lenoir_Docbyte_MeetupDora&Cybersecurity.pptx05_Annelore Lenoir_Docbyte_MeetupDora&Cybersecurity.pptx
05_Annelore Lenoir_Docbyte_MeetupDora&Cybersecurity.pptx
 
Top Rated Pune Call Girls Dighi ⟟ 6297143586 ⟟ Call Me For Genuine Sex Servi...
Top Rated  Pune Call Girls Dighi ⟟ 6297143586 ⟟ Call Me For Genuine Sex Servi...Top Rated  Pune Call Girls Dighi ⟟ 6297143586 ⟟ Call Me For Genuine Sex Servi...
Top Rated Pune Call Girls Dighi ⟟ 6297143586 ⟟ Call Me For Genuine Sex Servi...
 
Vasai-Virar Fantastic Call Girls-9833754194-Call Girls MUmbai
Vasai-Virar Fantastic Call Girls-9833754194-Call Girls MUmbaiVasai-Virar Fantastic Call Girls-9833754194-Call Girls MUmbai
Vasai-Virar Fantastic Call Girls-9833754194-Call Girls MUmbai
 
VIP Independent Call Girls in Mumbai 🌹 9920725232 ( Call Me ) Mumbai Escorts ...
VIP Independent Call Girls in Mumbai 🌹 9920725232 ( Call Me ) Mumbai Escorts ...VIP Independent Call Girls in Mumbai 🌹 9920725232 ( Call Me ) Mumbai Escorts ...
VIP Independent Call Girls in Mumbai 🌹 9920725232 ( Call Me ) Mumbai Escorts ...
 
Stock Market Brief Deck (Under Pressure).pdf
Stock Market Brief Deck (Under Pressure).pdfStock Market Brief Deck (Under Pressure).pdf
Stock Market Brief Deck (Under Pressure).pdf
 
The Economic History of the U.S. Lecture 26.pdf
The Economic History of the U.S. Lecture 26.pdfThe Economic History of the U.S. Lecture 26.pdf
The Economic History of the U.S. Lecture 26.pdf
 
VIP Independent Call Girls in Mira Bhayandar 🌹 9920725232 ( Call Me ) Mumbai ...
VIP Independent Call Girls in Mira Bhayandar 🌹 9920725232 ( Call Me ) Mumbai ...VIP Independent Call Girls in Mira Bhayandar 🌹 9920725232 ( Call Me ) Mumbai ...
VIP Independent Call Girls in Mira Bhayandar 🌹 9920725232 ( Call Me ) Mumbai ...
 
The Economic History of the U.S. Lecture 17.pdf
The Economic History of the U.S. Lecture 17.pdfThe Economic History of the U.S. Lecture 17.pdf
The Economic History of the U.S. Lecture 17.pdf
 
The Economic History of the U.S. Lecture 19.pdf
The Economic History of the U.S. Lecture 19.pdfThe Economic History of the U.S. Lecture 19.pdf
The Economic History of the U.S. Lecture 19.pdf
 
( Jasmin ) Top VIP Escorts Service Dindigul 💧 7737669865 💧 by Dindigul Call G...
( Jasmin ) Top VIP Escorts Service Dindigul 💧 7737669865 💧 by Dindigul Call G...( Jasmin ) Top VIP Escorts Service Dindigul 💧 7737669865 💧 by Dindigul Call G...
( Jasmin ) Top VIP Escorts Service Dindigul 💧 7737669865 💧 by Dindigul Call G...
 
The Economic History of the U.S. Lecture 25.pdf
The Economic History of the U.S. Lecture 25.pdfThe Economic History of the U.S. Lecture 25.pdf
The Economic History of the U.S. Lecture 25.pdf
 
Shrambal_Distributors_Newsletter_Apr-2024 (1).pdf
Shrambal_Distributors_Newsletter_Apr-2024 (1).pdfShrambal_Distributors_Newsletter_Apr-2024 (1).pdf
Shrambal_Distributors_Newsletter_Apr-2024 (1).pdf
 
The Economic History of the U.S. Lecture 20.pdf
The Economic History of the U.S. Lecture 20.pdfThe Economic History of the U.S. Lecture 20.pdf
The Economic History of the U.S. Lecture 20.pdf
 
VIP Call Girl in Mumbai 💧 9920725232 ( Call Me ) Get A New Crush Everyday Wit...
VIP Call Girl in Mumbai 💧 9920725232 ( Call Me ) Get A New Crush Everyday Wit...VIP Call Girl in Mumbai 💧 9920725232 ( Call Me ) Get A New Crush Everyday Wit...
VIP Call Girl in Mumbai 💧 9920725232 ( Call Me ) Get A New Crush Everyday Wit...
 
Booking open Available Pune Call Girls Shivane 6297143586 Call Hot Indian Gi...
Booking open Available Pune Call Girls Shivane  6297143586 Call Hot Indian Gi...Booking open Available Pune Call Girls Shivane  6297143586 Call Hot Indian Gi...
Booking open Available Pune Call Girls Shivane 6297143586 Call Hot Indian Gi...
 

Mankiw8e sm macro-chap16_170-183

  • 1. Questions for Review 1. First, Keynes conjectured that the marginal propensity to consume—the amount con- sumed out of an additional dollar of income—is between zero and one. This means that if an individual’s income increases by a dollar, both consumption and saving increase. Second, Keynes conjectured that the ratio of consumption to income—called the average propensity to consume—falls as income rises. This implies that the rich save a higher proportion of their income than do the poor. Third, Keynes conjectured that income is the primary determinant of consump- tion. In particular, he believed that the interest rate does not have an important effect on consumption. A consumption function that satisfies these three conjectures is C = C + cY. C is a constant level of “autonomous consumption,” and Y is disposable income; c is the marginal propensity to consume, and is between zero and one. 2. The evidence that was consistent with Keynes’s conjectures came from studies of house- hold data and short time-series. There were two observations from household data. First, households with higher income consumed more and saved more, implying that the marginal propensity to consume is between zero and one. Second, higher-income households saved a larger fraction of their income than lower-income households, implying that the average propensity to consume falls with income. There were three additional observations from short time-series. First, in years when aggregate income was low, both consumption and saving were low, implying that the marginal propensity to consume is between zero and one. Second, in years with low income, the ratio of consumption to income was high, implying that the average propen- sity to consume falls as income rises. Third, the correlation between income and con- sumption seemed so strong that no variables other than income seemed important in explaining consumption. The first piece of evidence against Keynes’s three conjectures came from the fail- ure of “secular stagnation” to occur after World War II. Based on the Keynesian con- sumption function, some economists expected that as income increased over time, the saving rate would also increase; they feared that there might not be enough profitable investment projects to absorb this saving, and the economy might enter a long depres- sion of indefinite duration. This did not happen. The second piece of evidence against Keynes’s conjectures came from studies of long time-series of consumption and income. Simon Kuznets found that the ratio of con- sumption to income was stable from decade to decade; that is, the average propensity to consume did not seem to be falling over time as income increased. 3. Both the life-cycle and permanent-income hypotheses emphasize that an individual’s time horizon is longer than a single year. Thus, consumption is not simply a function of current income. The life-cycle hypothesis stresses that income varies over a person’s life; saving allows consumers to move income from those times in life when income is high to those times when it is low. The life-cycle hypothesis predicts that consumption should depend on both wealth and income, since these determine a person’s lifetime resources. Hence, we expect the consumption function to look like C = αW + βY. 170 C H A P T E R 16 Understanding Consumer Behavior
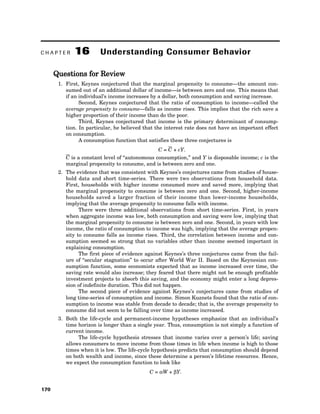
  • 2. Chapter 16 Understanding Consumer Behavior 171 In the short run, with wealth fixed, we get a “conventional” Keynesian consumption function. In the long run, wealth increases, so the short-run consumption function shifts upward, as shown in Figure 16-1. The permanent-income hypothesis also implies that people try to smooth con- sumption, though its emphasis is slightly different. Rather than focusing on the pat- tern of income over a lifetime, the permanent-income hypothesis emphasizes that peo- ple experience random and temporary changes in their income from year to year. The permanent-income hypothesis views current income as the sum of permanent income Y p and transitory income Y t . Milton Friedman hypothesized that consumption should depend primarily on permanent income: C = αY p . The permanent-income hypothesis explains the consumption puzzle by suggesting that the standard Keynesian consumption function uses the wrong variable for income. For example, if a household has high transitory income, it will not have higher con- sumption; hence, if much of the variability in income is transitory, a researcher would find that high-income households had, on average, a lower average propensity to con- sume. This is also true in short time-series if much of the year-to-year variation in income is transitory. In long time-series, however, variations in income are largely per- manent; therefore, consumers do not save any increases in income, but consume them instead. C Y Income αw αw Consumption ' Figure 16-1
  • 3. 172 Answers to Textbook Questions and Problems 4. Fisher’s model of consumption looks at how a consumer who lives two periods will make consumption choices in order to be as well off as possible. Figure 16-2(A) shows the effect of an increase in second-period income if the consumer does not face a binding borrowing constraint. The budget constraint shifts outward, and the consumer increas- es consumption in both the first and the second period. In Figure 16-2(A), Y1 is the first period income and Y2 is second period income. In choosing to consume at point A or B, the consumer is consuming more than their income in period 1 and less than their income in period 2. Figure 16-2(B) shows what happens if there is a binding borrowing constraint. The consumer would like to borrow to increase first-period consumption but cannot. If income increases in the second period, the consumer is unable to increase first-period consumption. Therefore, the consumer continues to consume his or her entire income in each period. That is, for those consumers who would like to borrow but cannot, con- sumption depends only on current income. C2 Y2 Y2 + Δ Y2 Second-period consumption I2 I1 C1 Y1 First-period consumption B A Old budget constraint New budget constraint Figure 16-2A New budget constraint Old budget constraint B A C2 Y2 + ΔY2 Y2 Second-period consumption Y1 C1 First-period consumption I1 I2 Figure 16-2B
  • 4. Chapter 16 Understanding Consumer Behavior 173 5. The permanent-income hypothesis implies that consumers try to smooth consumption over time, so that current consumption is based on current expectations about lifetime income. It follows that changes in consumption reflect “surprises” about lifetime income. If consumers have rational expectations, then these surprises are unpre- dictable. Hence, consumption changes are also unpredictable. 6. Section 16.6 included several examples of time-inconsistent behavior, in which con- sumers alter their decisions simply because time passes. For example, a person may legitimately want to lose weight, but decide to eat a large dinner today and eat a small dinner tomorrow and thereafter. But the next day, they may once again make the same choice—eating a large dinner that day while promising to eat less on following days. Problems and Applications 1. Figure 16-3 shows the effect of an increase in the interest rate on a consumer who bor- rows in the first period. The increase in the real interest rate causes the budget line to rotate around the point (Y1, Y2), becoming steeper. We can break the effect on consumption from this change into an income and sub- stitution effect. The income effect is the change in consumption that results from the movement to a different indifference curve. Because the consumer is a borrower, the increase in the interest rate makes the consumer worse off—that is, he or she cannot achieve as high an indifference curve. If consumption in each period is a normal good, this tends to reduce both C1 and C2. The substitution effect is the change in consumption that results from the change in the relative price of consumption in the two periods. The increase in the interest rate makes second-period consumption relatively less expensive; this tends to make the con- sumer choose more consumption in the second period and less consumption in the first period. On net, we find that for a borrower, first-period consumption falls unambiguously when the real interest rate rises, since both the income and substitution effects push in the same direction. Second-period consumption might rise or fall, depending on which New budget constraint Old budget constraint C2 Y2 ΔC2 Second-period consumption I1 I2 C1 Y1 ΔC1 First-period consumption B A Figure 16-3
  • 5. 174 Answers to Textbook Questions and Problems effect is stronger. In Figure 16-3, we show the case in which the substitution effect is stronger than the income effect, so that C2 increases. 2. a. We can use Jill’s intertemporal budget constraint to solve for the interest rate: C1 + = Y1 + $100 + = $0 + r = 10%. Jill borrowed $100 for consumption in the first period and in the second period used her $210 income to pay $110 on the loan (principal plus interest) and $100 for consumption. b. The rise in interest rates leads Jack to consume less today and more tomorrow. This is because of the substitution effect: it costs him more to consume today than tomorrow, because of the higher opportunity cost in terms of forgone interest. This is shown in Figure 16-4. By revealed preference we know Jack is better off: at the new interest rate he could still consume $100 in each period, so the only reason he would change his consumption pattern is if the change makes him better off. C2 1 + r $100 1 + r $210 1 + r Y2 1 + r B A 100 191 C1 Consumption today Consumption tomorrow 100 210 C2 Figure 16-4
  • 6. Chapter 16 Understanding Consumer Behavior 175 c. Jill consumes less today, while her consumption tomorrow can either rise or fall. She faces both a substitution effect and income effect. Because consumption today is more expensive, she substitutes out of it. Also, since all her income is in the sec- ond period, the higher interest rate raises her cost of borrowing and, thus, lowers her income. Assuming consumption in period one is a normal good, this provides an additional incentive for lowering it. Her new consumption choice is at point B in Figure 16-5. We know Jill is worse off with the higher interest rates because she could have consumed at point B before (by not spending all of her second-period money) but chose not to because point A had higher utility. 3. a. A consumer who consumes less than his income in period one is a saver and faces an interest rate rs. His budget constraint is C1 + C2/(1 + rs) = Y1 + Y2/(1 + rs). b. A consumer who consumes more than income in period one is a borrower and faces an interest rate rb. The budget constraint is C1 + C2/(1 + rb) = Y1 + Y2/(1 + rb). B A 100 191 C1 Consumption today Consumption tomorrow 100 210 C2 Figure 16-5
  • 7. 176 Answers to Textbook Questions and Problems c. Figure 16-6 shows the two budget constraints; they intersect at the point (Y1, Y2), where the consumer is neither a borrower nor a lender. The shaded area repre- sents the combinations of first-period and second-period consumption that the con- sumer can choose. To the left of the point (Y1, Y2), the interest rate is rb. d. Figure 16-7 shows the three cases. Figure 16-7(A) shows the case of a saver for whom the indifference curve is tangent to the budget constraint along the line seg- ment to the left of (Y1, Y2). Figure 16-7(B) shows the case of a borrower for whom the indifference curve is tangent to the budget constraint along the line segment to the right of (Y1, Y2). Finally, Figure 16-7(C) shows the case in which the con- sumer is neither a borrower nor a lender: the highest indifference curve the con- sumer can reach is the one that passes through the point (Y1, Y2). C1 Y1 First-period consumption Y2 C2 Second-period consumption Interest rate of rs Interest rate of rb Figure 16-6
  • 8. Chapter 16 Understanding Consumer Behavior 177 I C2 C2 Y2 Second-period consumption C1 First-period consumption Y1 C1 Figure 16-7A I C2 C2 Y2 Second-period consumption C1 C1 Y1 Figure 16-7B I C2 Y2 Second-period consumption C1 Y1 First-period consumption Figure 16-7C
  • 9. 178 Answers to Textbook Questions and Problems e. If the consumer is a saver, then consumption in the first period depends on [Y1 + Y2/(1 + rs)]—that is, income in both periods, Y1 and Y2, and the interest rate rs. If the consumer is a borrower, then consumption in the first period depends on [Y1 + Y2/(1 + rb)]—that is, income in both periods, Y1 and Y2, and the interest rate rb. Note that borrowers discount future income more than savers. If the consumer is neither a borrower nor a lender, then consumption in the first period depends just on Y1. 4. The potency of fiscal policy to influence aggregate demand depends on the effect on con- sumption: if consumption changes a lot, then fiscal policy will have a large multiplier. If consumption changes only a little, then fiscal policy will have a small multiplier. That is, the fiscal-policy multipliers are higher if the marginal propensity to consume is higher. a. Consider a two-period Fisher diagram. A temporary tax cut means an increase in first-period disposable income Y1. Figure 16-8(A) shows the effect of this tax cut on a consumer who does not face a binding borrowing constraint, whereas Figure 16- 8(B) shows the effect of this tax cut on a consumer who is constrained. The consumer with the constraint would have liked to get a loan to increase C1, but could not. The temporary tax cut increases disposable income: as shown in the figure, the consumer’s consumption rises by the full amount that taxes fall. The consumer who is constrained thus increases first-period consumption C1 by more A B A B C2 Y2 C2 Y2 Second-period consumption Second-period consumption Y1 + Δ Y1 Y1 First-period consumption First-period consumption Y1 + Δ Y1 I1 C1 I1 Y1 C1 I2 I2 Figure 16-8A Figure 16-8B
  • 10. Chapter 16 Understanding Consumer Behavior 179 than the consumer who is not constrained—that is, the marginal propensity to consume is higher for a consumer who faces a borrowing constraint. Therefore, fis- cal policy is more potent with binding borrowing constraints than it is without them. b. Again, consider a two-period Fisher diagram. The announcement of a future tax cut increases Y2. Figure 16-9(A) shows the effect of this tax cut on a consumer who does not face a binding borrowing constraint, whereas Figure 16-9(B) shows the effect of this tax cut on a consumer who is constrained. The consumer who is not constrained immediately increases consumption C1. The consumer who is constrained cannot increase C1, because disposable income has not changed. Therefore, the announcement of a future tax cut has no effect on con- sumption or aggregate demand if consumers face binding borrowing constraints: fiscal policy is less potent. 5. a. The life-cycle hypothesis states that individuals want to smooth their consumption as much as possible during their lifetime. People will add up their expected earn- ings and divide by the number of years they expect to live. Early in life they will save, and later in life they will dissave. Wealth will rise until they retire, and then will decline. Table 16-1, which follows, shows the consumption for Dave and Christy across five years, and Table 16-2, which follows, shows their saving across B A B A I1 C1 Y1 Y2 C2 Y2 + Δ Y2 Second-period consumption Second-period consumption C2 Y2 + Δ Y2 Y2 C1 Y1 I2 New budget constraint First-period consumption I2 I1 New budget constraint Figure 16-9A Figure 16-9B
  • 11. 180 Answers to Textbook Questions and Problems the five years. Note that Christy saves nothing during the first year because her income is less than her consumption. In the second year, when her income rises, she consumes $60,000, pays off her debt of $20,000, and saves the remaining $20,000. Table 16-1 C1 C2 C3 C4 C5 Dave 60,000 60,000 60,000 60,000 60,000 Christy 60,000 60,000 60,000 60,000 60,000 Table 16-2 S1 S2 S3 S4 S5 Dave 40,000 40,000 40,000 0 0 Christy 0 20,000 100,000 0 0 b. Table 16-3, which follows, identifies the level of wealth for Dave and Christy at the beginning of each across the five years. Both individuals start with no wealth. At the beginning of the second year, Dave has $40,000 of wealth due to his saving. Christy has –$20,000 because she had to borrow. Table 16-3 W1 W2 W3 W4 W5 W6 Dave 0 40,000 80,000 120,000 60,000 0 Christy 0 –20,000 20,000 120,000 60,000 0 c. Figure 16-10 shows Dave’s consumption, income, and wealth across the five years. Note that Dave’s wealth increases steadily to a level of $120,000 and then declines to zero over the last two years. Figure 16-11 shows Christy’s consumption, income, and wealth across the five years. Note that Christy’s wealth is negative in the first year, and then rises to its peak of $120,000 by the beginning of the fourth year. Wealth Income Consumption Time 20,000 60,000 100,000 $ 1 2 3 4 5 Figure 16-10
  • 12. Chapter 16 Understanding Consumer Behavior 181 d. If there is no borrowing, then nothing changes for Dave because he never borrowed. Since Christy is unable to borrow in year 1 when her income is low, she will consume her entire income of $40,000. Her consumption in the remaining years is now higher than it was when she could borrow because her income is much higher in years 2 and 3. She spreads this higher income across the remaining 4 years and saves accordingly. Tables 16-4, 16-5, and 16-6, which follow, identify Dave’s and Christy’s consumption, saving, and wealth when there is no borrowing across the five years. Figure 16-12, which follows, illustrates Christy’s new consumption, income, and wealth levels across the five years. Table 16-4 C1 C2 C3 C4 C5 Dave 60,000 60,000 60,000 60,000 60,000 Christy 40,000 65,000 65,000 65,000 65,000 Table 16-5 S1 S2 S3 S4 S5 Dave 40,000 40,000 40,000 0 0 Christy 0 35,000 95,000 0 0 Table 16-6 W1 W2 W3 W4 W5 W6 Dave 0 40,000 80,000 120,000 60,000 0 Christy 0 0 35,000 130,000 65,000 0 Wealth Income Consumption Time –20,000 40,000 80,000 120,000 160,000 $ 1 2 3 4 5 Figure 16-11
  • 13. 182 Answers to Textbook Questions and Problems 6. The life-cycle model predicts that an important source of saving is that people save while they work to finance consumption after they retire. That is, the young save, and the old dissave. If the fraction of the population that is elderly will increase over the next 20 years, the life-cycle model predicts that as these elderly retire, they will begin to dissave their accumulated wealth in order to finance their retirement consumption: thus, the national saving rate should fall over the next 20 years. 7. a. In this chapter, we discussed two explanations for why the elderly do not dissave as rapidly as the life-cycle model predicts. First, because of the possibility of unpredictable and costly events, they may keep some precautionary saving as a buffer in case they live longer than expected or have large medical bills. Second, they may want to leave bequests to their children, relatives, or charities, so again, they do not dissave all of their wealth during retirement. b. If the elderly who do not have children dissave at the same rate as the elderly who do have children, this seems to imply that the reason for low dissaving is the pre- cautionary motive; the bequest motive is presumably stronger for people who have children than for those who don’t. An alternative interpretation is that perhaps having children does not increase desired saving. For example, having children raises the bequest motive, but it may also lower the precautionary motive: you can rely on your children in case of financial emergency. Perhaps the two effects on saving cancel each other. 8. a. If you are a fully rational and time-consistent consumer, you would certainly pre- fer the saving account that lets you take the money out on demand. After all, you get the same return on that account, but in unexpected circumstances (e.g., if you suffer an unexpected, temporary decline in income), you can use the funds in the account to finance your consumption. b. By contrast, if you face the “pull of instant gratification,” you may prefer the account that requires a 30-day notification before withdrawals. In this way, you precommit yourself to not using the funds to satisfy a desire for instant gratifica- tion. This precommitment offers a way to overcome the time-inconsistency prob- lem. That is, some people would like to save more, but at any particular moment, they face such a strong desire for instant gratification that they always choose to consume rather than save. c. If you prefer the account that lets you take money out on demand, then you are the type of consumer described by the models of Irving Fisher, Franco Modigliani, and Milton Friedman. If you prefer the account that requires 30-day notice to withdraw funds, then you are the type of consumer described by the model of David Laibson. Wealth Income Consumption Time 40,000 35,000 80,000 65,000 120,000 130,000 160,000 $ 1 2 3 4 5 Figure 16-12
  • 14. Chapter 16 Understanding Consumer Behavior 183 9. a. According to Fisher’s model, consumers allocate their income across time periods so that the marginal rate of substitution between consumption in any two periods is equal to 1 + r, where r is the real interest rate. In this problem, the real interest rate is zero. The marginal rate of substitution is the ratio of the marginal utilities in any two periods. To find the marginal utility, differentiate the utility function with respect to Ci to find MUi = 1/Ci. For time periods 1 and 2, we find: For time periods 2 and 3, we find: Therefore, C1 = C2 = C3 = $40,000. b. David also sets his marginal rate of substitution between any two periods equal to 1. For time periods 1 and 2, we find: For time periods 2 and 3, we find: We also know C1 + C2 + C3 = $120,000. Substitute in for C1 and C3 from the pre- ceding equations to find 2C2 + C2 + C2 = $120,000, such that C1 = $60,000 and C2 = C3 = $30,000. After period 1, David has $60,000 in wealth. c. In period 2, David now gets twice as much utility as in period 3. Following the same process as in the preceding, we find C2 = 2C3, such that David will con- sume $40,000 in period 2 and $20,000 in period 3. David has revised his decision from period 1 because he values present consumption twice as high as future consumption. d. If David could constrain his choices in period 2, he would prefer to consume $30,000 in period 2 and $30,000 in period 3. Given his utility function, he prefers to consume $60,000 in year 1 and $30,000 in each of the two next years. David’s preferences are an example of Laibson’s pull of instant gratification model. David may know he is an imperfect decision maker, so he may prefer to constrain his future decisions. 1 1 1 1 2 1 2 / / C C C C = = 1 1 1 2 3 2 3 / / C C C C = = 2 1 1 2 1 2 1 2 / / C C C C = = 1 1 1 2 3 2 3 / / C C C C = =