Practicing DGA - Diagnóstico DGA
•
2 j'aime•2,786 vues

Practicing DGA - Diagnóstico DGA
Recommandé

Recommandé
Contenu connexe
Tendances
Tendances (20)
Similaire à Practicing DGA - Diagnóstico DGA
Similaire à Practicing DGA - Diagnóstico DGA (20)
Plus de TRANSEQUIPOS S.A.
Plus de TRANSEQUIPOS S.A. (20)
Dernier
Dernier (20)
Practicing DGA - Diagnóstico DGA
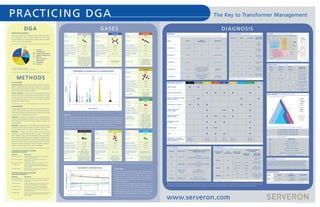
- 1. DIAGNOSISGASES DISSOLVED GAS ANALYSIS (DGA) is the single most comprehensive asset condition assessment and management tool for oil-filled transformers. DGA offers advanced detection of incipient fault conditions leading to almost all of the failure modes listed below. Chart Source: William H. Bartley, P.E. The Hartford Steam Boiler Inspection and Insurance Co. METHODS OIL COLLECTION Manual Collection - A small volume of oil is collected for laboratory analysis and transferred into a gas-tight container from a dedicated fitting and then transported to the laboratory. ASTM method D3613 details procedures for oil sample handling. On-Line Collection - In the case of On-Line Transfomer Monitors a small volume of oil is continuously circulated through the monitor and then returned to the transformer. The circulating oil is sampled and analyzed for gas content. On-Line Monitors offer a closed-loop repeatable oil collection process. GAS EXTRACTION Dissolved gases are present in transformer oil at concentrations from less than 1 part-per-million (ppm) up to a few percent of oil volume. ASTM method D3612 specifies three ways to separate the relatively small amount of dissolved gases from the oil. METHOD A – Introduce the oil sample into a pre-evacuated known volume. The evolved gases are compressed to atmospheric pressure and the total volume measured. The gases are then analyzed by gas chromatography. METHOD B – Sparging the oil with a carrier gas on a stripper column containing a high surface area bead. The gases are then flushed from the stripper column into a gas chromatograph for analysis. METHOD C – Bring an oil sample in contact with a gas phase (headspace) in a closed vessel purged with argon. The dissolved gases contained in the oil are then equilibrated in the two phases in contact under controlled conditions (in accordance with Henry’s law). At equilibrium, the headspace is over pressurized with argon and the content of a loop is filled by the depressurization of the headspace against the ambient atmospheric pressure. The gases contained in the loop are then introduced into a gas chromatograph. STANDARDS AND GUIDELINES GOVERNING DISSOLVED GAS ANALYSIS REFERENCE DESCRIPTION IEEE Std. C57.104.1991 IEEE Guide for the Interpretation of Gases Generated in Oil Immersed Transformers IEEE PC57.104 Draft 11d Draft Guide for the Interpretation of Gases in Oil Immersed Transformers IEEE Std. C57.12.80-2002 Terminology for Power and Distribution Transformers IEC 60599-1999 Mineral Oil Impregnated Electrical Equipment in Service: Guide to the Interpretation of Dissolved and Free Gas Analysis IEC 60599-1999-03 Reference to Duval Triangle Diagnostic Model and C2 H2 /H2 Ratio Interpretation STANDARDS AND GUIDELINES GOVERNING GAS EXTRACTION FROM OIL REFERENCE DESCRIPTION ASTM D2945-90 (2003) Standard Test Method for Gas Content of Insulating Oils ASTM D3305-95 (1999) Standard Practice for Sampling Small Gas Volume in a Transformer ASTM D3612-2002 Standard Test Method for Analysis of Gases Dissolved in Electrical Insulating Oil by Gas Chromatography ASTM D3613-1998 Standard practice for sampling Insulating Liquids for Gas Analysis and determination of Water Content ASTM D2759-2000 Standard Practice for Sampling Gas from a Transformer under Positive Pressure IEC 60567-1992 Guide for the sampling of gases and of oil from oil-filled electrical equipment and for the analysis of free and dissolved gases www.serveron.com DGA �� �� �� �� ��� ��� ��� ��� ��� Lightning Through Faults Insulation Deterioration Inadequate Maintenance Moisture Loose Connections Workmanship Overloading All Others ANALYSIS ASTM method D3612 and IEC 60567, specifies gas chromatography (GC) as the analysis method. The GC results are calibrated to known gas standards and normalized to standard temperature and pressure levels so that data obtained under different conditions may be compared meaningfully. Gas chromatography separates each gas from the others and directly measures their concentrations individually. When recorded over time, the resulting detector signal is called a chromatogram. Gas CARBON MONOXIDE Formula CO Structure Molecular Weight 28.010 Solubility in Oil @ 25˚C 7.52:1 Solubility in Oil @ 100˚C 8.33:1 Temperature at which Gas forms significant amount 105˚ - 300˚C (complete decomposi- tion & carbonization occurs > 300˚C) Source of Gas Thermal fault involving cellulose (paper, press- board, wood blocks); slowly from oil oxidation Gas METHANE Formula CH4 Structure Molecular Weight 16.043 Solubility in Oil @ 25˚C 2.28:1 Solubility in Oil @ 100˚C 2.27:1 Temperature at which Gas forms significant amount <150˚ - 300˚ C Source of Gas Corona partial- discharge; low & medium temperature thermal faults Gas OXYGEN Formula O2 Structure Molecular Weight 31.999 Solubility in Oil @ 25˚C 5.59:1 Solubility in Oil @ 100˚C 5.88:1 Temperature at which Gas forms significant amount Following drop in oil temperature (vacuum) Source of Gas Exposure to atmosphere (air); leaky gasket (under vacuum); air-breathing conservator; leaky bladder Gas HYDROGEN Formula H2 Structure Molecular Weight 2.016 Solubility in Oil @ 25˚C 17.92:1 Solubility in Oil @ 100˚C 13.51:1 Temperature at which Gas forms significant amount <150˚C for “cold plasma” ionization; (corona in oil) >250˚C for thermal & electrical faults Source of Gas Partial-discharge; thermal faults; power discharges; rust, galva- nized parts; stainless steel; sunlight Gas ETHYLENE Formula C2 H4 Structure Molecular Weight 28.054 Solubility in Oil @ 25˚C 1:1.76 Solubility in Oil @ 100˚C 1:1.47 Temperature at which Gas forms significant amount 300˚ - 700˚C Source of Gas High-temperature thermal fault Gas ACETYLENE Formula C2 H2 Structure Molecular Weight 26.038 Solubility in Oil @ 25˚C 1:1.22 Solubility in Oil @ 100˚C 1.08:1 Temperature at which Gas forms significant amount >700˚C Source of Gas Very hot spot; low- energy discharge (spitting from floating part); high- energy discharge (arc) Gas ETHANE Formula C2 H6 Structure Molecular Weight 30.069 Solubility in Oil @ 25˚C 1:2.59 Solubility in Oil @ 100˚C 1:2.09 Temperature at which Gas forms significant amount 200˚ - 400˚C Source of Gas Low & medium temperature thermal faults Gas CARBON DIOXIDE Formula CO2 Structure Molecular Weight 44.010 Solubility in Oil @ 25˚C 1:1.17 Solubility in Oil @ 100˚C 1:1.02 Temperature at which Gas forms significant amount 105˚ - 300˚C Source of Gas Normal aging (accelerated by amount of O2 -in-oil & H2 O-in-paper); thermal fault involving cellulose (paper, pressboard, wood blocks); accumulation from oil oxidation � � � � �� �������������� �������� �������������� ��������� ��������� ������ �������� ������ �������� ������� ��������������� ������������������������������������������������ �������� ������ ��������� ������� �������� ������� ������� �������������� ��������������� �������������������������������� ���������������������������������� ���� ���� ���� ����� � �� �� �� �� ��� �������������������� ���������������������������� �������� ������ � INDICATION / FAULT GAS CO CO2 CH4 C2H2 C2H4 C2H6 O2 H2 H2O Cellulose aging Mineral oil decomposition Leaks in oil expansion systems, gaskets, welds, etc. Thermal faults – Cellulose Thermal faults in Oil @ 150°C - 300°C TRACE Thermal faults in Oil @ 300°C - 700°C TRACE Thermal faults in Oil @ >700°C Partial Discharge TRACE Arcing Guidelines for surveillance range1 for Type 1 transformers (IEEE PC57.104 D11d) N <350 C 350 - 570 W >570 N <120 C 120 - 400 W >400 N <2 C 2 - 5 W >5 N <50 C 50 - 100 W >100 N <65 C 65 - 100 W >100 N <100 C 100 - 700 W >700 1 ppm for Normal (N), Caution (C), Warning (W) – alarm thresholds KEY GAS METHOD (IEEE PC57.104 D11d) KEY GAS FAULT TYPE TYPICAL PROPORTIONS OF GENERATED COMBUSTIBLE GASES C2 H4 Thermal oil Mainly C2 H4 Smaller proportions of C2 H6 , CH4 , and H2 Traces of C2 H2 at very high fault temperatures CO Thermal oil and cellulose Mainly CO Much smaller quantities of hydrocarbon gases in same proportions as thermal faults in oil alone. H2 Electrical Low Energy Partial Discarge Mainly H2 Small quantities of CH4 Traces of C2 H4 and C2 H6 H2 & C2 H2 Electrical High Energy (arcing) Mainly H2 and C2 H2 Minor traces of CH4 , C2 H4 , and C2 H6 Also CO if cellulose is involved TDCG METHOD (IEEE PC57.104 D11d) SURVEILLANCE RANGE TDCG LEVEL IN PPM DAILY RATE OF CHANGE1 SUGGESTED OPERATOR GUIDELINES SAMPLING INTERVAL OPERATING PROCEDURE Normal <700 <0.3% Normal Continue normal operation ≥0.3%, ≤0.5% Monthly Caution: Check load dependence Caution 700 to 1,900 >0.5%, ≤3% Monthly Caution: Check load dependence; advise manufacturer or insurer ≥3%, <7% Weekly >7% Daily Warning >1,900 <7% Weekly Extreme caution: Plan outage; advise manufacturer or insurer>7% Daily 1 2% of change from initial sample, per day CIGRE SC15 New Guidelines for Interpretation of Dissoved Gas Analysis in Oil-Filled Transformers, (ELECTRA No. 186 October 1999) NAME RATIO VALUE SIGNIFICANCE INDICATION KEY RATIO #1 C2 H2 /C2 H6 >1 Discharge KEY RATIO #2 H2 /CH4 >10 Partial Discharge KEY RATIO #3 C2 H4 /C2 H6 >1 Thermal Fault in Oil KEY RATIO #4 CO2/CO >10 indicates overheating of cellulose <3 indicates degradation of cellulose by electrical fault Cellulosic Degradation KEY RATIO #5 C2 H2 /H2 >2 (>30 ppm) indicates diffusion from OLTC or through a common conservator In Tank Load Tap Changer BASIC GAS RATIOS (IEC 60599-1999) C2 H2 /C2 H4 CH4 /H2 C2 H4 /C2 H6 SUGGESTED FAULT TYPE NS1 <0.1 <0.2 Partial Discharge (PD) >1.0 0.1 - 0.5 >1.0 Discharge of low energy (D1) 0.6 - 2.5 0.1 - 1.0 >2.0 Discharge of high energy (D2) NS1 >1.0 <1.0 Thermal fault, <300ºC (T1) <0.1 >1.0 1.0 - 4.0 Thermal fault, <300ºC – <700ºC (T2) <0.2 >1.0 >4.0 Thermal fault, >700ºC (T3) 1 Non-significant regardless of value PARTITIONING Each gas has a temperature-dependent affinity (solubility) for the oil; the hydrocarbon gases such as methane and ethane are more strongly dissolved in oil while fixed gases such as hydrogen or nitrogen are less strongly dissolved. As temperatures increase, the fixed gases are more strongly dissolved while the hydrocarbon gases are less strongly dissolved. The process of reaching equilibrium is called partitioning, and the final gas-to-oil concentration ratio is called the solubility coefficient. This ratio must be known accurately at the temperature of the oil sample undergoing analysis. Once the gases are analyzed by gas chromatography the original gas-in-oil concentrations are calculated from the gas-in-oil solubility coefficients in the table to the left. The Key to Transformer Management IEEE PC57.104 D11d NAME RATIO VALUE SIGNIFICANCE INDICATION CO2 vs. CO Ratio CO2 /CO <3 Excessive >7 - <10 Normal >10 Excessive Thermal Cellulosic Degradation Note: Ratio valid when levels exceed minimums: CO >500 ppm; CO2 >5,000 ppm Graphical Representation Applicable to IEEE PC57.104 D11d Rogers Ratios IEC 60599 (1999-03 Annex B.2 Basic Gas Ratios) ROGERS RATIOS (IEEE PC57.104 D11d) Ratio 1 Ratio 2 Ratio 3 SUGGESTED FAULT TYPECH4 /H2 C2 H2 /C2 H4 C2 H4 /C2 H6 <0.1 <0.01 <1.0 Case 0: Normal ≥0.1, <0.5 ≥1.0 ≥1.0 Case 1: Discharge of low energy ≥0.1, <1.0 ≥.0.6, <3.0 ≥2.0 Case 2: Discharge of high energy ≥1.0 <0.01 <1.0 Case 3: Thermal fault, low temp <300ºC ≥1.0 <0.1 ≥1.0, <4.0 Case 4: Thermal fault, <700ºC ≥1.0 <0.2 ≥4.0 Case 5: Thermal fault, >700ºC C2H2/H2 RATIO (IEC 60599-1999) OLTC’s (On-Load Tap Changers) produce gases corresponding to discharges of low energy. The pattern of oil decomposition in the OLTC differs from the pattern of oil decomposition in the main tank resulting from low energy discharges. If oil or gas contamination (communication) exists between the OLTC and the main tank, an incorrect diagnosis of the main tank may result. A C2 H2 /H2 ratio ≥3.0 in the main tank indicates possible OLTC contamination. DUVAL TRIANGLE (IEC 60599-1999-03 Annex B.3) This method uses three ratios to locate the point within the triangle. %CH4 = CH4 /(CH4 +C2 H4 +C2 H2 ) x 100 %C2 H4 = C2 H4 /(CH4 +C2 H4 +C2 H2 ) x 100 %C2 H2 = C2 H2 /(CH4 +C2 H4 +C2 H2 ) x 100 Sections within the triangle designate: Zone INDICATION T1 Thermal fault ≤300˚C T2 Thermal fault >300˚C, ≤700˚C T3 Thermal fault >700˚C D1 Discharges of low-energy D2 Discharges of high-energy DT Combination of thermal faults and discharges PD Partial discharge Note: Ratio based diagnostic tools should be calculated only if at least one of the gas values is above typical concentration values and typical rates of change for the type of equipment. Indications obtained should be viewed only as guidance and any resulting action should be undertaken only with proper engineering judgment. PRACTICING DGA ©2006 Serveron Corporation. All rights reserved.