
Recommandé
Contenu connexe
Tendances
Tendances (20)
En vedette
En vedette (18)
Similaire à Project management
Similaire à Project management (20)
Dernier
Dernier (20)
Project management
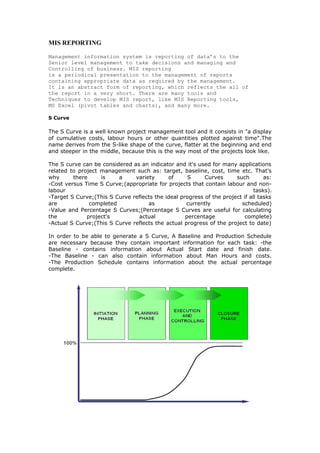
- 1. MIS REPORTING Management information system is reporting of data’s to the Senior level management to take decisions and managing and Controlling of business. MIS reporting is a periodical presentation to the management of reports containing appropriate data as required by the management. It is an abstract form of reporting, which reflects the all of the report in a very short. There are many tools and Techniques to develop MIS report, like MIS Reporting tools, MS Excel (pivot tables and charts), and many more. S Curve The S Curve is a well known project management tool and it consists in "a display of cumulative costs, labour hours or other quantities plotted against time".The name derives from the S-like shape of the curve, flatter at the beginning and end and steeper in the middle, because this is the way most of the projects look like. The S curve can be considered as an indicator and it's used for many applications related to project management such as: target, baseline, cost, time etc. That's why there is a variety of S Curves such as: -Cost versus Time S Curve;(appropriate for projects that contain labour and non-labour tasks). -Target S Curve;(This S Curve reflects the ideal progress of the project if all tasks are completed as currently scheduled) -Value and Percentage S Curves;(Percentage S Curves are useful for calculating the project's actual percentage complete) -Actual S Curve;(This S Curve reflects the actual progress of the project to date) In order to be able to generate a S Curve, A Baseline and Production Schedule are necessary because they contain important information for each task: -the Baseline - contains information about Actual Start date and finish date. -The Baseline - can also contain information about Man Hours and costs. -The Production Schedule contains information about the actual percentage complete.
- 2. There are some software scheduling packages that generate automatically S Curves. For example MS Project does not have this possibility so a third party software application is needed to process the Baseline and Production Schedule data and generate the needed S Curve.( for example S Curve Generator that integrates with MS EXcel to generate S Curves). think 80% of the project work is completed in 40% of the total time while it’s the remaining 20% that takes 60% of the time. Those of you who ever had to manage a project will notice that the it starts very slow and then it picks up speed and you see a lot of progress being made everyday but suddenly towards the end it slows down again and you feel that your team has lost the zest or they are slacking behind. But is this not expected ? if you plot the progress of the project (% of feature completed with time), you will see it takes up a S-curve as below: Let me explain why initiation and closing is slow. During Initiation Initiation refers to the starting phase of the project when you receive the notification that the project has started. It needs to be understood that unlike race-course horses, developers cannot dash out the gate at full throttle towards the finish line. They have just been allocated and they don’t even know what the project is all about. Here are some reasons which will slow down the progress during the starting phase: Team Establishment This is not about allocation of people. The team goes through a whole stage of Forming- Storming-Norming-Performing (Bruce Tuckman). This duration of this cycle depends on both the size of the team as well as diversity of domains/specialization within the project. Ambiguity in Requirements From no documentation to hundreds of pages of requirements, but I am yet to see a requirement document that is understood exactly in the same way by all people. There are multiple round of discussion between the team members and with the client during which the progress seems frozen. Tools and Environment In certain cases the project is dependent on tools and environment which is hard to duplicate in our development environment. I once remember a search engine portal project that we were doing in which our job was to make some enhancements. The current system extensively based on XPATH queries and we lost 10 days in just setting up the system on our server. In another project we are doing, the client had four different versions of the same application and the application called files (PHP includes) from multiple versions. We had to set up a team of 3 people for 7 days just to clean up the code and set it up on our servers. During Closing Closing is the abyss between when a developer says the job is complete and when you say that the job is complete. Here is what happens: Product Integration Often we have to wait for days (or weeks) for simple things like Payment Gateway info, SSL Certificate or information from 3rd party vendors on proprietory systems (web services) that the system must be intergrated with. Sometimes, server does not supports parts of codes that we have written and upgradation of server or rework of code is required. Note: CMMI required all integration requirements and environment to be planned earlier but still, if your hosting company responds to request within 5 days then what are we supposed to do?
- 3. Defects As more features are added into the system, more bugs are also introduced. As the bug database takes a life of its own, there is a tendency to increase the mix of bugs to new client-valued functions being coded. The result is that the overall speed of the team is maintained but an increasing percentage of the effort is devoted toward fixing bugs or adding “bells and whistles” Enhancements Buy enhancement I am referring to all the things a developer had to do which he did not knew he will have to do when he started the project. This mostly comes in the form of – “Of course it was supposed to be there!” and with some luck we will be able to point back to requirement document and say “nope!”. The problem is that time is spent in these negotiations and discussions which would rather be spent on stabilizing the current set of features that the product already has. At the end, I remember what one client told me – “Project is like painting the wall – it’s the corners that take most of the time!” S-curves As might be expected, the foregoing factors have a considerable impact on total production especially as represented by the more familiar output or progress S-curves. A complete determination of the project status and projections to final completion for management action can perhaps best be tracked by an integrated cost/schedule system or technique known as "Earned Value and Performance Measurement" (Kerzner 1989). The earned value, i.e. the Budgeted Cost of Work Performed (BCWP), is determined at regular intervals during the course of the project. At the same time, the Actual Cost of Work Performed (ACWP) is also determined, and both are compared to the baseline plan which is the Budgeted Cost of Work Scheduled (BCWS). By presenting these results graphically as S-curves, the variances in cost and schedule can readily be seen, and by analyzing the results relative to the baseline plan S-curve, estimates can be made of anticipated variations at completion. The key elements of the technique are shown Earned Value Earned Value is an approach where you monitor the project plan, actual work and work-completed value to see if a project is on track. Earned Value indicates how much of the budget and time should have been spent, with regards to the amount of work done to date. The user guide for Microsoft Project 2003 defines Earned Value as, "a method for measuring project performance. It indicates how much of the budget should have been spent, in view of the amount of work done so far and the baseline cost for the task, assignment, or resources." Earned Value is also known as Performance Measurement, Management by Objectives, Budgeted Cost of Work Performed and Cost Schedule Control Systems. Current performance is the best indicator of future performance and therefore using trend data it is possible to forecast cost or schedule overruns at quite an early stage in a project.
- 4. Budget Cost of Work Scheduled (BCWS) – the spending plan; the dollars (or hours) planned for the effort. The cumulative planned expenditures would equal the total dollars budgeted for the effort for the specified time period. With EVM, the spending plan serves as a performance baseline for making predictions about cost and schedule variance and estimates of completion. · Actual Cost of Work Performed (ACWP) – actual spending; the cumulative actual expenditures on the effort viewed at regular intervals within the project duration. · Budgeted Cost of Work Performed (BCWP) – earned value, the measure of technical accomplishment; the cumulative budgeted value (dollars or hours) of work actually completed. It may be calculated as the sum of the values budgeted for the work packages actually completed, or calculated as the percent work complete multiplied by the planned cost of the project. Schedule variance BCWP – BCWS An indicator of how much a program is ahead of or behind schedule Cost variance BCWP - ACWP SPI (Schedule performance index) BCWP/ BCWS > 1 is good (ahead of schedule) CPI (Cost performance index) BCWP/ACWP > 1, means that the cost of completing the work is less than planned (good or sometimes bad). Having a CPI that is very high (in some cases, very high is only 1.2) may mean that the plan was too conservative, and thus a very high number may in fact not be good, as the CPI is being measured against a poor baseline. Management or the customer may be upset with the
- 5. planners as an overly conservative baseline ties up available funds for other purposes, and the baseline is also used for manpower planning. Budget at Completion (BAC) – sum total of the time-phased budget. Synonymous with “Performance Measurement Baseline”. Estimate to Complete (ETC) – A calculated value, in dollars or hours, that represents the cost of work required to complete remaining project tasks. ETC = BAC – BCWP. Estimate at Complete (EAC) – A calculated value, in dollars or hours, that represents the projected total final costs of work when completed. EAC = ACWP + ETC. Earned value management It is a project management technique for measuring project progress in an objective manner. Earned value (EV) management is an integrated system of project management and control that enables a Contractor and their customer to monitor the progress of a project in terms of integrated cost, schedule, and technical performance measures Earned Value WBS Work Breakdown Structure (WBS) is a hierarchical structure used to organise tasks for reporting schedules and tracking costs. In a project or contract, the WBS is developed by starting with the end objective and successively subdividing it into manageable components in terms of size, duration, and responsibility (e.g., systems, subsystems, components, tasks, subtasks, and work packages) which include all steps necessary to achieve the objective. Work Packages Work Packages are a small-defined set of tasks or activities that form part of an overall project scope, usually the lowest level of the Work Breakdown Structure. PERT PERT is a method to analyze the involved tasks in completing a given project, especially the time needed to complete each task, and identifying the minimum time needed to complete the total project. · Optimistic time (O): the minimum possible time required to accomplish a task, assuming everything proceeds better than is normally expected · Pessimistic time (P): the maximum possible time required to accomplish a task, assuming everything goes wrong (but excluding major catastrophes). · Most likely time (M): the best estimate of the time required to accomplish a task, assuming everything proceeds as normal. · Expected time (TE): the best estimate of the time required to accomplish a task, assuming everything proceeds as normal (the implication being that the expected time is the average time the task would require if the task were repeated on a number of occasions over an extended period of time). TE = (O + 4M + P) ÷ 6
- 6. · Float or Slack is the amount of time that a task in a project network can be delayed without causing a delay - Subsequent tasks – (free float) or Project Completion – (total float) · Critical Path: the longest possible continuous pathway taken from the initial event to the terminal event. It determines the total calendar time required for the project; and, therefore, any time delays along the critical path will delay the reaching of the terminal event by at least the same amount. · Critical Activity: An activity that has total float equal to zero. Activity with zero float does not mean it is on the critical path. · Lead time: the time by which a predecessor event must be completed in order to allow sufficient time for the activities that must elapse before a specific PERT event reaches completion. · Lag time: the earliest time by which a successor event can follow a specific PERT event. · Slack: the slack of an event is a measure of the excess time and resources available in achieving this event. Positive slack would indicate ahead of schedule; negative slack would indicate behind schedule; and zero slack would indicate on schedule.
- 7. · Float or Slack is the amount of time that a task in a project network can be delayed without causing a delay - Subsequent tasks – (free float) or Project Completion – (total float) · Critical Path: the longest possible continuous pathway taken from the initial event to the terminal event. It determines the total calendar time required for the project; and, therefore, any time delays along the critical path will delay the reaching of the terminal event by at least the same amount. · Critical Activity: An activity that has total float equal to zero. Activity with zero float does not mean it is on the critical path. · Lead time: the time by which a predecessor event must be completed in order to allow sufficient time for the activities that must elapse before a specific PERT event reaches completion. · Lag time: the earliest time by which a successor event can follow a specific PERT event. · Slack: the slack of an event is a measure of the excess time and resources available in achieving this event. Positive slack would indicate ahead of schedule; negative slack would indicate behind schedule; and zero slack would indicate on schedule.