1. OBJECTIVE: How do we graph inequalities?
Do Now
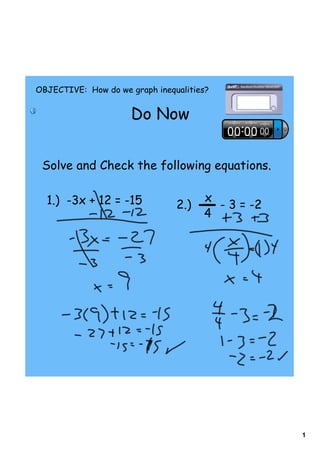
Solve and Check the following equations.
1.) -3x + 12 = -15 x
2.) - 3 = -2
4
1
2. Anticipatory Set
1.) What numbers could you substitute for the variable in this
mathematical sentence?
x>3
2.) What numbers can not be substituted for x?
x > 3 is an INEQUALITY- a mathematical sentence that contains
2
3. When an inequality contains a variable, any number that makes that
inequality true is a SOLUTION OF THE INEQUALITY.
In the example x > 3, any number larger than 3 is a SOLUTION TO
THE INEQUALITY.
3.) How would you show that on a number line?
3
4. Read over the examples to
the right and answer the
question below.
Based on the examples, how
do we graph an inequality?
4
5. 1.) a.) Graph the following inequality:
x<6
b.) List three solutions to the inequality.
5
6. 2.) a.) Graph the following inequality:
x ≤ -5
b.) List three solutions to the inequality.
6
7. Write the inequality for the following graph.
b.) List three solutions to the inequality.
7
8. b.) Write the inequality for the following graph.
b.) List three solutions to the inequality.
8
9. Before You Leave
Write an inequality from the following sentences.
Remember to define your variable.
1. No more than 18 people are allowed in the gallery at one time.
2. There are fewer than 8 fish in the aquarium.
3. The water level is at least 45 inches
9