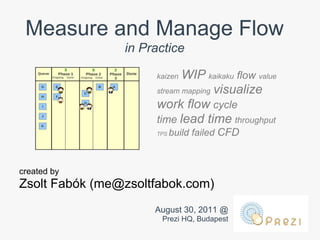
1. Measure and Manage Flow
in Practice
kaizen WIP kaikaku flow value
stream mapping visualize
work flow cycle
time lead time throughput
TPS build failed CFD
created by
Zsolt Fabók (me@zsoltfabok.com)
August 30, 2011 @
Prezi HQ, Budapest
2. Before saying anything:
"I promise not to exclude from consideration any idea based on its source,
but to consider ideas across schools and heritages in order to find the
ones that best suit the current situation." [1]
This means the end of statements like “That’s no good – it’s not
agile / object-oriented / pure / etc…”, but rather a discussion
about whether an idea (agile or plan-driven or impure or
whatever) works well in the conditions of the moment.
3. Since you are quite
experienced with visualize the
workflow measure and
Kanban, we'll skip the manage flow improve collaboratively
basics... limit
(using models & the scientific method)
the work in progress
(WIP) make process policies
explicit
...and get right to point. Only a
small CFD this time, because it
was discussed several times
before :-)
6. A couple of reasons
to wait so long:
hamster effect wrong
prioritisation weekend rush defects
slow builds manual builds
dependencies late integration no
cadence context
switching changing
requirements missing delivery
strategy favour only the left
side of the board
A couple of ideas to reduce it:
delivery cadence Little's law batching cost of delay prioritisation MMF task
oriented daily stand-up dynamic prioritisation mark ageing service level
agreement avatars explicit definition of done criteria
7. Measuring is very
easy
or
Additionally, the dates and
the strikes on the cards
are very good indicators as
well!
8. Favour periods over the whole flow
(please, don't hold it against me)
... period n-1* period n* Flow*
avg lead time 5 19 10
avg waiting time 78% 92% 95%
estimation precision 51% 78% 65%
throughput 3/12 0/10 42/60
back 3 13 26
* not real data
Their data tell more about the progress, than the data of the
whole Flow!
9. There are traps out there, so be careful
Sufficient planning requires knowing
● the lead time, and
● the throughput
For example (based on real data):
Team1 has the following lead times for items of size 'L': 6, 6, 6, 22, 6, 3,
4, 4, 13, 2, 2, 4, 8, 6, 9, 14, 14, 15, 16, 2, 5, 33, 8
On the other hand
Team2 has the following lead times for all kind of items: 4, 4, 4, 4, 3, 2, 5,
5, 4, 4, 3, 4, 4, 3, 4, 4, 4, 3, 6, 3
I won't even try to plan using the lead times of Team1, it is
unhelpful, but Team2 is quite stable
10. There are traps out there, so be careful
The throughput is a tricky one. Teams usually report
how many work items they delivered during a period.
Let's say it is 12 (remember the table 2 slides ago).
But it doesn't say how many work items they closed
during the period. Closing an item means starting and
finishing it in the very same period
So instead of 12, report 3 / 12. It says so much more:
● the team was able to close and deliver 3 items, or
● there are too many left overs from the previous period
● etc.
11. The measure the flow principle has a
huge potential
For example I had the feeling that those work items
which are started near the weekend are being delivered
slower (longer lead times) than the others.
12. So, using the started and done dates from the work and
a small script I got the following chart (a lower bar
means a better result):
Note that I don't count weekends into the lead time, except for
support organisations
13. For further reference: the theory behind
Spent time
+ or
Age
waiting
effective work
cycle time (repetition!)
lead time
14. Thank you very much for your attention!
For more Kanban-related topics, check out my website:
http://zsoltfabok.com/
or follow me on twitter:
@ZsoltFabok

![Before saying anything:
"I promise not to exclude from consideration any idea based on its source,
but to consider ideas across schools and heritages in order to find the
ones that best suit the current situation." [1]
This means the end of statements like “That’s no good – it’s not
agile / object-oriented / pure / etc…”, but rather a discussion
about whether an idea (agile or plan-driven or impure or
whatever) works well in the conditions of the moment.](data:image/gif;base64,R0lGODlhAQABAIAAAAAAAP///yH5BAEAAAAALAAAAAABAAEAAAIBRAA7)