Kohinoor Teiko Hinjewadi Phase 2 Pune E-Brochure.pdf
De q1 13
1. Miami
• Inventory continued to drop, but
distressed inventory fell the fastest
The number of properties for sale fell
12.5% from the prior year quarter and
30% from 2 years ago. Total distressed
inventory fell 24.7% while non-distressed
inventory fell 8.7% from the prior year
quarter. Distressed inventory comprised
25.2% of total inventory, down from
30.5% in the same quarter last year.
• The number of sales expanded as
housing prices surged There were
4,940 sales in the first quarter, 7.2%
higher than in the same period last year.
All three price indicators increased just
over 19% over the same period.
• Properties sold more quickly and
with less negotiability The time to
sell a property averaged 64 days, 8 days
faster than in the same period last year.
The listing discount fell to 6.9% from 8.1%
over the same period as falling inventory
and rising sales accelerated the pace of
the market.
accounted for 37.8% of all sales, down from the
recent high water mark of 62.9% in the third
quarter of 2010. Median sales price, perhaps the
most reliable indicator for market trends, rose
19.4% to $210,100 from the prior year quarter.
Luxury real estate representing the top 10%
priced sales realized large gains, especially the
single family market rising 31.6% to $1,415,000
over the same period. The pace of the housing
market has greatly accelerated. The number
of total listings available for sale fell 12.5% to
The housing market of the Miami coastal
communities experienced sharply rising prices,
falling inventory, the lowest distressed market
share in more than 3 years, continued influx of
international demand and shorter marketing
times in the first quarter of 2013. Declining
inventory, rising sales and a declining distressed
market share have pressed the housing price
indicators up sharply. Distressed market share
that is comprised of short sales and foreclosures,
10,990 while the number of sales expanded
7.2% to 4,940 from the prior year quarter. The
absorption rate, the number of months to sell all
inventory at the current pace of sales, fell to 6.7
months from 8.2 months. Days on market, the
number of days from the last list price change
to contract date fell to 64 days from 72 days
in the prior year quarter. Listing discount, the
percentage difference between the original list
price and contract price, fell to 6.9% from 8.1%
over the same period.
Quarterly Average Sales Price MIAMI
CONDOS
Number of Sales
Median Sales Price No. of Sales
0
1,000
2,000
3,000
4,000
5,000
$100,000
$120,000
$140,000
$160,000
$180,000
$200,000
1Q 134Q 123Q 122Q 121Q 12
SINGLE FAMILY
Median Sales Price No. of Sales
0
500
1,000
1,500
2,000
2,500
$150,000
$170,000
$190,000
$210,000
$230,000
$250,000
1Q 134Q 123Q 122Q 121Q 12
Median Sales Price No. of Sales
500
1,000
1,500
2,000
2,500
$230,000
$250,000
$270,000
$290,000
$310,000
Median Sales Price No. of Sales
300
600
900
1,200
1,500
$270,000
$290,000
$310,000
$330,000
$350,000
0
1,000
2,000
3,000
4,000
5,000
6,000
7,000
$0
$100,000
$200,000
$300,000
$400,000
$500,000
$600,000
$700,000
1312111009080706
English
NON-DISTRESSEDNON-DISTRESSED CONDOS
SINGLE FAMILY
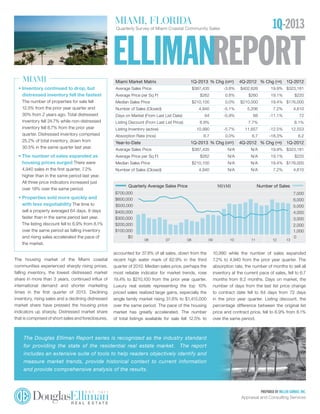
Quarterly Survey of Miami Coastal Community Sales
MIAMI, Florida 1Q-2013
Miami Market Matrix 1Q-2013 % Chg (qrt) 4Q-2012 % Chg (yr) 1Q-2012
Average Sales Price $387,435 -3.8% $402,626 19.9% $323,181
Average Price per Sq Ft $262 0.8% $260 19.1% $220
Median Sales Price $210,100 0.0% $210,000 19.4% $176,000
Number of Sales (Closed) 4,940 -5.1% 5,206 7.2% 4,610
Days on Market (From Last List Date) 64 -5.9% 68 -11.1% 72
Listing Discount (From Last List Price) 6.9% 7.7% 8.1%
Listing Inventory (active) 10,990 -5.7% 11,657 -12.5% 12,553
Absorption Rate (mos) 6.7 0.0% 6.7 -18.3% 8.2
Year-to-Date 1Q-2013 % Chg (qrt) 4Q-2012 % Chg (yr) 1Q-2012
Average Sales Price $387,435 N/A N/A 19.9% $323,181
Average Price per Sq Ft $262 N/A N/A 19.1% $220
Median Sales Price $210,100 N/A N/A 19.4% $176,000
Number of Sales (Closed) 4,940 N/A N/A 7.2% 4,610
The Douglas Elliman Report series is recognized as the industry standard
for providing the state of the residential real estate market. The report
includes an extensive suite of tools to help readers objectively identify and
measure market trends, provide historical context to current information
and provide comprehensive analysis of the results.
Prepared by Miller Samuel Inc.
Appraisal and Consulting Services
2. Single Family
Condos
Quarterly Average Sales Price MIA
CONDOS
Median Sales Price No. of Sales
0
1,000
2,000
3,000
4,000
5,000
$100,000
$120,000
$140,000
$160,000
$180,000
$200,000
1Q 134Q 123Q 122Q 121Q 12
SINGLE FAMILY
Median Sales Price No. of Sales
0
500
1,000
1,500
2,000
2,500
$150,000
$170,000
$190,000
$210,000
$230,000
$250,000
1Q 134Q 123Q 122Q 121Q 12
Median Sales Price No. of Sales
0
500
1,000
1,500
2,000
2,500
$210,000
$230,000
$250,000
$270,000
$290,000
$310,000
1Q 134Q 123Q 122Q 121Q 12
Median Sales Price No. of Sales
0
500
1,000
1,500
2,000
2,500
$70,000
$80,000
$90,000
$100,000
$110,000
$120,000
1Q 134Q 123Q 122Q 121Q 12
$0
$100,000
$200,000
$300,000
$400,000
$500,000
$600,000
$700,000
09080706
English
DISTRESSED
NON-DISTRESSED CONDOS
CONDOS
• Inventory declined nominally from
prior year levels yet prices jumped
The number of active condo listings
slipped 0.5% to 7,588 from the prior year
levels. Median sales price rose 20.4% to
$194,500 over the same period. Average
sales price and average price per square
foot showed a similar pattern.
• The number of sales edged higher
as property sold more quickly
The number of sales posted a modest
3.3% increase to 3,097 from the same
period last year. Days on market dropped
by 15.3% to 61 days over the same period.
• Condo days on market remained
low as prices jumped Days on market
slipped by 2 days to 48 days as median
sales price surged 16.8% to $1,150,000
from the prior year quarter. The luxury
market threshold started at $730,000,
20.7% above prior year levels.
• Single family threshold expanded
as prices outpaced the overall
market Median sales price was
$1,415,000, 31.6% higher than prior year
levels. The entry threshold began at
$850,000, 18.1% above last year.
• Listing inventory down sharply as
sales jumped There were 3,402 listings
at the end of the first quarter, 30.9%
below the same period last year and
47.7% below the same period 2 years ago.
Over the past year, the number of sales
expanded by 14.3% to 1,843 driving the
absorption rate to 5.5 months compared
to 9.2 months in the first quarter of 2012.
• All price indicators were well above
prior year levels as larger sales
gained share Median sales price
increased 17.5% to $235,000 from the
same period last year. The market share
for 5+ bedrooms increased to 13.4% from
10.1% over the same period.
Luxury
Note: This sub-category is the analysis of the top ten percent of all sales. The data is also contained within the other markets presented.
Condo Market Matrix 1Q-2013 % Chg (qrt) 4Q-2012 % Chg (yr) 1Q-2012
Average Sales Price $357,497 -1.3% $362,153 19.7% $298,751
Average Price Per Sq Ft $302 2.0% $296 22.3% $247
Median Sales Price $194,500 2.4% $190,000 20.4% $161,500
Number of Sales 3,097 -2.5% 3,178 3.3% 2,997
Days on Market (From Last List Date) 61 -7.6% 66 -15.3% 72
Listing Discount (From Last List Price) 6.7% 6.4% 7.3%
Listing Inventory (active) 7,588 4.9% 7,232 -0.5% 7,627
Absorption Rate (mos) 7.4 8.8% 6.8 -2.6% 7.6
Single Family Market Matrix 1Q-2013 % Chg (qrt) 4Q-2012 % Chg (yr) 1Q-2012
Average Sales Price $437,744 -6.1% $466,050 18.8% $368,573
Average Price Per Sq Ft $195 -3.9% $203 15.4% $169
Median Sales Price $235,000 0.6% $233,500 17.5% $200,000
Number of Sales 1,843 -9.1% 2,028 14.3% 1,613
Days on Market (From Last List Date) 69 -1.4% 70 -4.2% 72
Listing Discount (From Last List Price) 7.2% 9.7% 9.5%
Listing Inventory (active) 3,402 -23.1% 4,425 -30.9% 4,926
Absorption Rate (mos) 5.5 -15.4% 6.5 -40.2% 9.2
Luxury Market Matrix - Condos 1Q-2013 % Chg (qrt) 4Q-2012 % Chg (yr) 1Q-2012
Average Sales Price $1,571,329 -5.3% $1,659,694 18.5%$1,325,779
Average Price Per Square Foot $695 -0.6% $699 21.1% $574
Median Sales Price $1,150,000 -2.5% $1,180,000 16.8% $985,000
Number of Sales 309 -2.5% 317 3.0% 300
Days on Market (From Last List Date) 48 -2.0% 49 -4.0% 50
Listing Discount (From Last List Price) 9.6% 8.4% 9.1%
Luxury Market Matrix - Single Family 1Q-2013 % Chg (qrt) 4Q-2012 % Chg (yr) 1Q-2012
Average Sales Price $2,024,799 -13.2% $2,333,400 15.4% $1,754,972
Average Price Per Square Foot $444 -11.4% $501 9.9% $404
Median Sales Price $1,415,000 1.1% $1,400,000 31.6% $1,075,000
Number of Sales 184 -9.4% 203 14.3% 161
Days on Market (From Last List Date) 55 5.8% 52 5.8% 52
Listing Discount (From Last List Price) 9.6% 14.6% 12.9%
Size Med. Sales Price % Chg (yr)
Studio $150,000 32.7%
1-bedroom $174,900 39.9%
2-bedroom $222,065 13.0%
3-bedroom $215,000 2.4%
4-bedroom $215,000 -37.7%
5-bedroom $1,862,500 -31.0%
Size Med. Sales Price % Chg (yr)
1-bedroom $145,000 413.3%
2-bedroom $125,000 13.6%
3-bedroom $195,450 21.4%
4-bedroom $276,000 15.0%
5-bedroom $775,000 1.6%
The Elliman Report • Quarterly Survey of Miami Coastal Community Sales1Q-2013
Visit our website to browse listings and learn more about market trends
3. Downtown Market Matrix (Condos) 1Q-2013 % Chg (qrt) 4Q-2012 % Chg (yr) 1Q-2012
Average Sales Price $211,114 -3.3% $218,406 21.0% $174,511
Average Price per Sq Ft $186 -2.6% $191 22.4% $152
Median Sales Price $131,000 4.0% $126,000 20.7% $108,500
Number of Sales (Closed) 1,608 -6.1% 1,713 2.6% 1,568
Downtown Market Matrix (Single Family) 1Q-2013 % Chg (qrt) 4Q-2012 % Chg (yr) 1Q-2012
Average Sales Price $252,032 2.5% $245,792 23.2% $204,514
Average Price per Sq Ft $126 4.1% $121 20.0% $105
Median Sales Price $199,900 5.2% $190,000 17.6% $170,000
Number of Sales (Closed) 1,458 -7.6% 1,578 13.0% 1,290
South Beach
Miami Beach
Downtown
South
• Condo prices continued to surge as
sales edged higher Median sales price
was up 20.7% over prior year quarter. Sales
rose 2.6% over the same period.
• Single family sales jumped while prices
rose sharply Number of sales up 13%,
while median sales price rose 17.6% from
the prior year quarter.
North
Note: This region includes Aventura, Bal Harbour, Bay Harbor Islands, Golden Beach, Indian Creek, North Bay Village, Sunny Isles and
Surfside. The data is also contained within the other markets presented.
Note: This region includes area within the 33139 zip code and the 33140 zip code with northern boundary of 30th Street. The data is also
contained within the other markets presented.
Note: This region includes area defined by Miami MLS as “Miami”. The data is also contained within the other markets presented.
Note: This region includes Miami Beach, Fisher Island and Key Biscayne. The data is also contained within the other markets presented.
Note: This region includes Coconut Grove, Coral Gables, Palmetto Bay, Pinecrest and South Miami. The data is also contained within the
other markets presented.
• Condo and single family sales
declined from prior year levels Condo
sales slipped 1.1% but single family sales
dropped 16.7% from the prior year quarter.
• Condo price indicators rose faster
than single family Median sales price
for condos and single families increased
31.1% and 1.9% from prior year levels.
• Condo price indicators continued to
rise as sales edged higher Median sales
price increased 4.3% as the number of sales
expanded 3.1% from the prior year quarter.
• Single family price indicators trended
higher as sales rose Number of sales
increased 29.4% and median sales price
rose 8.7% from the prior year quarter.
• After large gains in the prior quarter,
condo sales and prices slipped
Median sales price declined 3.8% and
sales fell 6.8% from the prior year period.
• Single family sales continued to surge
Number of sales surged 21.2% as median
sales price increased 8% from the prior
year levels.
North Market Matrix (Condos) 1Q-2013 % Chg (qrt) 4Q-2012 % Chg (yr) 1Q-2012
Average Sales Price $477,999 10.7% $431,797 29.2% $370,104
Average Price per Sq Ft $328 9.3% $300 26.2% $260
Median Sales Price $295,000 9.3% $270,000 31.1% $225,000
Number of Sales (Closed) 628 -5.1% 662 -1.1% 635
North Market Matrix (Single Family) 1Q-2013 % Chg (qrt) 4Q-2012 % Chg (yr) 1Q-2012
Average Sales Price $1,131,730 -36.5% $1,782,996 11.1%$1,018,344
Average Price per Sq Ft $396 -27.9% $549 14.5% $346
Median Sales Price $815,000 6.5% $765,500 1.9% $800,000
Number of Sales (Closed) 35 25.0% 28 -16.7% 42
Miami Beach Market Matrix (Condos) 1Q-2013 % Chg (qrt) 4Q-2012 % Chg (yr) 1Q-2012
Average Sales Price $543,693 -10.1% $605,106 5.5% $515,534
Average Price per Sq Ft $459 2.0% $450 12.5% $408
Median Sales Price $302,500 -5.2% $319,000 4.3% $290,000
Number of Sales (Closed) 328 0.3% 327 3.1% 318
Miami Beach Market Matrix (Single Family) 1Q-2013 % Chg (qrt) 4Q-2012 % Chg (yr) 1Q-2012
Average Sales Price $1,422,211 -42.6% $2,479,632 12.6%$1,263,471
Average Price per Sq Ft $461 -31.3% $671 12.2% $411
Median Sales Price $942,000 -25.4% $1,263,500 8.7% $867,000
Number of Sales (Closed) 66 -2.9% 68 29.4% 51
South Beach Market Matrix (Condos) 1Q-2013 % Chg (qrt) 4Q-2012 % Chg (yr) 1Q-2012
Average Sales Price $612,923 -10.3% $683,676 20.7% $507,662
Average Price per Sq Ft $649 -2.6% $666 22.7% $529
Median Sales Price $280,000 1.8% $275,000 12.0% $250,000
Number of Sales (Closed) 410 10.2% 372 19.2% 344
South Beach Market Matrix (Single Family) 1Q-2013 % Chg (qrt) 4Q-2012 % Chg (yr) 1Q-2012
Average Sales Price $3,026,190 11.3% $2,720,111 84.8%$1,637,863
Average Price per Sq Ft $692 -8.5% $756 40.9% $491
Median Sales Price $2,400,000 3.5% $2,319,000 134.1%$1,025,000
Number of Sales (Closed) 21 16.7% 18 61.5% 13
South Market Matrix (Condos) 1Q-2013 % Chg (qrt) 4Q-2012 % Chg (yr) 1Q-2012
Average Sales Price $308,012 -17.3% $372,548 -15.5% $364,630
Average Price per Sq Ft $257 2.4% $251 -0.8% $259
Median Sales Price $230,000 -14.8% $270,000 -3.8% $239,000
Number of Sales (Closed) 123 18.3% 104 -6.8% 132
South Market Matrix (Single Family) 1Q-2013 % Chg (qrt) 4Q-2012 % Chg (yr) 1Q-2012
Average Sales Price $921,192 6.8% $862,467 -1.1% $931,727
Average Price per Sq Ft $297 6.1% $280 -1.7% $302
Median Sales Price $588,500 4.3% $564,000 8.0% $545,000
Number of Sales (Closed) 263 -21.7% 336 21.2% 217
The Elliman Report • Quarterly Survey of Miami Coastal Community Sales 1Q-2013
• Double-digit price and sales growth
for condos The number of sales jumped
19.2% and median sales price expanded
12% from the prior year quarter.
• Single family price indicators up
sharply Median sales price more than
doubled and average sales price was up
84.8% from the prior year quarter.
Visit our website to browse listings and learn more about market trends