Contenu connexe
Similaire à Chapter 16analisis costo efectividad
Similaire à Chapter 16analisis costo efectividad (20)
Plus de federicoblanco (16)
Chapter 16analisis costo efectividad
- 1. Chapter 16 Economic Analysis in the Service Sector
Cost-Effectiveness Analysis
16.1 Cost effectiveness of the alternatives
Type of Treatment Cost Effectiveness
Antibiotic A 12,000/75 =160
Antibiotic B 168.75
Antibiotic C 180.49
∴ The best treatment option is Antibiotic A.
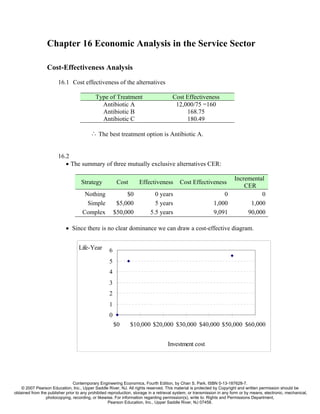
16.2
• The summary of three mutually exclusive alternatives CER:
Incremental
Strategy Cost Effectiveness Cost Effectiveness
CER
Nothing $0 0 years 0 0
Simple $5,000 5 years 1,000 1,000
Complex $50,000 5.5 years 9,091 90,000
• Since there is no clear dominance we can draw a cost-effective diagram.
Life-Year 6
5
4
3
2
1
0
$0 $10,000 $20,000 $30,000 $40,000 $50,000 $60,000
Investment cost
Contemporary Engineering Economics, Fourth Edition, by Chan S. Park. ISBN 0-13-187628-7.
© 2007 Pearson Education, Inc., Upper Saddle River, NJ. All rights reserved. This material is protected by Copyright and written permission should be
obtained from the publisher prior to any prohibited reproduction, storage in a retrieval system, or transmission in any form or by means, electronic, mechanical,
photocopying, recording, or likewise. For information regarding permission(s), write to: Rights and Permissions Department,
Pearson Education, Inc., Upper Saddle River, NJ 07458.
- 2. Budget Available ($) Treatment Option To Be Implemented
Less than $5,000 As much of Simple treatment as budget
allows
$5,000 100% of Simple treatment
$5,000 - $50,000 Simple treatment and as much of
Complex treatment as budget allows
$50,000 or larger 100% of Complex treatment
Valuation of Benefits and Costs
16.3
(a) • User’s benefits:
- Prevention (or retardation) of highway corrosion: resulting in lower highway
maintenance cost. This lower maintenance cost implies lower users’ taxes
on gasoline, and so forth.
- Prevention of rust on vehicles: resulting in lower repair and maintenance
costs and higher resale value of vehicles.
- Prevention of corrosion to utility lines and damages to water supplies:
resulting in lower utility rates.
- Prevention of damages to vegetation and soil surrounding areas: increasing
land values and agriculture yields.
• Users’ costs:
- Paying higher taxes.
- Unknown environmental damages due to using CMA
(b) The state of Michigan may declare certain sections of highway for
experimental purpose. CMA may be used exclusively for a designated area
and road salts for another area for an extended period time. Then, it
investigates the impact of CMA on vegetation yields, which can be compared
with those of areas from road salt use. The difference in vegetation yields may
be quantified in terms of market value, and so forth.
16.4 This is an open-end type question. (No solution is given.)
16.5 This is an open-end type question. (No solution is given.)
Contemporary Engineering Economics, Fourth Edition, by Chan S. Park. ISBN 0-13-187628-7.
© 2007 Pearson Education, Inc., Upper Saddle River, NJ. All rights reserved. This material is protected by Copyright and written permission should be
2
obtained from the publisher prior to any prohibited reproduction, storage in a retrieval system, or transmission in any form or by means, electronic, mechanical,
photocopying, recording, or likewise. For information regarding permission(s), write to: Rights and Permissions Department,
Pearson Education, Inc., Upper Saddle River, NJ 07458.
- 3. Benefit-Cost Analysis
16.6
(a) BC (i ) analysis:
• Design A:
I = $400, 000
C ' = $50, 000( P / A,8%,15) = $427,974
B = $85, 000
• Design B:
I = $300, 000
C ' = $80, 000( P / A,8%,15) = $684, 758
B = $85, 000
• Incremental analysis: Fee collections in the amount of $85,000 will be the
same for both alternatives. Therefore, we will not be able to compute the
BC (i ) ratio. If this happens, we may select the best alternative based on either
the lease cost ( I + C ' ) criterion or the incremental B 'C (i ) criterion. Using the
B 'C (i ) criterion,
∆B − ∆C ' 0 − ($427,974 − $684, 758)
∆B C (8%) A− B
'
= = = 2.56 > 1
∆I $100, 000
∴Select design A.
(b) Incremental analysis (A – C):
∆B − ∆C ' 0 − ($427,974 − $556,366)
∆B 'C (8%) A−C = = = 2.57 > 1
∆I $50, 000
∴Select design A.
16.7
• Building X:
BX = $1,960, 000( P / A,10%, 20) = $16, 686, 656
C X = $8, 000, 000 + $240, 000( P / A,10%, 20)
− $4,800, 000( P / F ,10%, 20)
= $9,329,984
$16, 686, 656
BC (10%) X = = 1.79 > 1
$9,329,984
Contemporary Engineering Economics, Fourth Edition, by Chan S. Park. ISBN 0-13-187628-7.
© 2007 Pearson Education, Inc., Upper Saddle River, NJ. All rights reserved. This material is protected by Copyright and written permission should be
3
obtained from the publisher prior to any prohibited reproduction, storage in a retrieval system, or transmission in any form or by means, electronic, mechanical,
photocopying, recording, or likewise. For information regarding permission(s), write to: Rights and Permissions Department,
Pearson Education, Inc., Upper Saddle River, NJ 07458.
- 4. • Building Y:
BY = $1,320, 000( P / A,10%, 20) = $11, 237,952
CY = $12, 000, 000 + $180, 000( P / A,10%, 20)
− $7, 200, 000( P / F ,10%, 20)
= $12, 462,528
$11, 237,904
BC (10%)Y = = 0.90 < 1
$12, 462,528
Since Building Y is not desirable at the outset, we don’t need to conduct an
incremental analysis. Building X becomes the better choice.
16.8 Incremental BC (i ) analysis:
Present Proposals Incremental
Worth A1 A2 A3 A3-A1 A2-A1
I $100 $300 $200 $100 $200
B $400 $700 $500 $100 $300
C $100 $200 $150 $50 $100
BC (i ) 2 1.4 1.43 0.67 1
∴ Select either A1 or A2.
16.9 Incremental BC (i ) analysis
Present Design Incremental
Worth A B C C-B A-B
I $7,284 $7,070 $5,656 -$1,414 $754
B $2,440 $880 $1,600 $720 $1,560
C’ $3,865 $3,394 $2,922 -$472 $471
BC (i ) 1.24 1.65 1.25 -5.7 0.37
∴ Select Design B
Contemporary Engineering Economics, Fourth Edition, by Chan S. Park. ISBN 0-13-187628-7.
© 2007 Pearson Education, Inc., Upper Saddle River, NJ. All rights reserved. This material is protected by Copyright and written permission should be
4
obtained from the publisher prior to any prohibited reproduction, storage in a retrieval system, or transmission in any form or by means, electronic, mechanical,
photocopying, recording, or likewise. For information regarding permission(s), write to: Rights and Permissions Department,
Pearson Education, Inc., Upper Saddle River, NJ 07458.
- 5. 16.10
(a) The benefit-cost ratio for each alternative:
• Alternative A:
B = ($1, 000, 000 + $250, 000 + $350, 000 + $100, 000)( P / A,10%,50)
= $16,855,185
C = $8, 000, 000 + $200, 000( P / A,10%,50)
= $9,982,963
$16,855,185
BC (10%) A = = 1.69 > 1
$9,982,963
• Alternative B:
B = ($1, 200, 000 + $350, 000 + $450, 000 + $200, 000)( P / A,10%,50)
= $21,812,592
C = $10, 000, 000 + $250, 000( P / A,10%,50)
= $12, 478, 704
$21,812,592
BC (10%) B = = 1.75 > 1
$12, 478, 704
• Alternative C:
B = ($1,800, 000 + $500, 000 + $600, 000 + $350, 000)( P / A,10%,50)
= $32, 223,147
C = $15, 000, 000 + $350, 000( P / A,10%,50)
= $18, 470,185
$32, 223,147
BC (10%) B = = 1.74 > 1
$18, 470,185
(b) Select the best alternative based on BC (i ) :
$21,812,592 − $16,855,185
BC (10%) B − A =
$12, 478, 704 − $9,982,963
= 1.99 > 1 ( Select B )
$32, 223,147 − $21,812,592
BC (10%)C − B =
$18, 470,185 − $12, 478, 704
= 1.74 > 1 ( Select C )
Comments: You could select the best alternative based on B 'C (i ) :
Contemporary Engineering Economics, Fourth Edition, by Chan S. Park. ISBN 0-13-187628-7.
© 2007 Pearson Education, Inc., Upper Saddle River, NJ. All rights reserved. This material is protected by Copyright and written permission should be
5
obtained from the publisher prior to any prohibited reproduction, storage in a retrieval system, or transmission in any form or by means, electronic, mechanical,
photocopying, recording, or likewise. For information regarding permission(s), write to: Rights and Permissions Department,
Pearson Education, Inc., Upper Saddle River, NJ 07458.
- 6. Alternative
A B C
I $8,000,000 $10,000,000 $15,000,000
C’ $1,982,963 $2,478,704 $3,470,185
'
B C (i ) 1.86 1.93 1.92
($21,812,592 − $16,855,185) − ($2, 478, 704 − $1,982,963)
B 'C (10%) B − A =
$10, 000, 000 − $8, 000, 000
= 2.23 > 1 ( Select B )
($32, 223,147 − $21,812,592) − ($3, 470,185 − $2, 478, 704)
B 'C (10%)C − B =
$15, 000, 000 − $10, 000, 000
= 1.88 > 1 ( Select C )
16.11
• Option 1 – The “long” route:
user's annual cost = 22 miles × $0.25 per mile × 400,000 cars
= $2, 200, 000
sponsor's annual cost = $21, 000, 000( A / P,10%, 40) + $140, 000
= $2, 287, 448
• Option 2 – Shortcut:
user's annual cost = 10 miles × $0.25 per mile × 400,000 cars
= $1, 000, 000
sponsor's annual cost = $45, 000, 000( A / P,10%, 40) + $165, 000
= $4, 766, 674
• Incremental analysis (Option 2 - Option 1):
Incremental user's benefit = $2, 200, 000 − $1, 000, 000
= $1, 200, 000
$1, 200, 000
BC (10%) 2 −1 =
$4, 766, 674 − $2, 287, 448
= 0.48 < 1
∴ Assuming that there is no do-nothing alternative, select option 1.
Contemporary Engineering Economics, Fourth Edition, by Chan S. Park. ISBN 0-13-187628-7.
© 2007 Pearson Education, Inc., Upper Saddle River, NJ. All rights reserved. This material is protected by Copyright and written permission should be
6
obtained from the publisher prior to any prohibited reproduction, storage in a retrieval system, or transmission in any form or by means, electronic, mechanical,
photocopying, recording, or likewise. For information regarding permission(s), write to: Rights and Permissions Department,
Pearson Education, Inc., Upper Saddle River, NJ 07458.
- 7. 16.12
• Multiple alternatives:
Projects PW of Benefits PW of Costs Net PW B/C ratio
A1 $40 $85 -$45 0.47
A2 $150 $110 $40 1.36
A3 $70 $25 $45 2.80
A4 $120 $73 $47 1.64
Since the BC ratio for project A1 is less than 1, we delete it from our comparison.
• Incremental analysis
A3 vs. A4:
$120 − $70
BC (10%) A 4− A3 =
$73 − $25
= 1.04 > 1
Select A4
A2 vs. A4:
$150 − $120
BC (10%) A2− A4 =
$110 − $73
= 0.81 < 1
Select A4
Short Case Studies
ST 16.1 Capital allocation decision, assuming that the government will be able to
raise the required funds at 10% interest:
District Project PW(10%) Investment
1. 27th Street $1,606,431 $980,000
2. Holden Avenue $3,438,531 $3,500,000
I
3. Forest City Road $2,682,758 $2,800,000
4. Fairbanks Avenue $2,652,473 $1,400,000
5. Oak Ridge Road $1,672,473 $2,380,000
6. University Blvd. $5,258,050 $5,040,000
II
7. Hiawassee Road $4,130,824 $2,520,000
8. Lake Avenue $2,958,052 $4,900,000
III 9. Apopka-Ocoee Road $552,475 $1,365,000
10. Kaley Avenue $4,459,032 $2,100,000
Contemporary Engineering Economics, Fourth Edition, by Chan S. Park. ISBN 0-13-187628-7.
© 2007 Pearson Education, Inc., Upper Saddle River, NJ. All rights reserved. This material is protected by Copyright and written permission should be
7
obtained from the publisher prior to any prohibited reproduction, storage in a retrieval system, or transmission in any form or by means, electronic, mechanical,
photocopying, recording, or likewise. For information regarding permission(s), write to: Rights and Permissions Department,
Pearson Education, Inc., Upper Saddle River, NJ 07458.
- 8. 11.Apopka-Vineland Road $1,166,557 $1,170,000
12. Washington Street $1,788,245 $1,120,000
13. Mercy Drive $5,066,566 $2,800,000
14. Apopka Road $2,338,635 $1,690,000
IV
15. Old Dixie Highway $1,213,846 $975,000
16. Old Apopka Road $1,899,946 $1,462,500
(a) $6 million to each district:
District Projects NPW
I 1,2,4 $7,697,488
II 5,7 $5,803,297
III 9,10,11,12 $5,966,309
IV 13,14,16 $9,305,147
(b) $15 million to districts I & II and $9 million to districts III & IV:
District Projects NPW Investment
I & II 2,4,5,6,7 $17,152,400 $14,840,000
III & IV 10,12,13,14,15 $12,866,320 $8,685,000
(c) If $24 million were allocated based on project merit alone, the optimal solution
would be:
Total investment = $23,587,500
Total net present value = $31,852,543
Projects selected = 1, 2, 4, 6, 7, 10, 12, 13, 14, 15, 16
ST 16.2 Given i = 8% , g = 10% , garbage amount/day = 300 tons
(a) The operating cost of the current system in terms of $/ton of solid waste:
• Annual garbage collection required (assuming 365 days):
Total amount of garbage = 300 tons × 365 days
= 109,500 tons
• Equivalent annual operating and maintenance cost:
PW (8%) = $905, 400( P / A1 ,10%,8%, 20)
= $20, 071,500
AEC (8%) = $20, 071,500( A / P,8%, 20)
= $2, 044,300
Contemporary Engineering Economics, Fourth Edition, by Chan S. Park. ISBN 0-13-187628-7.
© 2007 Pearson Education, Inc., Upper Saddle River, NJ. All rights reserved. This material is protected by Copyright and written permission should be
8
obtained from the publisher prior to any prohibited reproduction, storage in a retrieval system, or transmission in any form or by means, electronic, mechanical,
photocopying, recording, or likewise. For information regarding permission(s), write to: Rights and Permissions Department,
Pearson Education, Inc., Upper Saddle River, NJ 07458.
- 9. • Operating cost per ton:
$2,044,300
cost per ton= =$18.67/ton
109,500
(b) The economics of each solid-waste disposal alternative in terms of $/ton:
• Site 1:
AEC (8%)1 = $4, 053, 000( A / P,8%, 20) + $342, 000 − ($13, 200 + $87, 600)
= $653, 000
$653,000
cost per ton= =$5.96/ton
109,500
• Site 2:
AEC (8%)2 = $4,384, 000( A / P,8%, 20) + $480, 000 − ($14, 700 + $99,300)
= $812,520
$812,520
cost per ton= =$7.42/ton
109,500
• Site 3:
AEC (8%)3 = $4, 764, 000( A / P,8%, 20) + $414, 000 − ($15,300 + $103,500)
= $780, 424
$780,424
cost per ton= =$7.13/ton
109,500
• Site 4:
AEC (8%)2 = $5, 454, 000( A / P,8%, 20) + $408, 000 − ($17,100 + $119, 400)
= $827, 000
$827,000
cost per ton= =$7.55/ton
109,500
∴ Site 1 is the most economical choice.
Contemporary Engineering Economics, Fourth Edition, by Chan S. Park. ISBN 0-13-187628-7.
© 2007 Pearson Education, Inc., Upper Saddle River, NJ. All rights reserved. This material is protected by Copyright and written permission should be
9
obtained from the publisher prior to any prohibited reproduction, storage in a retrieval system, or transmission in any form or by means, electronic, mechanical,
photocopying, recording, or likewise. For information regarding permission(s), write to: Rights and Permissions Department,
Pearson Education, Inc., Upper Saddle River, NJ 07458.
- 10. ST 16.3
(a) Let’s define the following variables to compute the equivalent annual cost.
Ala = initial land cost
Aeq = initial equipment cost
Ast = initial structure cost
Apu = initial pumping equipment cost
Aen = initial annual energy cost in today's dollars
Alb = initial annual labor cost in today's dollars
Aen = initial annual repair cost in today's dollars
• Land:
PW (10%)land = Ala − Ala (1.03 /1.1)120
= $0.99963 Ala
• Equipment: Let’s define the following additional variables.
I15 n = replacement cost in year 15n
S15 n = salvage value in year 15n
C15 n = net replacement cost in year 15n
where n = 1, 2, 3, 4, 5, 6, and 7
The total replacement cost over the analysis period is calculated as follows:
I15 = Aeq (1.05)15 = 2.07893 Aeq
S15 = 0.5 Aeq
C15 = (2.07893 − 0.5) Aeq = 1.57893 Aeq
C15 n = (1.57893 Aeq )(1.05)15( n −1)
S15 n = 0.5 Aeq (1.05)15 n
7
PW (10%)equipment = Aeq + ∑ C15 n − S120
n =1
7 (1.57893 Aeq )(1.05)15( n −1) 0.5 Aeq (1.05)120
= Aeq + ∑ −
n =1 (1.1)15 n (1.1)120
= 1.745 Aeq
Contemporary Engineering Economics, Fourth Edition, by Chan S. Park. ISBN 0-13-187628-7.
© 2007 Pearson Education, Inc., Upper Saddle River, NJ. All rights reserved. This material is protected by Copyright and written permission should be
10
obtained from the publisher prior to any prohibited reproduction, storage in a retrieval system, or transmission in any form or by means, electronic, mechanical,
photocopying, recording, or likewise. For information regarding permission(s), write to: Rights and Permissions Department,
Pearson Education, Inc., Upper Saddle River, NJ 07458.
- 11. • Structure:
⎡ 1 1 ⎤ 0.6 Ast
PW (10%) structure = Ast + (0.40) Ast ⎢ + −
⎣ (1.1)
40
(1.1)80 ⎥ (1.1)120
⎦
= 1.00902 Ast
• Pumping:
PW (10%) pumping = 1.745 Apu
• Energy:
120
PW (10%)energy = ∑ Aen (1.05 /1.1) j = 20.92302 Aen
j =1
• Labor:
120
PW (10%)labor = ∑ Alb (1.04 /1.1) j = 17.3113 Alb
j =1
• Repair:
120
PW (10%)repair = ∑ Are (1.02 /1.1) j = 12.748 Are
j =1
• Present worth of the life-cycle cost:
PW (10%) = 0.99963 Ala + 1.745 Aeq + 1.00902 Ast + 1.745 Apu
+ 20.92302 Aen + 17.3113 Alb + 12.748 Are
Option
Parameters
2 3 4 5
Ala $2,400,000 $49,000 $49,000 $400,000
Aeq $500,000 $500,000 $400,000 $175,000
Ast $700,000 $2,100,000 $2,463,000 $1,750,000
Apu $100,000 0 0 $100,000
Aen $200,000 $125,000 $100,000 $50,000
Alb $95,000 $65,000 $53,000 $37,000
Are $30,000 $20,000 $15,000 $5,000
PW(10%) $10,364,300 $7,036,290 $6,433,460 $4,395,790
AEC(10%) $1,036,440 $703,637 $643,353 $439,584
∴ Option 5 is the least cost alternative.
Contemporary Engineering Economics, Fourth Edition, by Chan S. Park. ISBN 0-13-187628-7.
© 2007 Pearson Education, Inc., Upper Saddle River, NJ. All rights reserved. This material is protected by Copyright and written permission should be
11
obtained from the publisher prior to any prohibited reproduction, storage in a retrieval system, or transmission in any form or by means, electronic, mechanical,
photocopying, recording, or likewise. For information regarding permission(s), write to: Rights and Permissions Department,
Pearson Education, Inc., Upper Saddle River, NJ 07458.
- 12. (b)
Cost / gallon = $439,584 / 2,000,000(365)
= $0.0006 per gallon
Monthly charge = (0.0006)(400)(30)
= $7.23 per month
ST 16.4
(a) Users benefits and disbenefits:
• Users’ benefits
(1) Reduced travel time.
(2) Reduced fuel consumption.
(3) Reduced air pollution.
(4) Reduced number of accidents.
• Users’ disbenefits: Increased automobile purchase and maintenance costs.
(b) Sponsor’s cost:
• Development costs associated with computerized dashboard navigational
systems, roadside sensors, and automated steering and speed controls.
• Implementation and maintenance costs.
• Public promotional and educational costs.
(c) On a national level, the sponsor’s costs are estimated to be as follows:
• R&D costs = $2.5 billion
• Implementation costs = $18 billion
• Maintenance costs = $4 billion per year
Comments: However, the users’ benefits are sketchy, except the level of
reduction possible in the area of travel time, fuel consumption, and air pollution.
Ask the students to quantify these in dollar terms by consulting various
government publications on public transportation. Once these figures are
estimated, the benefit-cost ratio can be easily derived.
Contemporary Engineering Economics, Fourth Edition, by Chan S. Park. ISBN 0-13-187628-7.
© 2007 Pearson Education, Inc., Upper Saddle River, NJ. All rights reserved. This material is protected by Copyright and written permission should be
12
obtained from the publisher prior to any prohibited reproduction, storage in a retrieval system, or transmission in any form or by means, electronic, mechanical,
photocopying, recording, or likewise. For information regarding permission(s), write to: Rights and Permissions Department,
Pearson Education, Inc., Upper Saddle River, NJ 07458.