abortion pills in Riyadh Saudi Arabia (+919707899604)cytotec pills in dammam
conoco phillips 2004Third Quarter
1. ConocoPhillips
Houston, Texas 77079
Preliminary
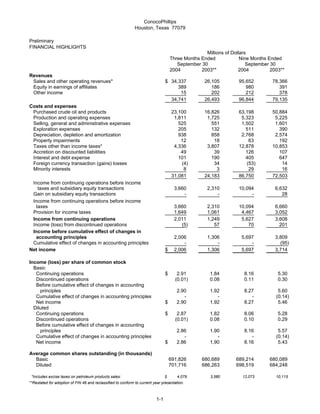
FINANCIAL HIGHLIGHTS
Millions of Dollars
Three Months Ended Nine Months Ended
September 30 September 30
2004 2003** 2004 2003**
Revenues
Sales and other operating revenues* $ 34,337 26,105 95,652 78,366
Equity in earnings of affiliates 389 186 980 391
Other income 15 202 212 378
34,741 26,493 96,844 79,135
Costs and expenses
Purchased crude oil and products 23,100 16,826 63,198 50,884
Production and operating expenses 1,811 1,725 5,323 5,225
Selling, general and administrative expenses 525 551 1,502 1,601
Exploration expenses 205 132 511 390
Depreciation, depletion and amortization 938 858 2,768 2,574
Property impairments 12 18 63 192
Taxes other than income taxes* 4,336 3,807 12,878 10,853
Accretion on discounted liabilities 49 39 126 107
Interest and debt expense 101 190 405 647
Foreign currency transaction (gains) losses (4) 34 (53) 14
Minority interests 8 3 29 16
31,081 24,183 86,750 72,503
Income from continuing operations before income
taxes and subsidiary equity transactions 3,660 2,310 10,094 6,632
Gain on subsidiary equity transactions - - - 28
Income from continuing operations before income
taxes 3,660 2,310 10,094 6,660
Provision for income taxes 1,649 1,061 4,467 3,052
Income from continuing operations 2,011 1,249 5,627 3,608
Income (loss) from discontinued operations (5) 57 70 201
Income before cumulative effect of changes in
accounting principles 2,006 1,306 5,697 3,809
Cumulative effect of changes in accounting principles - - - (95)
Net income $ 2,006 1,306 5,697 3,714
Income (loss) per share of common stock
Basic
Continuing operations $ 2.91 1.84 8.16 5.30
Discontinued operations (0.01) 0.08 0.11 0.30
Before cumulative effect of changes in accounting
principles 2.90 1.92 8.27 5.60
Cumulative effect of changes in accounting principles - - - (0.14)
Net income $ 2.90 1.92 8.27 5.46
Diluted
Continuing operations $ 2.87 1.82 8.06 5.28
Discontinued operations (0.01) 0.08 0.10 0.29
Before cumulative effect of changes in accounting
principles 2.86 1.90 8.16 5.57
Cumulative effect of changes in accounting principles - - - (0.14)
Net income $ 2.86 1.90 8.16 5.43
Average common shares outstanding (in thousands)
Basic 691,826 680,689 689,214 680,089
Diluted 701,716 686,263 698,519 684,248
*Includes excise taxes on petroleum products sales: $ 4,079 3,580 12,073 10,115
**Restated for adoption of FIN 46 and reclassified to conform to current year presentation.
1-1
2. ConocoPhillips
Houston, Texas 77079
Preliminary
SELECTED FINANCIAL DATA
Millions of Dollars
Three Months Ended Nine Months Ended
September 30 September 30
2004 2003 2004 2003
INCOME/(LOSS) FROM CONTINUING OPERATIONS
E&P
United States $ 701 546 2,007 1,741
International 719 421 2,024 1,428
Total E&P 1,420 967 4,031 3,169
Midstream 38 31 135 87
R&M
United States 505 416 1,642 939
International 203 69 348 256
Total R&M 708 485 1,990 1,195
Chemicals 81 7 166 (4)
Emerging Businesses (27) (18) (78) (75)
Corporate and other (209) (223) (617) (764)
Consolidated $ 2,011 1,249 5,627 3,608
CUMULATIVE EFFECT OF CHANGES IN
ACCOUNTING PRINCIPLES
E&P
United States $ - - - 142
International - - - -
Total E&P - - - 142
Midstream - - - -
R&M
United States - - - (125)
International - - - -
Total R&M - - - (125)
Chemicals - - - -
Emerging Businesses - - - -
Corporate and other - - - (112)
Consolidated $ - - - (95)
INCOME/(LOSS) FROM DISCONTINUED OPERATIONS
Corporate and other (5) 57 70 201
SUMMARY OF NET INCOME/(LOSS)
E&P
United States $ 701 546 2,007 1,883
International 719 421 2,024 1,428
Total E&P 1,420 967 4,031 3,311
Midstream 38 31 135 87
R&M
United States 505 416 1,642 814
International 203 69 348 256
Total R&M 708 485 1,990 1,070
Chemicals 81 7 166 (4)
Emerging Businesses (27) (18) (78) (75)
Corporate and other (214) (166) (547) (675)
Net income $ 2,006 1,306 5,697 3,714
1-2
3. ConocoPhillips
Houston, Texas 77079
Preliminary
SELECTED FINANCIAL DATA
Three Months Ended Nine Months Ended
September 30 September 30
2004 2003 2004 2003
INCOME FROM CONTINUING OPERATIONS
Effective tax rate % 45.1 % 45.9 44.3 45.8
Millions of Dollars
FOREIGN CURRENCY GAINS/(LOSSES)
AFTER-TAX
E&P $ (4) (12) 15 (28)
Midstream - - - -
R&M (5) (7) 1 4
Chemicals - - - -
Emerging Businesses (1) (1) - (1)
Corporate and other 15 2 21 21
$ 5 (18) 37 (4)
CASH FLOWS FROM OPERATING ACTIVITIES
Income from continuing operations $ 2,011 1,249 5,627 3,608
Depreciation, depletion and amortization 938 858 2,768 2,574
Property impairments 12 18 63 192
Dry hole costs and leasehold impairment 150 75 342 169
Accretion on discounted liabilities 49 39 126 107
Deferred income taxes 328 80 998 333
Undistributed equity earnings (263) (143) (541) (191)
Net (gain) loss on asset dispositions 6 (142) (82) (226)
Other (30) (88) 105 (126)
Working capital changes 1,267 51 (611) 703
Net cash provided by continuing operations 4,468 1,997 8,795 7,143
Net cash provided by (used in) discontinued
operations (55) 61 (33) 181
Net cash provided by operating activities $ 4,413 2,058 8,762 7,324
CAPITAL EXPENDITURES AND INVESTMENTS
E&P
United States $ 332 353 946 1,060
International 916 756 2,751 2,228
1,248 1,109 3,697 3,288
Midstream 1 2 6 6
R&M 277 302 770 750
Chemicals - - - -
Emerging Businesses 19 60 74 224
Corporate and other* 49 47 112 117
$ 1,594 1,520 4,659 4,385
*Excludes discontinued operations
OTHER
At September 30, 2004 At December 31, 2003
Total debt $15,486 17,780
Common stockholders' equity $39,767 34,366
1-3
4. ConocoPhillips
Houston, Texas 77079
Preliminary
OPERATING HIGHLIGHTS
BY SEGMENT
Three Months Ended Nine Months Ended
September 30 September 30
2004 2003 2004 2003
Thousands of Barrels Daily
E&P
Crude oil produced
United States
Alaska 253 314 293 327
Lower 48 50 51 51 56
303 365 344 383
Norway 189 207 205 215
United Kingdom 59 67 64 79
Canada 24 29 25 31
China 25 25 28 25
Indonesia 14 16 15 18
Vietnam 35 11 32 14
Timor Sea 29 3 17 3
Other 55 70 60 73
Total consolidated 733 793 790 841
Equity affiliates 111 120 109 97
Total Worldwide 844 913 899 938
Syncrude 22 22 22 19
Natural gas liquids produced
United States
Alaska* 19 19 23 22
Lower 48 26 25 25 24
45 44 48 46
Norway 8 7 8 8
Canada 10 9 11 10
Other 24 2 14 4
Total Worldwide 87 62 81 68
10 13 14 14
*Includes reinjected volumes sold lease-to-lease.
Millions of Cubic Feet Daily
Natural gas produced*
United States
Alaska 164 180 166 177
Lower 48 1,220 1,271 1,226 1,306
1,384 1,451 1,392 1,483
Norway 274 216 299 265
United Kingdom 720 853 807 935
Canada 425 448 430 436
Timor Sea 35 61 35 61
Indonesia 248 275 244 248
Vietnam 15 - 16 -
Other 78 69 75 59
3,179 3,373 3,298 3,487
Total consolidated
Equity affiliates 4 11 5 11
Total Worldwide 3,183 3,384 3,303 3,498
*Represents quantities available for sale. Excludes gas equivalent of NGL shown above.
Liquefied natural gas sales 115 121 105 114
1-4
5. ConocoPhillips
Houston, Texas 77079
Preliminary
OPERATING HIGHLIGHTS
Three Months Ended Nine Months Ended
September 30 September 30
2004 2003 2004 2003
E&P (continued)
Per Unit
Average sales prices
Crude oil (per barrel)
United States
Alaska $ 40.48 28.31 36.41 28.99
Lower 48 39.56 27.94 35.21 28.98
Total U.S. 40.33 28.26 36.23 28.99
International 40.47 28.05 35.64 28.22
Total consolidated 40.41 28.15 35.90 28.57
Equity affiliates 25.86 19.90 22.93 18.84
Total Worldwide 38.77 27.00 34.34 27.55
Natural gas-lease (per MCF)
United States
Alaska 2.22 1.33 2.38 1.71
Lower 48 5.29 4.61 5.26 4.98
Total U.S. 5.19 4.45 5.14 4.83
International 3.98 3.42 3.97 3.63
Total consolidated 4.48 3.84 4.44 4.11
Equity affiliates 0.31 4.12 2.59 4.61
Total Worldwide 4.48 3.84 4.44 4.12
Midstream
Thousands of Barrels Daily
Natural gas liquids extracted
Consolidated
United States 28 50 35 51
International 49 47 43 44
Equity affiliates
United States* 111 111 111 111
International 6 7 6 7
194 215 195 213
*Represents 30.3 percent interest in Duke Energy Field Services LLC (DEFS).
Per Barrel
U.S. product prices
Weighted average NGL**
Consolidated $ 31.03 20.94 27.71 22.51
DEFS 30.27 20.67 26.90 21.91
**Prices are based on index prices from the Mont Belvieu and Conway market hubs that are weighted by natural-gas-liquids
component and location mix.
1-5
6. ConocoPhillips
Houston, Texas 77079
Three Months Ended Nine Months Ended
September 30 September 30
2004 2003 2004 2003
Thousands of Barrels Daily
R&M
United States
Crude oil capacity 2,160 2,168 2,165 2,168
Crude oil runs 2,011 2,083 2,078 2,073
Refinery production 2,198 2,322 2,248 2,311
International*
Crude oil capacity 428 442 441 442
Crude oil runs 425 417 381 430
Refinery production 439 413 389 419
U.S. Petroleum products outside sales
Gasoline 1,366 1,398 1,337 1,370
Distillates 544 580 551 590
Aviation fuels 200 197 190 176
Other products 553 497 548 499
2,663 2,672 2,626 2,635
International 472 441 470 439
3,135 3,113 3,096 3,074
Per Gallon
U.S. Average sales prices**
Automotive gasoline-wholesale $ 1.37 1.09 1.31 1.07
Automotive gasoline-retail 1.51 1.42 1.48 1.38
Distillates-wholesale 1.30 0.88 1.18 0.93
*Includes ConocoPhillips' share of equity affiliates.
**Excludes excise taxes.
1-6