
Recommandé
Contenu connexe
Tendances
Tendances (19)
Similaire à conoco phillips 2005First Quarter
Similaire à conoco phillips 2005First Quarter (20)
Plus de finance1
Plus de finance1 (17)
Dernier
Dernier (20)
conoco phillips 2005First Quarter
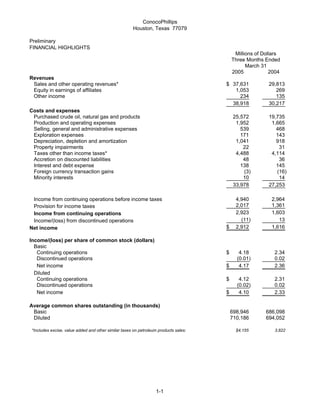
- 1. ConocoPhillips Houston, Texas 77079 Preliminary FINANCIAL HIGHLIGHTS Millions of Dollars Three Months Ended March 31 2005 2004 Revenues Sales and other operating revenues* $ 37,631 29,813 Equity in earnings of affiliates 1,053 269 Other income 234 135 38,918 30,217 Costs and expenses Purchased crude oil, natural gas and products 25,572 19,735 Production and operating expenses 1,952 1,665 Selling, general and administrative expenses 539 468 Exploration expenses 171 143 Depreciation, depletion and amortization 1,041 918 Property impairments 22 31 Taxes other than income taxes* 4,488 4,114 Accretion on discounted liabilities 48 36 Interest and debt expense 138 145 Foreign currency transaction gains (3) (16) Minority interests 10 14 33,978 27,253 Income from continuing operations before income taxes 4,940 2,964 2,017 1,361 Provision for income taxes 2,923 1,603 Income from continuing operations (11) 13 Income/(loss) from discontinued operations $ 2,912 1,616 Net income Income/(loss) per share of common stock (dollars) Basic Continuing operations $ 4.18 2.34 Discontinued operations (0.01) 0.02 Net income $ 4.17 2.36 Diluted Continuing operations $ 4.12 2.31 Discontinued operations (0.02) 0.02 Net income $ 4.10 2.33 Average common shares outstanding (in thousands) Basic 698,946 686,098 Diluted 710,186 694,052 *Includes excise, value added and other similar taxes on petroleum products sales: $4,155 3,822 1-1
- 2. ConocoPhillips Houston, Texas 77079 Preliminary SELECTED FINANCIAL DATA Millions of Dollars Three Months Ended March 31 2005 2004 INCOME/(LOSS) FROM CONTINUING OPERATIONS E&P United States $ 892 635 International 895 622 Total E&P 1,787 1,257 Midstream 385 55 R&M United States 570 403 International 130 61 Total R&M 700 464 LUKOIL Investment 110 - Chemicals 133 39 Emerging Businesses (8) (22) Corporate and other (184) (190) Consolidated $ 2,923 1,603 INCOME/(LOSS) FROM DISCONTINUED OPERATIONS Corporate and other (11) 13 SUMMARY OF NET INCOME/(LOSS) E&P United States $ 892 635 International 895 622 Total E&P 1,787 1,257 Midstream 385 55 R&M United States 570 403 International 130 61 Total R&M 700 464 LUKOIL Investment 110 - Chemicals 133 39 Emerging Businesses (8) (22) Corporate and other (195) (177) Net Income/(loss) $ 2,912 1,616 1-2
- 3. ConocoPhillips Houston, Texas 77079 Preliminary SELECTED FINANCIAL DATA Three Months Ended March 31 2005 2004 INCOME FROM CONTINUING OPERATIONS Effective tax rate % 40.8 % 45.9 Millions of Dollars FOREIGN CURRENY GAINS (LOSSES) AFTER-TAX E&P $ 12 5 Midstream - - R&M (18) 1 LUKOIL Investment - - Chemicals - - Emerging Businesses - - Corporate and other 7 6 $ 1 12 CASH FLOWS FROM OPERATING ACTIVITIES Income from continuing operations $ 2,923 1,603 Depreciation, depletion and amortization 1,041 918 Property impairments 22 31 Dry hole costs and leasehold impairment 109 87 Accretion on discounted liabilities 48 36 Deferred income taxes 123 360 Undistributed equity earnings (805) (181) Net gain on asset dispositions (177) (82) Other (78) 70 Working capital changes 888 (777) Net cash provided by continuing operations 4,094 2,065 Net cash provided by discontinued operations (5) 8 Net cash provided by operating activities $ 4,089 2,073 CAPITAL EXPENDITURES AND INVESTMENTS E&P United States $ 322 306 International 884 904 1,206 1,210 Midstream 1 3 R&M 275 215 LUKOIL Investment 324 - Chemicals - - Emerging Businesses (4) 28 Corporate and other* 20 25 $ 1,822 1,481 *Excludes discontinued operations OTHER At March 31, 2005 At December 31, 2004 Total debt $14,012 15,002 Common stockholders' equity $45,031 42,723 1-3
- 4. ConocoPhillips Houston, Texas 77079 Preliminary OPERATING HIGHLIGHTS BY SEGMENT Three Months Ended March 31 2005 2004 Thousands of Barrels Daily E&P Crude oil produced United States Alaska 309 320 Lower 48 62 53 371 373 Norway 207 215 United Kingdom 61 67 Canada 23 27 China 22 32 Indonesia 21 15 Vietnam 27 31 Timor Sea 36 5 Other 54 63 Total consolidated 822 828 Equity affiliates 120 113 Total Worldwide 942 941 Syncrude 14 23 Natural gas liquids produced United States Alaska* 24 26 Lower 48 27 24 51 50 Norway 10 9 Canada 10 10 Timor Sea 17 - Other 6 7 Total Worldwide 94 76 13 16 *Includes reinjected volumes sold lease-to-lease. Millions of Cubic Feet Daily Natural gas produced* United States Alaska 185 185 Lower 48 1,169 1,233 1,354 1,418 Norway 298 319 United Kingdom 824 879 Canada 417 428 Timor Sea 35 40 Indonesia 273 248 Vietnam 18 17 Other 76 66 Total consolidated 3,295 3,415 Equity affiliates 5 9 Total Worldwide 3,300 3,424 *Represents quantities available for sale. Excludes gas equivalent of NGL shown above. Liquefied natural gas sales 132 118 LUKOIL Investment Production (MBOE/D)* 201 - Refinery crude oil throughput (MB/D)* 92 - *Represents our estimated net share of LUKOIL 1-4
- 5. ConocoPhillips Houston, Texas 77079 Preliminary OPERATING HIGHLIGHTS Three Months Ended March 31 2005 2004 E&P Per Unit Average sales prices Crude oil (per barrel) United States Alaska $ 44.15 32.93 Lower 48 41.29 31.86 Total U.S. 43.69 32.78 International 45.93 31.48 Total consolidated 44.89 32.08 Equity affiliates 30.38 19.27 Total Worldwide 43.15 30.44 Natural gas-lease (per MCF) United States Alaska 1.77 2.54 Lower 48 5.66 5.00 Total U.S. 5.45 4.88 International 5.03 4.11 Total consolidated 5.19 4.41 Equity affiliates 0.25 3.91 Total Worldwide 5.19 4.41 Midstream Thousands of Barrels Daily Natural gas liquids extracted Consolidated United States 23 54 International 53 47 Equity affiliates United States* 110 109 International 6 6 192 216 *Represents 30.3 percent interest in Duke Energy Field Services LLC (DEFS). Per Barrel U.S. product prices Weighted average NGL** Consolidated $ 31.95 25.68 DEFS 30.61 24.81 **Prices are based on index prices from the Mont Belvieu and Conway market hubs that are weighted by DEFS' naural-gas-liquids component and location mix. 1-5
- 6. ConocoPhillips Houston, Texas 77079 Preliminary OPERATING HIGHLIGHTS Three Months Ended March 31 2005 2004 Thousands of Barrels Daily R&M United States Crude oil capacity 2,173 2,168 Crude oil runs 1,957 2,105 Refinery production 2,147 2,245 International* Crude oil capacity 428 447 Crude oil runs 428 409 Refinery production 443 410 U.S. Petroleum products outside sales Automotive gasoline 1,302 1,315 Distillates 642 570 Aviation fuels 198 178 Other products 461 517 2,603 2,580 International 495 501 3,098 3,081 Per Gallon U.S. Average sales prices** Automotive gasoline-wholesale $ 1.44 1.16 Automotive gasoline-retail 1.55 1.32 Distillates-wholesale 1.48 1.02 *Includes ConocoPhillips' share of equity affiliates except LUKOIL. **Excludes excise taxes. 1-6