ConocoPhillips Reports Preliminary Third Quarter 2005 Financial Highlights
1. ConocoPhillips
Houston, Texas 77079
Preliminary
FINANCIAL HIGHLIGHTS
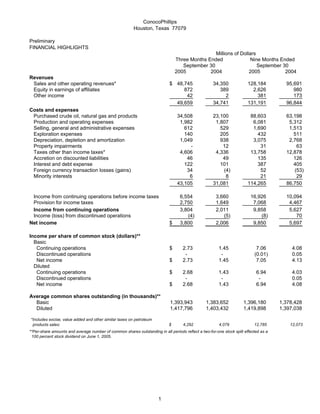
Millions of Dollars
Three Months Ended Nine Months Ended
September 30 September 30
2005 2004 2005 2004
Revenues
Sales and other operating revenues* $ 48,745 34,350 128,184 95,691
Equity in earnings of affiliates 872 389 2,626 980
Other income 42 2 381 173
49,659 34,741 131,191 96,844
Costs and expenses
Purchased crude oil, natural gas and products 34,508 23,100 88,603 63,198
Production and operating expenses 1,982 1,807 6,081 5,312
Selling, general and administrative expenses 612 529 1,690 1,513
Exploration expenses 140 205 432 511
Depreciation, depletion and amortization 1,049 938 3,075 2,768
Property impairments - 12 31 63
Taxes other than income taxes* 4,606 4,336 13,758 12,878
Accretion on discounted liabilities 46 49 135 126
Interest and debt expense 122 101 387 405
Foreign currency transaction losses (gains) 34 (4) 52 (53)
Minority interests 6 8 21 29
43,105 31,081 114,265 86,750
Income from continuing operations before income taxes 6,554 3,660 16,926 10,094
Provision for income taxes 2,750 1,649 7,068 4,467
Income from continuing operations 3,804 2,011 9,858 5,627
Income (loss) from discontinued operations (4) (5) (8) 70
Net income $ 3,800 2,006 9,850 5,697
Income per share of common stock (dollars)**
Basic
Continuing operations $ 2.73 1.45 7.06 4.08
Discontinued operations - - (0.01) 0.05
Net income $ 2.73 1.45 7.05 4.13
Diluted
Continuing operations $ 2.68 1.43 6.94 4.03
Discontinued operations - - - 0.05
Net income $ 2.68 1.43 6.94 4.08
Average common shares outstanding (in thousands)**
Basic 1,393,943 1,383,652 1,396,180 1,378,428
Diluted 1,417,796 1,403,432 1,419,898 1,397,038
*Includes excise, value added and other similar taxes on petroleum
products sales: $ 4,292 4,079 12,785 12,073
**Per-share amounts and average number of common shares outstanding in all periods reflect a two-for-one stock split effected as a
100 percent stock dividend on June 1, 2005.
1
2. ConocoPhillips
Houston, Texas 77079
Preliminary
SELECTED FINANCIAL DATA
Millions of Dollars
Three Months Ended Nine Months Ended
September 30 September 30
2005 2004 2005 2004
INCOME (LOSS) FROM CONTINUING OPERATIONS
E&P
United States $ 1,107 701 2,965 2,007
International 1,181 719 3,039 2,024
Total E&P 2,288 1,420 6,004 4,031
Midstream 88 38 541 135
R&M
United States 1,096 505 2,602 1,642
International 294 203 598 348
Total R&M 1,390 708 3,200 1,990
LUKOIL Investment 267 - 525 -
Chemicals 13 81 209 166
Emerging Businesses - (27) (16) (78)
Corporate and other (242) (209) (605) (617)
Consolidated $ 3,804 2,011 9,858 5,627
INCOME (LOSS) FROM DISCONTINUED OPERATIONS
Corporate and other (4) (5) (8) 70
SUMMARY OF NET INCOME (LOSS)
E&P
United States $ 1,107 701 2,965 2,007
International 1,181 719 3,039 2,024
Total E&P 2,288 1,420 6,004 4,031
Midstream 88 38 541 135
R&M
United States 1,096 505 2,602 1,642
International 294 203 598 348
Total R&M 1,390 708 3,200 1,990
LUKOIL Investment 267 - 525 -
Chemicals 13 81 209 166
Emerging Businesses - (27) (16) (78)
Corporate and other (246) (214) (613) (547)
Net income $ 3,800 2,006 9,850 5,697
2
3. ConocoPhillips
Houston, Texas 77079
Preliminary
OPERATING HIGHLIGHTS
BY SEGMENT
Three Months Ended Nine Months Ended
September 30 September 30
2005 2004 2005 2004
Thousands of Barrels Daily
E&P
Crude oil produced
United States
Alaska 281 253 296 293
Lower 48 56 50 60 51
337 303 356 344
Norway 198 189 200 205
United Kingdom 56 59 59 64
Canada 22 24 23 25
China 22 25 23 28
Indonesia 10 14 16 15
Vietnam 30 35 27 32
Timor Sea 38 29 32 17
Other 53 55 54 60
Total consolidated 766 733 790 790
Equity affiliates 124 111 122 109
Total Worldwide 890 844 912 899
Syncrude 21 22 19 22
Natural gas liquids produced
United States
Alaska* 18 19 19 23
Lower 48 30 26 30 25
48 45 49 48
Norway 10 8 9 8
Canada 10 10 10 11
Timor Sea 20 14 15 6
Other 4 10 5 8
Total Worldwide 92 87 88 81
8 10 7 14
*Includes reinjected volumes sold lease-to-lease.
Millions of Cubic Feet Daily
Natural gas produced*
United States
Alaska 173 164 169 166
Lower 48 1,218 1,220 1,194 1,226
1,391 1,384 1,363 1,392
Norway 259 274 275 299
United Kingdom 588 720 717 807
Canada 429 425 422 430
Timor Sea 35 35 35 35
Indonesia 303 248 288 244
Vietnam 20 15 17 16
Other 74 78 77 75
3,099 3,179 3,194 3,298
Total consolidated
Equity affiliates 10 4 8 5
Total Worldwide 3,109 3,183 3,202 3,303
*Represents quantities available for sale. Excludes gas equivalent of NGL shown above.
Liquefied natural gas sales 123 115 117 105
LUKOIL Investment
Production (MBOE/D)* 266 - 231 -
Refinery crude oil throughput (MB/D)* 138 - 110 -
*Represents our estimated net share of LUKOIL.
4
4. ConocoPhillips
Houston, Texas 77079
Preliminary
SELECTED FINANCIAL DATA
Three Months Ended Nine Months Ended
September 30 September 30
2005 2004 2005 2004
INCOME FROM CONTINUING OPERATIONS
Effective tax rate % 42.0 % 45.1 41.8 44.3
Millions of Dollars
FOREIGN CURRENCY GAINS (LOSSES)
AFTER-TAX
E&P $ 2 (4) 6 15
Midstream - - 7 -
R&M (13) (5) (49) 1
LUKOIL Investment (1) - (1) -
Chemicals - - - -
Emerging Businesses - (1) - -
Corporate and other (23) 15 (27) 21
$ (35) 5 (64) 37
CASH FLOWS FROM OPERATING ACTIVITIES
Income from continuing operations $ 3,804 2,011 9,858 5,627
Depreciation, depletion and amortization 1,049 938 3,075 2,768
Property impairments - 12 31 63
Dry hole costs and leasehold impairment 55 150 211 342
Accretion on discounted liabilities 46 49 135 126
Deferred income taxes 261 328 753 998
Undistributed equity earnings (463) (263) (1,682) (541)
Net (gain) loss on asset dispositions (22) 6 (264) (82)
Other 192 (30) 1 105
Working capital changes 1,177 1,267 841 (611)
Net cash provided by continuing operations 6,099 4,468 12,959 8,795
Net cash provided by (used in) discontinued
operations (3) (55) (6) (33)
Net cash provided by operating activities $ 6,096 4,413 12,953 8,762
CAPITAL EXPENDITURES AND INVESTMENTS
E&P
United States $ 323 332 1,221 946
International 1,152 916 3,797 2,751
1,475 1,248 5,018 3,697
Midstream 838 1 839 6
R&M 440 277 1,075 770
LUKOIL Investment 815 - 1,523 -
Chemicals - - - -
Emerging Businesses 2 19 5 74
Corporate and other* 56 49 113 112
$ 3,626 1,594 8,573 4,659
*Excludes discontinued operations
OTHER
At September 30, 2005 At December 31, 2004
Total debt $13,497 15,002
Common stockholders' equity $49,838 42,723
3
5. ConocoPhillips
Houston, Texas 77079
Preliminary
OPERATING HIGHLIGHTS
Three Months Ended Nine Months Ended
September 30 September 30
2005 2004 2005 2004
E&P
Per Unit
Average sales prices
Crude oil (per barrel)
United States
Alaska $ 58.70 40.48 50.54 36.41
Lower 48 50.00 39.56 44.83 35.21
Total U.S. 57.31 40.33 49.59 36.23
International 59.52 40.47 51.46 35.64
Total consolidated 58.49 40.41 50.61 35.90
Equity affiliates 45.25 26.19 37.45 23.43
Total Worldwide 56.64 38.78 48.80 34.40
Natural gas-lease (per MCF)
United States
Alaska 2.57 2.22 2.66 2.38
Lower 48 7.67 5.29 6.53 5.26
Total U.S. 7.48 5.19 6.40 5.14
International 5.60 3.98 5.25 3.97
Total consolidated 6.40 4.48 5.71 4.44
Equity affiliates 0.20 0.31 0.25 2.59
Total Worldwide 6.38 4.48 5.70 4.44
Midstream
Thousands of Barrels Daily
Natural gas liquids extracted
Consolidated
United States 23 28 22 35
International 5 49 34 43
Equity affiliates
United States* 171 111 131 111
International 6 6 6 6
205 194 193 195
*Represents 30.3 percent interest in Duke Energy Field Services LLC (DEFS).
Per Barrel
U.S. product prices
Weighted average NGL**
Consolidated $ 39.60 31.03 34.68 27.71
DEFS 38.31 30.27 33.42 26.90
**Prices are based on index prices from the Mont Belvieu and Conway market hubs that are weighted by natural-gas-liquids
component and location mix.
5
6. ConocoPhillips
Houston, Texas 77079
Three Months Ended Nine Months Ended
September 30 September 30
2005 2004 2005 2004
Thousands of Barrels Daily
R&M
United States
Crude oil capacity 2,182 2,160 2,179 2,165
Crude oil runs 2,040 2,011 2,044 2,078
Refinery production 2,223 2,198 2,238 2,248
International*
Crude oil capacity 428 428 428 441
Crude oil runs 431 425 420 381
Refinery production 448 439 434 389
U.S. Petroleum products outside sales
Gasoline 1,397 1,366 1,376 1,337
Distillates 725 544 683 551
Aviation fuels 203 200 205 190
Other products 526 553 518 548
2,851 2,663 2,782 2,626
International 470 472 481 470
3,321 3,135 3,263 3,096
Per Gallon
U.S. Average sales prices**
Automotive gasoline-wholesale $ 2.00 1.37 1.71 1.31
Automotive gasoline-retail 2.14 1.51 1.86 1.48
Distillates-wholesale 1.97 1.30 1.71 1.18
*Includes ConocoPhillips' share of equity affiliates.
**Excludes excise taxes.
6