1. News Release
Contact:
Steve Dale Judith T. Murphy
Media Relations Investor Relations
(612) 303-0784 (612) 303-0783
U.S. BANCORP REPORTS RECORD NET INCOME FOR THE
THIRD QUARTER OF 2006
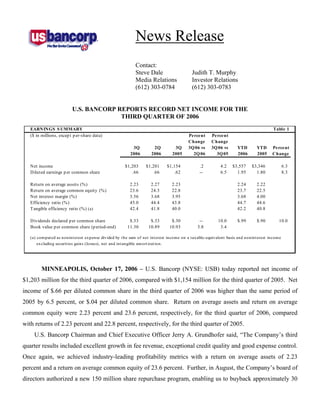
EARNINGS S UMMARY Table 1
($ in millions, excep t p er-share data) Pe rce nt Pe rce nt
Change Change
3Q 2Q 3Q 3Q 06 vs 3Q 06 vs YTD YTD Pe rce nt
2006 2006 2005 2Q 06 3Q 05 2006 2005 Change
Net income $1,203 $1,201 $1,154 .2 4.2 $3,557 $3,346 6.3
Diluted earnings p er common share .66 .66 .62 -- 6.5 1.95 1.80 8.3
Return on average assets (%) 2.23 2.27 2.23 2.24 2.22
Return on average common equity (%) 23.6 24.3 22.8 23.7 22.5
Net interest margin (%) 3.56 3.68 3.95 3.68 4.00
Efficiency ratio (%) 45.0 44.4 43.8 44.7 44.6
42.4 41.8 40.0 42.2 40.8
T angible efficiency ratio (%) (a)
Dividends declared p er common share $.33 $.33 $.30 -- 10.0 $.99 $.90 10.0
Book value p er common share (p eriod-end) 11.30 10.89 10.93 3.8 3.4
(a) com put ed as nonint erest expense divided by t he sum of net int erest incom e on a t axable-equivalent basis and nonint erest incom e
excluding securit ies gains (losses), net and int angible am ort izat ion.
MINNEAPOLIS, October 17, 2006 – U.S. Bancorp (NYSE: USB) today reported net income of
$1,203 million for the third quarter of 2006, compared with $1,154 million for the third quarter of 2005. Net
income of $.66 per diluted common share in the third quarter of 2006 was higher than the same period of
2005 by 6.5 percent, or $.04 per diluted common share. Return on average assets and return on average
common equity were 2.23 percent and 23.6 percent, respectively, for the third quarter of 2006, compared
with returns of 2.23 percent and 22.8 percent, respectively, for the third quarter of 2005.
U.S. Bancorp Chairman and Chief Executive Officer Jerry A. Grundhofer said, “The Company’s third
quarter results included excellent growth in fee revenue, exceptional credit quality and good expense control.
Once again, we achieved industry-leading profitability metrics with a return on average assets of 2.23
percent and a return on average common equity of 23.6 percent. Further, in August, the Company’s board of
directors authorized a new 150 million share repurchase program, enabling us to buyback approximately 30
2. U.S. Bancorp Reports Third Quarter 2006 Results
October 17, 2006
Page 2
million shares in the third quarter. The result of this buyback, along with our regular quarterly dividend,
represented a return of earnings to shareholders of 128 percent.
“Fee revenue experienced double-digit growth year-over-year, led by our payments and fiduciary
businesses. In fact, fee income was, once again, over 50 percent of total net revenue in the third quarter.
This growth in fee revenue helped to mitigate the impact of the decrease in net interest income, as pressure
from competitive pricing and growth in lower-spread, fixed-rate assets reduced the quarter’s net interest
margin to 3.56 percent. On a positive note, although the net interest margin declined on a linked quarter
basis, it does appear to have stabilized over the past few months. Consequently, assuming the Fed has
stopped raising rates, we should begin to see some improvement in net interest income in the fourth quarter.
This is an important inflection point for our Company, as a stable and increasing net interest margin, coupled
with growth in earning assets, will lead to growth in net interest income - growth we have not experienced
since the third quarter of 2005.
“Our third quarter results demonstrated our disciplined approach to expense, as the increase year-over-
year of 4.4 percent was primarily the result of expenses related to recent acquisitions and business
development efforts. Expense discipline does not mean that we don’t spend appropriately or invest in our
Company. It simply means that we manage our business - spending and investing when and where it makes
the most sense for the Company. This discipline has enabled us to become a low cost producer, and that
allows us to compete very effectively during the most challenging of times.
“Credit quality was excellent this quarter, the result of our continued efforts to reduce the risk profile of
the Company and maintain a high quality credit portfolio. This is the time in the cycle when it is tempting to
compromise on terms in order to maximize growth. We are not willing to make that compromise. We
believe this approach best serves our customers and shareholders now and in the future.
“The U.S. Bank Five Star Service Guarantee has now been a part of this Company for over 10 years.
We strongly believe that in a commodity business such as ours, customer service is what will differentiate us
from our competitors over time. We have tracked our performance for many years in order to monitor our
success. Feedback from both external and internal surveys indicates that we are exceeding expectations and
are amongst the best in our peer group. Customer service will continue to be a priority for this Company.
Our current success is the direct result of our employees’ dedication to serving their customers and
representing our brand.
(MORE)
3. U.S. Bancorp Reports Third Quarter 2006 Results
October 17, 2006
Page 3
“I am very proud of what we have accomplished over the past three quarters, particularly given the
economic and interest rate challenges that our industry has had to face this year. We have expanded our
distribution, invested in attractive fee-based payments and fiduciary businesses, maintained exceptional
credit quality, sustained our disciplined approach to expense, provided peer-leading customer service and
returned over 120 percent of our capital to shareholders in the form of dividends and buybacks. Our strategy
is working, and I am confident that this Company will continue to provide the products, services and results
that our customers, communities, employees and shareholders expect and deserve.”
The Company’s results for the third quarter of 2006 improved over the same period of 2005, as net
income increased by $49 million (4.2 percent), primarily due to strong growth in fee-based revenues and the
benefit of a lower effective tax rate from a year ago. This was offset somewhat by lower net interest income
and the additional operating costs of acquired businesses. Total net revenue on a taxable-equivalent basis for
the third quarter of 2006 was $3,421 million, $54 million (1.6 percent) higher than the third quarter of 2005,
primarily reflecting a 10.9 percent increase in noninterest income partially offset by a 6.6 percent decline in
net interest income. Noninterest income growth was driven by organic business growth and expansion in
trust and payment processing businesses, partially offset by lower mortgage banking revenue principally due
to the impact of adopting Statement of Financial Accounting Standards No. 156, “Accounting for Servicing
of Financial Assets” (“SFAS 156”) in the first quarter of 2006. Total noninterest expense in the third quarter
of 2006 was $1,538 million, $65 million (4.4 percent) higher than the third quarter of 2005, primarily
reflecting incremental operating and business integration costs principally associated with recent
acquisitions, increased pension costs and higher expenses related to investments in tax-advantaged projects
from a year ago. This was partially offset by lower intangible expense due to the adoption of SFAS 156.
Provision for credit losses for the third quarter of 2006 was $135 million, a decrease of $10 million from
the third quarter of 2005. The decrease in the provision for credit losses year-over-year primarily reflected
strong credit quality and the near-term favorable impact of changes in bankruptcy law in the fourth quarter of
2005. Net charge-offs in the third quarter of 2006 were $135 million, compared with the second quarter of
2006 net charge-offs of $125 million and the third quarter of 2005 net charge-offs of $156 million. Total
nonperforming assets were $575 million at September 30, 2006, compared with $550 million at June 30,
2006, and $644 million at September 30, 2005. The ratio of the allowance for credit losses to nonperforming
loans was 476 percent at September 30, 2006, compared with 500 percent at June 30, 2006, and 413 percent
at September 30, 2005.
(MORE)
4. U.S. Bancorp Reports Third Quarter 2006 Results
October 17, 2006
Page 4
INCO ME S TATEMENT HIGHLIGHTS Table 2
(T axable-equivalent basis, $ in millions, Percent Percent
excep t p er-share data) Change Change
3Q 2Q 3Q 3Q 06 vs 3Q 06 vs YTD YTD Percent
2006 2006 2005 2Q 06 3Q 05 2006 2005 Change
Net interest income $1,673 $1,697 $1,791 (1.4) (6.6) $5,095 $5,303 (3.9)
Noninterest income 1,748 1,755 1,576 (.4) 10.9 5,117 4,499 13.7
T otal net revenue 3,421 3,452 3,367 (.9) 1.6 10,212 9,802 4.2
Noninterest exp ense 1,538 1,530 1,473 .5 4.4 4,568 4,399 3.8
Income before p rovision and taxes 1,883 1,922 1,894 (2.0) (.6) 5,644 5,403 4.5
Provision for credit losses 135 125 145 8.0 (6.9) 375 461 (18.7)
Income before taxes 1,748 1,797 1,749 (2.7) (.1) 5,269 4,942 6.6
T axable-equivalent adjustment 13 11 9 18.2 44.4 34 23 47.8
Ap p licable income taxes 532 585 586 (9.1) (9.2) 1,678 1,573 6.7
Net income $1,203 $1,201 $1,154 .2 4.2 $3,557 $3,346 6.3
Net income ap p licable to common equity $1,187 $1,184 $1,154 .3 2.9 $3,524 $3,346 5.3
Diluted earnings p er common share $.66 $.66 $.62 -- 6.5 $1.95 $1.80 8.3
Net Interest Income
Third quarter net interest income on a taxable-equivalent basis was $1,673 million, compared with
$1,791 million recorded in the third quarter of 2005. Average earning assets for the period increased over
the third quarter of 2005 by $6.7 billion (3.7 percent), primarily driven by an increase in total average loans.
This was partially offset by a $2.0 billion (4.7 percent) decrease in average investment securities. The
positive impact to net interest income from the growth in earning assets was more than offset by a lower net
interest margin. The net interest margin in the third quarter of 2006 was 3.56 percent, compared with 3.95
percent in the third quarter of 2005. The decline in the net interest margin reflected the competitive lending
environment, asset/liability management decisions and the impact of changes in the yield curve from a year
ago. Since the third quarter of 2005, credit spreads have tightened by approximately 24 basis points across
most lending products due to competitive pricing and a change in mix reflecting growth in lower-spread,
fixed-rate credit products and noninterest-bearing corporate and purchasing card balances. The net interest
margin also declined due to funding incremental asset growth with higher cost wholesale funding, share
repurchases and asset/liability decisions designed to minimize the Company’s rate sensitivity position. An
increase in the margin benefit of net free funds and loan fees partially offset these factors.
(MORE)
5. U.S. Bancorp Reports Third Quarter 2006 Results
October 17, 2006
Page 5
Net interest income in the third quarter of 2006 was lower than the second quarter of 2006 by $24
million (1.4 percent). The net interest margin of 3.56 percent in the third quarter of 2006 was 12 basis points
lower than the net interest margin of 3.68 percent in the second quarter of 2006. The decline in the net
interest margin from the second quarter of 2006 was due to continued tightening of credit spreads (4 basis
points), including the impact of growth in noninterest-bearing corporate and purchasing card balances,
incrementally funding growth in earning assets with wholesale funding and the ongoing impact of the flat
yield curve.
Beginning in the third quarter, the Federal Reserve Bank paused from its policies of increasing
interest rates and tightening the money supply. If the Federal Reserve Bank leaves rates unchanged, the
Company expects net interest margin to stabilize in the fourth quarter as the cost of funding the balance sheet
levels off and the yield on earning assets continues to rise through re-pricing and incremental growth.
NET INTERES T INCO ME Table 3
(T axable-equivalent basis; $ in millions)
Change Change
3Q 2Q 3Q 3Q 06 vs 3Q 06 vs YTD YTD
2006 2006 2005 2Q 06 3Q 05 2006 2005 Change
Comp onents of net interest income
Income on earning assets $3,175 $3,037 $2,727 $138 $448 $9,115 $7,741 $1,374
Exp ense on interest-bearing liabilities 1,502 1,340 936 162 566 4,020 2,438 1,582
Net interest income $1,673 $1,697 $1,791 $(24) $(118) $5,095 $5,303 $(208)
Average y ields and rates p aid
Earning assets y ield 6.74% 6.58% 6.01% .16% .73% 6.58% 5.85% .73%
Rate p aid on interest-bearing liabilities 3.79 3.45 2.49 .34 1.30 3.45 2.23 1.22
Gross interest margin 2.95% 3.13% 3.52% (.18)% (.57)% 3.13% 3.62% (.49)%
Net interest margin 3.56% 3.68% 3.95% (.12)% (.39)% 3.68% 4.00% (.32)%
Average balances
Investment securities $39,806 $40,087 $41,782 $(281) $(1,976) $39,858 $42,308 $(2,450)
Loans 142,894 140,863 135,283 2,031 7,611 141,059 131,432 9,627
Earning assets 187,190 184,890 180,452 2,300 6,738 185,075 176,851 8,224
Interest-bearing liabilities 157,248 155,755 149,431 1,493 7,817 155,650 145,878 9,772
Net free funds (a) 29,942 29,135 31,021 807 (1,079) 29,425 30,973 (1,548)
(a) Represent s nonint erest -bearing deposit s, allowance for loan losses, unrealized gain (loss) on available-for-sale securit ies, non-earning
asset s, ot her nonint erest -bearing liabilit ies and equit y.
(MORE)
6. U.S. Bancorp Reports Third Quarter 2006 Results
October 17, 2006
Page 6
AVERAGE LO ANS Table 4
($ in millions) Percent Percent
Change Change
3Q 2Q 3Q 3Q 06 vs 3Q 06 vs YTD YTD Percent
2006 2006 2005 2Q 06 3Q 05 2006 2005 Change
Commercial $40,781 $39,871 $38,343 2.3 6.4 $39,840 $37,348 6.7
Lease financing 5,287 5,199 4,908 1.7 7.7 5,189 4,915 5.6
T otal commercial 46,068 45,070 43,251 2.2 6.5 45,029 42,263 6.5
Commercial mortgages 19,941 20,195 20,341 (1.3) (2.0) 20,133 20,255 (.6)
Construction and develop ment 8,760 8,600 7,852 1.9 11.6 8,571 7,507 14.2
T otal commercial real estate 28,701 28,795 28,193 (.3) 1.8 28,704 27,762 3.4
Residential mortgages 21,118 20,868 18,741 1.2 12.7 20,992 17,266 21.6
Credit card 7,800 7,360 6,684 6.0 16.7 7,429 6,544 13.5
Retail leasing 7,069 7,115 7,467 (.6) (5.3) 7,144 7,328 (2.5)
Home equity and second mortgages 15,166 15,035 14,984 .9 1.2 15,047 14,944 .7
Other retail 16,972 16,620 15,963 2.1 6.3 16,714 15,325 9.1
T otal retail 47,007 46,130 45,098 1.9 4.2 46,334 44,141 5.0
T otal loans $142,894 $140,863 $135,283 1.4 5.6 $141,059 $131,432 7.3
Average loans for the third quarter of 2006 were $7.6 billion (5.6 percent) higher than the third quarter
of 2005, driven by growth in average total commercial loans of $2.8 billion (6.5 percent), residential
mortgages of $2.4 billion (12.7 percent) and total retail loans of $1.9 billion (4.2 percent). Average loans for
the third quarter of 2006 were higher than the second quarter of 2006 by $2.0 billion (1.4 percent), reflecting
growth in total commercial and total retail loans. Residential mortgages and total commercial real estate
loans remained relatively flat in the third quarter of 2006 compared with the second quarter of 2006. During
the first quarter of 2006, the Company began selling an increased proportion of its residential mortgage loan
production and anticipates that balances will remain essentially flat.
Average investment securities in the third quarter of 2006 were $2.0 billion (4.7 percent) lower than in
the third quarter of 2005. The change in the balance of the investment securities portfolio from a year ago
principally reflected asset/liability management decisions to reduce the focus on residential mortgage assets
given the changing rate environment and mix of loan growth. Additionally, the Company reclassified
approximately $460 million of principal-only securities to its trading account as of January 1, 2006, in
connection with the adoption of SFAS 156.
(MORE)
7. U.S. Bancorp Reports Third Quarter 2006 Results
October 17, 2006
Page 7
AVERAGE DEPO S ITS Table 5
($ in millions) Pe rcent Pe rce nt
Change Change
3Q 2Q 3Q 3Q 06 vs 3Q 06 vs YTD YTD Pe rce nt
2006 2006 2005 2Q 06 3Q 05 2006 2005 Change
Noninterest-bearing dep osits $28,220 $28,949 $29,434 (2.5) (4.1) $28,666 $29,003 (1.2)
Interest-bearing dep osits
Interest checking 23,595 23,333 22,508 1.1 4.8 23,358 22,891 2.0
M oney market savings 26,116 26,981 28,740 (3.2) (9.1) 26,820 29,517 (9.1)
Savings accounts 5,598 5,720 5,777 (2.1) (3.1) 5,669 5,876 (3.5)
T otal of savings dep osits 55,309 56,034 57,025 (1.3) (3.0) 55,847 58,284 (4.2)
T ime certificates of dep osit less
than $100,000 13,867 13,689 13,263 1.3 4.6 13,688 13,132 4.2
T ime dep osits greater than $100,000 22,579 22,561 21,262 .1 6.2 22,255 20,133 10.5
T otal interest-bearing dep osits 91,755 92,284 91,550 (.6) .2 91,790 91,549 .3
T otal dep osits $119,975 $121,233 $120,984 (1.0) (.8) $120,456 $120,552 (.1)
Average noninterest-bearing deposits for the third quarter of 2006 decreased $1.2 billion (4.1 percent)
compared with the third quarter of 2005 reflecting a decline in business demand deposits as these customers
reduce excess liquidity to fund business growth. The change also reflects a migration of customers to
interest-bearing products given rising interest rates.
Average total savings deposits declined year-over-year by $1.7 billion (3.0 percent) due to reductions in
average money market savings and savings accounts, partially offset by an increase in interest checking
balances. Average money market savings balances declined by $2.6 billion (9.1 percent) year-over-year,
primarily due to a decline in balances within the branches. This was partially offset by increases in broker
dealer and corporate trust balances. The overall decrease in average money market savings balances year-
over-year was primarily the result of the Company’s deposit pricing decisions for money market products in
relation to other fixed-rate deposit products offered. A portion of branch-based money market savings
accounts have migrated to fixed-rate time certificates to take advantage of higher interest rates for these
products.
Average time certificates of deposit less than $100,000 were higher in the third quarter of 2006 than the
third quarter of 2005 by $604 million (4.6 percent). Additionally, the Company experienced year-over-year
growth in average consumer-based time deposits greater than $100,000 of $1.2 billion (34.9 percent) due to
customer migration of deposit balances. Other time deposits greater than $100,000 were essentially
unchanged from a year ago.
(MORE)
8. U.S. Bancorp Reports Third Quarter 2006 Results
October 17, 2006
Page 8
Average noninterest-bearing deposits for the third quarter of 2006 decreased $729 million (2.5 percent)
compared with the second quarter of 2006 reflecting seasonally higher second quarter demand deposit
balances. Total savings deposits declined $725 million (1.3 percent) from the second quarter of 2006
partially offset by a modest increase in fixed-rate time certificates and time deposits greater than $100,000.
NO NINTERES T INCO ME Table 6
($ in millions) Pe rce nt Pe rce nt
Change Change
3Q 2Q 3Q 3Q 06 vs 3Q 06 vs YTD YTD Pe rce nt
2006 2006 2005 2Q 06 3Q 05 2006 2005 Change
Credit and debit card revenue $206 $202 $185 2.0 11.4 $590 $516 14.3
Corp orate p ay ment p roducts revenue 150 139 135 7.9 11.1 416 362 14.9
AT M p rocessing services 63 61 64 3.3 (1.6) 183 168 8.9
M erchant p rocessing services 253 253 200 -- 26.5 719 576 24.8
T rust and investment management fees 305 314 251 (2.9) 21.5 916 751 22.0
Dep osit service charges 268 264 246 1.5 8.9 764 690 10.7
T reasury management fees 111 116 109 (4.3) 1.8 334 333 .3
Commercial p roducts revenue 100 107 103 (6.5) (2.9) 311 299 4.0
M ortgage banking revenue 68 75 111 (9.3) (38.7) 167 323 (48.3)
Investment p roducts fees and commissions 34 42 37 (19.0) (8.1) 114 115 (.9)
Securities gains (losses), net -- 3 1 nm nm 3 (57) nm
Other 190 179 134 6.1 41.8 600 423 41.8
T otal noninterest income $1,748 $1,755 $1,576 (.4) 10.9 $5,117 $4,499 13.7
Noninterest Income
Third quarter noninterest income was $1,748 million, an increase of $172 million (10.9 percent) from
the same quarter of 2005 and $7 million (.4 percent) lower than the second quarter of 2006. The increase in
noninterest income over the third quarter of 2005 was driven by favorable variances in the majority of fee
income categories. Strong growth in fee-based revenue was partially offset by the accounting impact of
SFAS 156 on mortgage banking revenue.
Credit and debit card revenue and corporate payment products revenue were both higher in the third
quarter of 2006 than the third quarter of 2005 by $21 million and $15 million, or 11.4 percent and 11.1
percent, respectively. The strong growth in credit and debit card revenue was primarily driven by higher
customer transaction volumes. The corporate payment products revenue growth reflected organic growth in
sales volumes and card usage and acquired business expansion. Merchant processing services revenue was
higher in the third quarter of 2006 than the same quarter a year ago by $53 million (26.5 percent), reflecting
(MORE)
9. U.S. Bancorp Reports Third Quarter 2006 Results
October 17, 2006
Page 9
an increase in sales volume driven by acquisitions, higher same store sales, rates and equipment fees. Trust
and investment management fees increased by $54 million (21.5 percent) year-over-year, due to the
acquisition of the corporate and institutional trust business of a large national bank, account growth and
favorable equity market conditions. Deposit service charges grew year-over-year by $22 million (8.9
percent) due to increased transaction-related fees and the impact of net new checking accounts. Other
income was higher by $56 million (41.8 percent) as compared with the third quarter of 2005, primarily due
to a $32 million gain on the sale of equity interests in a card association and an increase in other equity
investment revenue. These favorable changes in fee-based revenue were partially offset by the decline in
mortgage banking revenue of $43 million (38.7 percent), principally driven by the adoption of the fair value
method of accounting for mortgage servicing rights.
Noninterest income was slighter lower ($7 million or .4 percent) in the third quarter of 2006 compared
with the second quarter of 2006. This reflected seasonally lower trust and investment management fees,
treasury management fees and investment products fees and commissions of $9 million (2.9 percent), $5
million (4.3 percent) and $8 million (19.0 percent) respectively. Mortgage banking revenue was lower than
the second quarter of 2006 by $7 million (9.3 percent) primarily due to lower production gains due to the
current interest rate environment. In addition, commercial products revenue was lower in the third quarter of
2006 by $7 million (6.5 percent) primarily due to lower commercial leasing revenue. These decreases were
partially offset by increases in credit and debit card revenue of $4 million (2.0 percent) corporate payment
products revenue of $11 million (7.9 percent) and deposit services charges of $4 million (1.5 percent)
primarily due to higher transaction volume. Other revenue increased $11 million (6.1 percent) in the third
quarter of 2006 primarily due to increased equity investment revenue.
(MORE)
10. U.S. Bancorp Reports Third Quarter 2006 Results
October 17, 2006
Page 10
NO NINTERES T EXPENS E Table 7
($ in millions) Pe rce nt Percent
Change Change
3Q 2Q 3Q 3Q 06 vs 3Q 06 vs YTD YTD Perce nt
2006 2006 2005 2Q 06 3Q 05 2006 2005 Change
Comp ensation $632 $627 $603 .8 4.8 $1,892 $1,782 6.2
Emp loy ee benefits 123 123 106 -- 16.0 379 330 14.8
Net occup ancy and equip ment 168 161 162 4.3 3.7 494 475 4.0
Professional services 54 41 44 31.7 22.7 130 119 9.2
M arketing and business develop ment 58 58 61 -- (4.9) 156 171 (8.8)
T echnology and communications 128 127 118 .8 8.5 372 337 10.4
Postage, p rinting and sup p lies 66 66 64 -- 3.1 198 190 4.2
Other intangibles 89 89 125 -- (28.8) 263 377 (30.2)
Debt p rep ay ment -- 11 -- nm nm 11 54 (79.6)
Other 220 227 190 (3.1) 15.8 673 564 19.3
T otal noninterest exp ense $1,538 $1,530 $1,473 .5 4.4 $4,568 $4,399 3.8
Noninterest Expense
Third quarter noninterest expense totaled $1,538 million, an increase of $65 million (4.4 percent) from
the same quarter of 2005 and $8 million (.5 percent) from the second quarter of 2006. Compensation
expense was higher year-over-year by $29 million (4.8 percent) primarily due to the corporate and
institutional trust and payments processing acquisitions and other growth initiatives. Benefits expense
increased from the third quarter of 2005 primarily due to higher pension costs from a year ago. Professional
services expense increased by $10 million (22.7 percent) due primarily to business development initiatives.
Technology and communications expense rose by $10 million (8.5 percent) due to higher outside data
processing expense principally associated with expanding a prepaid gift card program and the corporate and
institutional trust acquisition. Other expense increased in the third quarter of 2006 from the same quarter of
2005 by $30 million (15.8 percent) primarily due to increased investments in tax-advantaged projects
relative to a year ago and business integration costs. Offsetting these expense increases was a year-over-year
decline in other intangible expense of $36 million (28.8 percent), reflecting the elimination of mortgage
servicing rights amortization and impairment due to the adoption of SFAS 156.
Noninterest expense in the third quarter of 2006 was higher than the second quarter of 2006 by $8
million (.5 percent). The increase in noninterest expense in the third quarter of 2006 from the second quarter
of 2006 was primarily due to operating costs from acquired businesses and other business development
(MORE)
11. U.S. Bancorp Reports Third Quarter 2006 Results
October 17, 2006
Page 11
initiatives. Partially offsetting these increases was a decline of $11 million due to debt prepayment expense
recorded in the second quarter of 2006.
Provision for Income Taxes
The provision for income taxes for the third quarter of 2006 declined to an effective tax rate of 30.7
percent compared with an effective tax rate of 33.7 percent in the third quarter of 2005 and an effective tax
rate of 32.8 percent in second quarter of 2006. The decrease in the effective rate reflected an expected
increase in income tax credits from tax-advantaged investments through the remainder of the year.
(MORE)
12. U.S. Bancorp Reports Third Quarter 2006 Results
October 17, 2006
Page 12
ALLO WANCE FO R CREDIT LO S S ES Table 8
($ in millions) 3Q 2Q 1Q 4Q 3Q
2006 2006 2006 2005 2005
Balance, beginning of p eriod $2,251 $2,251 $2,251 $2,258 $2,269
Net charge-offs
Commercial 18 13 5 15 7
Lease financing 3 7 7 7 16
T otal commercial 21 20 12 22 23
Commercial mortgages -- (1) 2 (1) 2
Construction and develop ment -- 1 -- -- (2)
T otal commercial real estate -- -- 2 (1) --
Residential mortgages 11 11 7 10 9
Credit card 56 50 46 86 63
Retail leasing 4 2 4 8 5
Home equity and second mortgages 12 13 12 21 14
Other retail 31 29 32 67 42
T otal retail 103 94 94 182 124
T otal net charge-offs 135 125 115 213 156
Provision for credit losses 135 125 115 205 145
Acquisitions and other changes 5 -- -- 1 --
Balance, end of p eriod $2,256 $2,251 $2,251 $2,251 $2,258
Comp onents
Allowance for loan losses $2,034 $2,039 $2,035 $2,041 $2,055
Liability for unfunded credit commitments 222 212 216 210 203
T otal allowance for credit losses $2,256 $2,251 $2,251 $2,251 $2,258
Gross charge-offs $195 $176 $175 $267 $229
Gross recoveries $60 $51 $60 $54 $73
Allowance as a p ercentage of
Period-end loans 1.56 1.59 1.62 1.63 1.65
Nonp erforming loans 476 500 432 414 413
Nonp erforming assets 392 409 364 350 351
Credit Quality
The allowance for credit losses was $2,256 million at September 30, 2006, compared with $2,251
million at June 30, 2006, and $2,258 million at September 30, 2005. The ratio of the allowance for credit
losses to period-end loans was 1.56 percent at September 30, 2006, compared with 1.59 percent at June 30,
2006, and 1.65 percent at September 30, 2005. The ratio of the allowance for credit losses to nonperforming
loans was 476 percent at September 30, 2006, compared with 500 percent at June 30, 2006, and 413 percent
at September 30, 2005. Total net charge-offs in the third quarter of 2006 were $135 million, compared with
(MORE)
13. U.S. Bancorp Reports Third Quarter 2006 Results
October 17, 2006
Page 13
the second quarter of 2006 net charge-offs of $125 million and the third quarter of 2005 net charge-offs of
$156 million. The year-over-year decrease in total net charge-offs was principally due to the impact of
changes in bankruptcy legislation that went into effect during the fourth quarter of 2005.
Commercial and commercial real estate loan net charge-offs remained relatively flat at $21 million in
the third quarter of 2006 (.11 percent of average loans outstanding) compared with $20 million (.11 percent
of average loans outstanding) in the second quarter of 2006 and $23 million (.13 percent of average loans
outstanding) in the third quarter of 2005. The Company expects commercial net charge-offs to increase
somewhat over the next several quarters, in part due to the timing and extent of commercial loan recoveries.
Retail loan net charge-offs were $103 million in the third quarter of 2006 compared with $94 million
in the second quarter of 2006 and $124 million in the third quarter of 2005. Retail loan net charge-offs
increased as compared with the second quarter of 2006, despite retail recoveries being higher than expected
in the current quarter, and declined from the third quarter of 2005, reflecting the impact of the bankruptcy
legislation change that occurred in the fourth quarter of 2005. Retail loan net charge-offs as a percent of
average loans outstanding were .87 percent in the third quarter of 2006, compared with .82 percent and 1.09
percent in the second quarter of 2006 and third quarter of 2005, respectively. The increase reflects a higher
level of bankruptcy-related charge-offs relative to the first and second quarters of 2006. The Company
anticipates that bankruptcy charge-offs will continue to increase to more normalized levels during the next
several quarters.
(MORE)
14. U.S. Bancorp Reports Third Quarter 2006 Results
October 17, 2006
Page 14
CREDIT RATIO S Table 9
(Percent) 3Q 2Q 1Q 4Q 3Q
2006 2006 2006 2005 2005
Net charge-offs ratios (a)
Commercial .18 .13 .05 .15 .07
Lease financing .23 .54 .56 .56 1.29
T otal commercial .18 .18 .11 .20 .21
Commercial mortgages -- (.02) .04 (.02) .04
Construction and develop ment -- .05 -- -- (.10)
T otal commercial real estate -- -- .03 (.01) --
Residential mortgages .21 .21 .14 .20 .19
Credit card 2.85 2.72 2.62 5.00 3.74
Retail leasing .22 .11 .22 .43 .27
Home equity and second mortgages .31 .35 .33 .56 .37
Other retail .72 .70 .78 1.64 1.04
T otal retail .87 .82 .83 1.59 1.09
T otal net charge-offs .37 .36 .33 .61 .46
Delinquent loan ratios - 90 day s or more p ast due e xcluding nonp erforming loans (b)
Commercial .06 .05 .05 .05 .04
Commercial real estate .01 -- -- -- .01
Residential mortgages .36 .30 .31 .32 .30
Retail .40 .38 .36 .36 .36
T otal loans .20 .19 .18 .18 .18
Delinquent loan ratios - 90 day s or more p ast due including nonp erforming loans (b)
Commercial .55 .58 .64 .69 .74
Commercial real estate .54 .40 .51 .55 .57
Residential mortgages .53 .49 .53 .55 .53
Retail .51 .50 .52 .50 .45
T otal loans .53 .51 .56 .58 .58
(a) annualized and calculat ed on average loan balances
(b) rat ios are expressed as a percent of ending loan balances
(MORE)
15. U.S. Bancorp Reports Third Quarter 2006 Results
October 17, 2006
Page 15
AS S ET Q UALITY Table 10
($ in millions)
S ep 30 Jun 30 Mar 31 Dec 31 S ep 30
2006 2006 2006 2005 2005
Nonp erforming loans
Commercial $192 $203 $219 $231 $265
Lease financing 39 38 41 42 35
T otal commercial 231 241 260 273 300
Commercial mortgages 114 88 123 134 144
Construction and develop ment 40 25 23 23 16
T otal commercial real estate 154 113 146 157 160
Residential mortgages 36 39 45 48 44
Retail 53 57 70 66 43
T otal nonp erforming loans 474 450 521 544 547
Other real estate 79 77 71 71 68
Other nonp erforming assets 22 23 27 29 29
T otal nonp erforming assets (a) $575 $550 $619 $644 $644
Accruing loans 90 day s or more p ast due $295 $264 $251 $253 $242
Restructured loans that continue
to accrue interest $369 $370 $371 $315 $301
Nonp erforming assets to loans
p lus ORE (%) .40 .39 .45 .47 .47
(a) does not include accruing loans 90 days or m ore past due or rest ruct ured loans t hat cont inue t o accrue int erest
Nonperforming assets at September 30, 2006, totaled $575 million, compared with $550 million at
June 30, 2006, and $644 million at September 30, 2005. The ratio of nonperforming assets to loans and
other real estate was .40 percent at September 30, 2006, .39 percent at June 30, 2006, and .47 percent at
September 30, 2005. Restructured loans that continue to accrue interest have increased from the third
quarter of 2005, reflecting the impact of implementing higher minimum balance payment requirements for
credit card customers in response to industry guidance issued by the banking regulatory agencies.
(MORE)
16. U.S. Bancorp Reports Third Quarter 2006 Results
October 17, 2006
Page 16
CAPITAL PO S ITIO N Table 11
($ in millions) S e p 30 Jun 30 Mar 31 De c 31 S e p 30
2006 2006 2006 2005 2005
T otal shareholders' equity $20,926 $20,415 $20,256 $20,086 $19,864
T ier 1 cap ital 17,042 16,841 16,478 15,145 15,180
T otal risk-based cap ital 25,011 24,893 24,328 23,056 23,283
T ier 1 cap ital ratio 8.8 % 8.9 % 8.9 % 8.2 % 8.4 %
T otal risk-based cap ital ratio 13.0 13.1 13.1 12.5 12.8
Leverage ratio 8.3 8.2 8.2 7.6 7.7
Common equity to assets 9.2 9.1 9.2 9.6 9.6
T angible common equity to assets 5.4 5.6 5.4 5.9 6.2
Total shareholders’ equity was $20.9 billion at September 30, 2006, compared with $19.9 billion at
September 30, 2005. The increase was the result of corporate earnings and the issuance of $1.0 billion of
non-cumulative, perpetual preferred stock on March 27, 2006, partially offset by share buybacks and
dividends.
The Tier 1 capital ratio was 8.8 percent at September 30, 2006, compared with 8.9 percent at June
30, 2006, and 8.4 percent at September 30, 2005. The total risk-based capital ratio was 13.0 percent at
September 30, 2006, compared with 13.1 percent at June 30, 2006, and 12.8 percent at September 30, 2005.
The leverage ratio was 8.3 percent at September 30, 2006, compared with 8.2 percent at June 30, 2006, and
7.7 percent at September 30, 2005. Tangible common equity to assets was 5.4 percent at September 30,
2006, compared with 5.6 percent at June 30, 2006, and 6.2 percent at September 30, 2005. All regulatory
ratios continue to be in excess of stated “well capitalized” requirements.
(MORE)
17. U.S. Bancorp Reports Third Quarter 2006 Results
October 17, 2006
Page 17
CO MMO N S HARES Table 12
(M illions) 3Q 2Q 1Q 4Q 3Q
2006 2006 2006 2005 2005
Beginning shares outstanding 1,783 1,783 1,815 1,818 1,829
Shares issued for stock op tion and stock p urchase
p lans, acquisitions and other corp orate p urp oses 10 9 9 6 4
Shares rep urchased (30) (9) (41) (9) (15)
Ending shares outstanding 1,763 1,783 1,783 1,815 1,818
On December 21, 2004, the Board of Directors of U.S. Bancorp approved an authorization to repurchase
up to 150 million shares of outstanding common stock during the following 24 months. On August 3, 2006,
the Company announced that the Board of Directors approved an authorization to repurchase 150 million
shares of common stock through December 2008. This new authorization replaces the December 21, 2004,
share repurchase program. During the third quarter of 2006, the Company repurchased 30 million shares of
common stock. As of September 30, 2006, there were approximately 132 million shares remaining to be
repurchased under the current authorization.
(MORE)
18. U.S. Bancorp Reports Third Quarter 2006 Results
October 17, 2006
Page 18
LINE O F BUS INES S FINANCIAL PERFO RMANCE (a) Table 13
($ in millions)
Net Income Percent Change 3Q 2006
3Q 2Q 3Q 3Q 06 vs 3Q 06 vs YTD YTD Percent Earnings
Business Line 2006 2006 2005 2Q 06 3Q 05 2006 2005 Change Composition
Wholesale Banking $298 $304 $287 (2.0) 3.8 $907 $866 4.7 25 %
Consumer Banking 477 490 447 (2.7) 6.7 1,379 1,262 9.3 40
Wealth M anagement 147 149 122 (1.3) 20.5 433 349 24.1 12
Pay ment Services 252 251 207 .4 21.7 726 559 29.9 21
T reasury and Corp orate Sup p ort 29 7 91 nm (68.1) 112 310 (63.9) 2
Consolidated Comp any $1,203 $1,201 $1,154 .2 4.2 $3,557 $3,346 6.3 100 %
(a) prelim inary dat a
Lines of Business
Within the Company, financial performance is measured by major lines of business, which include
Wholesale Banking, Consumer Banking, Wealth Management, Payment Services, and Treasury and
Corporate Support. These operating segments are components of the Company about which financial
information is available and is evaluated regularly in deciding how to allocate resources and assess
performance. Noninterest expenses incurred by centrally managed operations or business lines that directly
support another business line’s operations are charged to the applicable business line based on its utilization
of those services primarily measured by the volume of customer activities, number of employees or other
relevant factors. These allocated expenses are reported as net shared services expense within noninterest
expense. Designations, assignments and allocations change from time to time as management systems are
enhanced, methods of evaluating performance or product lines change or business segments are realigned to
better respond to our diverse customer base. During 2006, certain organization and methodology changes
were made and, accordingly, prior period results have been restated and presented on a comparable basis.
Wholesale Banking offers lending, depository, treasury management and other financial services to
middle market, large corporate, commercial real estate, equipment finance, small-ticket leasing and public
sector clients, along with lending guaranteed by the Small Business Administration. Wholesale Banking
contributed $298 million of the Company’s net income in the third quarter of 2006, a 3.8 percent increase
over the same period of 2005 and a 2.0 percent decrease as compared with the second quarter of 2006. The
increase in Wholesale Banking’s third quarter 2006 contribution over the same quarter of 2005 was the result
of a favorable variance in total net revenue (2.2 percent). The favorable variance in total net revenue year-
(MORE)
19. U.S. Bancorp Reports Third Quarter 2006 Results
October 17, 2006
Page 19
over-year was the result of growth in total noninterest income (6.3 percent), driven by higher equity
investment revenue and commercial real estate production income, offset somewhat by lower syndication
and letter of credit fee revenue. Net interest income remained relatively flat as growth from average loan
balances and the margin benefit of deposits was offset by tighter credit spreads and a decline in average
deposit balances.
Wholesale Banking’s contribution to net income in the third quarter of 2006 compared with the second
quarter of 2006 was $6 million (2.0 percent) lower, due primarily to an unfavorable variance in total net
revenue (2.0 percent). Total net revenue was lower on a linked quarter basis due to a decrease in total
noninterest income of $7 million (3.1 percent) and lower net interest income, driven primarily by lower
average deposit balances and tightening credit spreads. Total noninterest income decreased due to lower
commercial leasing revenue and seasonally lower treasury management revenue.
Consumer Banking delivers products and services through banking offices, telephone servicing and
sales, on-line services, direct mail and ATMs. It encompasses community banking, metropolitan banking,
in-store banking, small business banking, consumer lending, mortgage banking, consumer finance,
workplace banking, student banking, and 24-hour banking. Consumer Banking contributed $477 million of
the Company’s net income in the third quarter of 2006, a 6.7 percent increase over the same period of 2005
and a 2.7 percent decrease from the prior quarter. The Company’s adoption of SFAS 156 reduced the
business line’s total net revenue and noninterest expense compared with the third quarter of 2005 by
approximately $36 million and $46 million, respectively. After consideration of the impact of adopting this
accounting standard, the favorable increase in contribution from a year ago was the result of core net revenue
growth (1.9 percent) and lower provision for credit losses (9.2 percent). Net interest income was higher
year-over-year primarily due to growth in average loan balances of 5.4 percent and the margin benefit of
deposits, somewhat offset by lower spreads on those assets given the competitive lending environment. Fee-
based revenues, excluding the impact of adopting SFAS 156, increased 1.2 percent reflecting strong growth
in deposit service charges (9.0 percent) due to increased transaction-related fees and net new checking
accounts, offset somewhat by lower investment product sales and end-of-term retail lease residual income.
Total noninterest expense in the third quarter of 2006 was lower compared with the same quarter of 2005
due to the elimination of mortgage servicing rights amortization under SFAS 156. In addition, there was a
favorable variance in net shared services expense (3.3 percent) partially offset by higher compensation and
employee benefit expense (3.3 percent) resulting from investments in the branch distribution network. A $6
(MORE)
20. U.S. Bancorp Reports Third Quarter 2006 Results
October 17, 2006
Page 20
million year-over-year decrease in net charge-offs (9.2 percent) resulted in the favorable variance in the
business line’s provision for credit losses.
The decrease in Consumer Banking’s contribution in the third quarter of 2006 from the second quarter
of 2006 was principally the result of growth in net interest income that was more than offset by lower fee-
based revenues and higher noninterest expense. The change in total net revenue was due primarily to an
increase in net interest income (1.9 percent) driven by average loan growth and the margin benefit of
deposits, partially offset by a reduction in total noninterest income (1.5 percent). The decline in total
noninterest income was primarily due to a decrease in mortgage banking revenue reflecting the impact of the
interest rate environment on production gains, partially offset by higher deposit service charges. Total
noninterest expense was higher on a linked quarter basis, primarily due to higher compensation costs in the
branch network and an increase in business development expense. The increase in the provision for credit
losses was due to a $5 million increase in net charge-offs, as bankruptcy related charge-offs continue to
return to more normalized levels.
Wealth Management provides trust, private banking, financial advisory, investment management,
insurance, custody and mutual fund servicing through six businesses: Private Client Group, Corporate Trust,
U.S. Bancorp Investments and Insurance, FAF Advisors, Institutional Trust and Custody and Fund Services.
Wealth Management contributed $147 million of the Company’s net income in the third quarter of 2006, a
20.5 percent increase over the same period of 2005 and a 1.3 percent decrease from the second quarter of
2006. The growth in the business line’s contribution in the third quarter of 2006 over the same quarter of
2005 was the result of core growth in net interest income and fee-based revenues and an acquired corporate
and institutional trust business. Net interest income was favorably impacted year-over-year by wider deposit
spreads and growth in average loan and deposit balances. Total noninterest income increased by 17.6
percent from the same quarter of 2005, primarily due to improved equity market conditions, incremental
growth in customer accounts and balances and the acquisition of the corporate and institutional trust business
of a large national bank. The increase in total noninterest expense was primarily due to the recent
acquisition. The decrease in the business line’s contribution in the third quarter of 2006, as compared with
the second quarter of 2006, was due primarily to seasonally lower trust and investment management fees
offset somewhat by lower production-based compensation costs.
Payment Services includes consumer and business credit cards, stored-value cards, debit cards,
corporate and purchasing card services, consumer lines of credit, ATM processing and merchant processing.
(MORE)
21. U.S. Bancorp Reports Third Quarter 2006 Results
October 17, 2006
Page 21
Payment Services contributed $252 million of the Company’s net income in the third quarter of 2006, a 21.7
percent increase from the same period of 2005 and a .4 percent increase from the second quarter of 2006.
The increase in Payment Services’ contribution in the third quarter of 2006 from the same period of 2005
was the result of higher total net revenue (14.1 percent) and a favorable variance in the provision for credit
losses (15.9 percent), partially offset by an increase in total noninterest expense (14.7 percent). The increase
in total net revenue year-over-year was due to growth in total noninterest income (16.1 percent) and net
interest income (6.5 percent), reflecting growth in higher yielding retail loan balances, partially offset by the
margin impact of noninterest-bearing corporate and purchasing card balances and intangibles related to
recent acquisitions. All revenue categories benefited from higher transaction volumes, rate changes and
business expansion initiatives. The growth in total noninterest expense year-over-year primarily reflected
new business initiatives, including costs associated with acquisitions and other business growth initiatives.
The decrease in the provision for credit losses was driven by lower net charge-offs, year-over-year,
reflecting the impact of changes in bankruptcy legislation in the fourth quarter of 2005.
The increase in Payment Services’ contribution in the third quarter of 2006 from the second quarter of
2006 was due to improved total noninterest income (2.8 percent), partially offset by increased provision for
credit losses (13.8 percent) and an increase in total noninterest expense (4.6 percent). The increase in
noninterest income was due to higher volumes in credit and debit card revenue and corporate payment
products revenue. An $8 million increase in net charge-offs drove the increase in the provision for credit
losses, as bankruptcy charge-offs continue to return to more normalized levels. The increase in total
noninterest expense was primarily due to the impact of acquisitions on various costs including compensation
and employee benefits and other intangible expense.
Treasury and Corporate Support includes the Company’s investment portfolios, funding, capital
management and asset securitization activities, interest rate risk management, the net effect of transfer
pricing related to average balances and the residual aggregate of those expenses associated with corporate
activities that are managed on a consolidated basis. In addition, prior to the adoption of SFAS 156, changes
in mortgage servicing rights valuations due to interest rate changes were managed at a corporate level and, as
such, reported within this business unit. Operational expenses incurred by Treasury and Corporate Support
on behalf of the other business lines are allocated back to the appropriate business unit, primarily based on
customer transaction volume and account activities, deposit balances and employee levels and are identified
as net shared services expense. Treasury and Corporate Support recorded net income of $29 million in the
(MORE)
22. U.S. Bancorp Reports Third Quarter 2006 Results
October 17, 2006
Page 22
third quarter of 2006, compared with net income of $91 million in the third quarter of 2005 and $7 million in
the second quarter of 2006. Net interest income decreased in the current quarter from the third quarter of
2005 by $167 million, reflecting the impact of a flatter yield curve and asset/liability management decisions
during the past year, including reducing the investment securities portfolio, changes in interest rate
derivative positions and the issuance of higher cost wholesale funding. The adverse impact of net interest
income was offset somewhat by growth in noninterest income from a year ago related to a $32 million gain
on the sale of equity interests in a card association and an increase in gains from the sale of certain corporate
real estate. Total noninterest expense increased $38 million primarily due to operating costs associated with
incremental investments in tax-advantaged projects relative to a year ago and business integration costs. The
favorable change in income taxes, compared with a year ago, resulted from expected income tax credits from
incremental tax-advantaged investments. Net income in the third quarter of 2006 was higher than the second
quarter of 2006 due to lower total noninterest expense ($21 million) primarily related to debt prepayment
expense recorded in the second quarter and a favorable change in income taxes ($38 million) reflecting the
increase in income tax credits. This improvement was partially offset by lower net interest income ($43
million) driven by the flatter yield curve and funding earning asset growth with wholesale funding.
Additional schedules containing more detailed information about the Company’s business line results
are available on the web at usbank.com or by calling Investor Relations at 612-303-0781.
(MORE)
23. U.S. Bancorp Reports Third Quarter 2006 Results
October 17, 2006
Page 23
CHAIRMAN AND CHIEF EXECUTIVE OFFICER, JERRY A. GRUNDHOFER, AND VICE
CHAIRMAN AND CHIEF FINANCIAL OFFICER, DAVID M. MOFFETT, WILL REVIEW THE
FINANCIAL RESULTS IN A PRE-RECORDED CALL ON TUESDAY, OCTOBER 17, 2006. The
call will be available by telephone or on the internet. The pre-recorded call will be available from
approximately 7:00 a.m. (CT) on Tuesday, October 17th through Tuesday, October 24th at 11:00 p.m.
(CT). To access the recorded call, please dial 800-839-8292. Participants calling from outside the
United States, please call 402-220-6069. Find the recorded call via the internet at usbank.com.
Minneapolis-based U.S. Bancorp (“USB”), with $217 billion in assets, is the 6th largest financial holding
company in the United States. The Company operates 2,462 banking offices and 4,943 ATMs, and provides
a comprehensive line of banking, brokerage, insurance, investment, mortgage, trust and payment services
products to consumers, businesses and institutions. U.S. Bancorp is the parent company of U.S. Bank. Visit
U.S. Bancorp on the web at usbank.com.
Forward-Looking Statements
The following information appears in accordance with the Private Securities Litigation Reform Act of 1995:
This press release contains forward-looking statements about U.S. Bancorp. Statements that are not
historical or current facts, including statements about beliefs and expectations, are forward-looking
statements. These statements often include the words “may,” “could,” “would,” “should,” “believes,”
“expects,” “anticipates,” “estimates,” “intends,” “plans,” “targets,” “potentially,” “probably,” “projects,”
“outlook” or similar expressions. These forward-looking statements cover, among other things, anticipated
future revenue and expenses and the future plans and prospects of the Company. Forward-looking
statements involve inherent risks and uncertainties, and important factors could cause actual results to differ
materially from those anticipated, including changes in general business and economic conditions, changes
in interest rates, legal and regulatory developments, increased competition from both banks and non-banks,
changes in customer behavior and preferences, effects of mergers and acquisitions and related integration,
and effects of critical accounting policies and judgments. For discussion of these and other risks that may
cause actual results to differ from expectations, refer to our Annual Report on Form 10-K for the year ended
December 31, 2005, on file with the SEC, including the sections entitled “Risk Factors” and “Corporate Risk
Profile.” Forward-looking statements speak only as of the date they are made, and the Company undertakes
no obligation to update them in light of new information or future events.
###
(MORE)
24. U.S. Bancorp
Consolidated Statement of Income
Three Months Ended Nine Months Ended
(Dollars and Shares in Millions, Except Per Share Data) September 30, September 30,
(Unaudited) 2006 2005 2006 2005
Interest Income
Loans $2,569 $2,167 $7,350 $6,105
Loans held for sale 40 30 99 75
Investment securities 500 492 1,490 1,454
Other interest income 40 29 119 84
Total interest income 3,149 2,718 9,058 7,718
Interest Expense
Deposits 640 414 1,721 1,083
Short-term borrowings 321 205 861 460
Long-term debt 528 317 1,415 895
Total interest expense 1,489 936 3,997 2,438
Net interest income 1,660 1,782 5,061 5,280
Provision for credit losses 135 145 375 461
Net interest income after provision for credit losses 1,525 1,637 4,686 4,819
Noninterest Income
Credit and debit card revenue 206 185 590 516
Corporate payment products revenue 150 135 416 362
ATM processing services 63 64 183 168
Merchant processing services 253 200 719 576
Trust and investment management fees 305 251 916 751
Deposit service charges 268 246 764 690
Treasury management fees 111 109 334 333
Commercial products revenue 100 103 311 299
Mortgage banking revenue 68 111 167 323
Investment products fees and commissions 34 37 114 115
Securities gains (losses), net -- 1 3 (57)
Other 190 134 600 423
Total noninterest income 1,748 1,576 5,117 4,499
Noninterest Expense
Compensation 632 603 1,892 1,782
Employee benefits 123 106 379 330
Net occupancy and equipment 168 162 494 475
Professional services 54 44 130 119
Marketing and business development 58 61 156 171
Technology and communications 128 118 372 337
Postage, printing and supplies 66 64 198 190
Other intangibles 89 125 263 377
Debt prepayment -- -- 11 54
Other 220 190 673 564
Total noninterest expense 1,538 1,473 4,568 4,399
Income before income taxes 1,735 1,740 5,235 4,919
Applicable income taxes 532 586 1,678 1,573
Net income $1,203 $1,154 $3,557 $3,346
Net income applicable to common equity $1,187 $1,154 $3,524 $3,346
Earnings per common share $.67 $.63 $1.98 $1.82
Diluted earnings per common share $.66 $.62 $1.95 $1.80
Dividends declared per common share $.33 $.30 $.99 $.90
Average common shares outstanding 1,771 1,823 1,784 1,836
Average diluted common shares outstanding 1,796 1,849 1,809 1,862
Page 24
25. U.S. Bancorp
Consolidated Ending Balance Sheet
September 30, December 31, September 30,
(Dollars in Millions) 2006 2005 2005
Assets (Unaudited) (Unaudited)
Cash and due from banks $6,355 $8,004 $6,918
Investment securities
Held-to-maturity 91 109 114
Available-for-sale 39,429 39,659 41,402
Loans held for sale 2,649 1,686 1,695
Loans
Commercial 46,594 42,942 43,237
Commercial real estate 28,973 28,463 28,521
Residential mortgages 21,215 20,730 19,469
Retail 47,626 45,671 45,400
Total loans 144,408 137,806 136,627
Less allowance for loan losses (2,034) (2,041) (2,055)
Net loans 142,374 135,765 134,572
Premises and equipment 1,835 1,841 1,850
Goodwill 7,444 7,005 6,372
Other intangible assets 3,171 2,874 2,586
Other assets 13,507 12,522 11,386
Total assets $216,855 $209,465 $206,895
Liabilities and Shareholders' Equity
Deposits
Noninterest-bearing $30,554 $32,214 $30,871
Interest-bearing 69,095 70,024 69,478
Time deposits greater than $100,000 21,312 22,471 20,446
Total deposits 120,961 124,709 120,795
Short-term borrowings 24,783 20,200 23,061
Long-term debt 41,230 37,069 36,257
Other liabilities 8,955 7,401 6,918
Total liabilities 195,929 189,379 187,031
Shareholders' equity
Preferred stock 1,000 -- --
Common stock 20 20 20
Capital surplus 5,770 5,907 5,913
Retained earnings 20,770 19,001 18,457
Less treasury stock (6,093) (4,413) (4,318)
Other comprehensive income (541) (429) (208)
Total shareholders' equity 20,926 20,086 19,864
Total liabilities and shareholders' equity $216,855 $209,465 $206,895
Page 25
27. U.S. Bancorp
Income Statement Highlights
Percent Change
Three Months Ended v. September 30, 2006
(Dollars and Shares in Millions, Except Per Share Data) September 30, June 30, September 30, June 30, September 30,
(Unaudited) 2006 2006 2005 2006 2005
Net interest income (taxable-equivalent basis) $1,673 $1,697 $1,791 (1.4) % (6.6) %
Noninterest income 1,748 1,755 1,576 (.4) 10.9
Total net revenue 3,421 3,452 3,367 (.9) 1.6
Noninterest expense 1,538 1,530 1,473 .5 4.4
Income before provision and income taxes 1,883 1,922 1,894 (2.0) (.6)
Provision for credit losses 135 125 145 8.0 (6.9)
Income before income taxes 1,748 1,797 1,749 (2.7) (.1)
Taxable-equivalent adjustment 13 11 9 18.2 44.4
Applicable income taxes 532 585 586 (9.1) (9.2)
Net income $1,203 $1,201 $1,154 .2 4.2
Net income applicable to common equity $1,187 $1,184 $1,154 .3 2.9
Diluted earnings per common share $.66 $.66 $.62 -- 6.5
Revenue per diluted common share (a) $1.90 $1.91 $1.82 (.5) 4.4
Financial Ratios
Net interest margin (b) 3.56 % 3.68 % 3.95 %
Interest yield on average loans (b) 7.16 6.99 6.38
Rate paid on interest-bearing liabilities 3.79 3.45 2.49
Return on average assets 2.23 2.27 2.23
Return on average common equity 23.6 24.3 22.8
Efficiency ratio (c) 45.0 44.4 43.8
Tangible efficiency ratio (d) 42.4 41.8 40.0
(a) Computed as the sum of net interest income on a taxable-equivalent basis and noninterest income excluding securities gains
(losses), net divided by average diluted common shares outstanding
(b) On a taxable-equivalent basis
(c) Computed as noninterest expense divided by the sum of net interest income on a taxable-equivalent basis and noninterest income
excluding securities gains (losses), net
(d) Computed as noninterest expense divided by the sum of net interest income on a taxable-equivalent basis and noninterest income
excluding securities gains (losses), net and intangible amortization
Page 27
28. U.S. Bancorp
Income Statement Highlights
Nine Months Ended
(Dollars and Shares in Millions, Except Per Share Data) September 30, September 30, Percent
(Unaudited) 2006 2005 Change
Net interest income (taxable-equivalent basis) $5,095 $5,303 (3.9) %
Noninterest income 5,117 4,499 13.7
Total net revenue 10,212 9,802 4.2
Noninterest expense 4,568 4,399 3.8
Income before provision and income taxes 5,644 5,403 4.5
Provision for credit losses 375 461 (18.7)
Income before income taxes 5,269 4,942 6.6
Taxable-equivalent adjustment 34 23 47.8
Applicable income taxes 1,678 1,573 6.7
Net income $3,557 $3,346 6.3
Net income applicable to common equity $3,524 $3,346 5.3
Diluted earnings per common share $1.95 $1.80 8.3
Revenue per diluted common share (a) $5.64 $5.29 6.6
Financial Ratios
Net interest margin (b) 3.68 % 4.00 %
Interest yield on average loans (b) 6.98 6.23
Rate paid on interest-bearing liabilities 3.45 2.23
Return on average assets 2.24 2.22
Return on average common equity 23.7 22.5
Efficiency ratio (c) 44.7 44.6
Tangible efficiency ratio (d) 42.2 40.8
(a) Computed as the sum of net interest income on a taxable-equivalent basis and noninterest income excluding securities gains
(losses), net divided by average diluted common shares outstanding
(b) On a taxable-equivalent basis
(c) Computed as noninterest expense divided by the sum of net interest income on a taxable-equivalent basis and noninterest income
excluding securities gains (losses), net
(d) Computed as noninterest expense divided by the sum of net interest income on a taxable-equivalent basis and noninterest income
excluding securities gains (losses), net and intangible amortization
Page 28
29. U.S. Bancorp
Quarterly Consolidated Statement of Income
Three Months Ended
(Dollars and Shares in Millions, Except Per Share Data) September 30, June 30, March 31, December 31, September 30,
(Unaudited) 2006 2006 2006 2005 2005
Interest Income
Loans $2,569 $2,449 $2,332 $2,276 $2,167
Loans held for sale 40 33 26 31 30
Investment securities 500 500 490 500 492
Other interest income 40 36 43 26 29
Total interest income 3,149 3,018 2,891 2,833 2,718
Interest Expense
Deposits 640 578 503 476 414
Short-term borrowings 321 270 270 230 205
Long-term debt 528 484 403 352 317
Total interest expense 1,489 1,332 1,176 1,058 936
Net interest income 1,660 1,686 1,715 1,775 1,782
Provision for credit losses 135 125 115 205 145
Net interest income after provision for credit losses 1,525 1,561 1,600 1,570 1,637
Noninterest Income
Credit and debit card revenue 206 202 182 197 185
Corporate payment products revenue 150 139 127 126 135
ATM processing services 63 61 59 61 64
Merchant processing services 253 253 213 194 200
Trust and investment management fees 305 314 297 258 251
Deposit service charges 268 264 232 238 246
Treasury management fees 111 116 107 104 109
Commercial products revenue 100 107 104 101 103
Mortgage banking revenue 68 75 24 109 111
Investment products fees and commissions 34 42 38 37 37
Securities gains (losses), net -- 3 -- (49) 1
Other 190 179 231 170 134
Total noninterest income 1,748 1,755 1,614 1,546 1,576
Noninterest Expense
Compensation 632 627 633 601 603
Employee benefits 123 123 133 101 106
Net occupancy and equipment 168 161 165 166 162
Professional services 54 41 35 47 44
Marketing and business development 58 58 40 64 61
Technology and communications 128 127 117 129 118
Postage, printing and supplies 66 66 66 65 64
Other intangibles 89 89 85 81 125
Debt prepayment -- 11 -- -- --
Other 220 227 226 210 190
Total noninterest expense 1,538 1,530 1,500 1,464 1,473
Income before income taxes 1,735 1,786 1,714 1,652 1,740
Applicable income taxes 532 585 561 509 586
Net income $1,203 $1,201 $1,153 $1,143 $1,154
Net income applicable to common equity $1,187 $1,184 $1,153 $1,143 $1,154
Earnings per common share $.67 $.66 $.64 $.63 $.63
Diluted earnings per common share $.66 $.66 $.63 $.62 $.62
Dividends declared per common share $.33 $.33 $.33 $.33 $.30
Average common shares outstanding 1,771 1,781 1,801 1,816 1,823
Average diluted common shares outstanding 1,796 1,805 1,826 1,841 1,849
Financial Ratios
Net interest margin (a) 3.56 % 3.68 % 3.80 % 3.88 % 3.95 %
Interest yield on average loans (a) 7.16 6.99 6.79 6.57 6.38
Rate paid on interest-bearing liabilities 3.79 3.45 3.10 2.77 2.49
Return on average assets 2.23 2.27 2.23 2.18 2.23
Return on average common equity 23.6 24.3 23.3 22.6 22.8
Efficiency ratio (b) 45.0 44.4 44.9 43.3 43.8
Tangible efficiency ratio (c) 42.4 41.8 42.4 40.9 40.0
(a) On a taxable-equivalent basis
(b) Computed as noninterest expense divided by the sum of net interest income on a taxable-equivalent basis and noninterest income
excluding securities gains (losses), net
(c) Computed as noninterest expense divided by the sum of net interest income on a taxable-equivalent basis and noninterest income
excluding securities gains (losses), net and intangible amortization
Page 29