
Recommandé
Contenu connexe
Tendances
En vedette
En vedette (12)
Similaire à dominion resources GAAP Reconciliations and Footnotes
Similaire à dominion resources GAAP Reconciliations and Footnotes (20)
Plus de finance17
Plus de finance17 (20)
Dernier
Dernier (20)
dominion resources GAAP Reconciliations and Footnotes
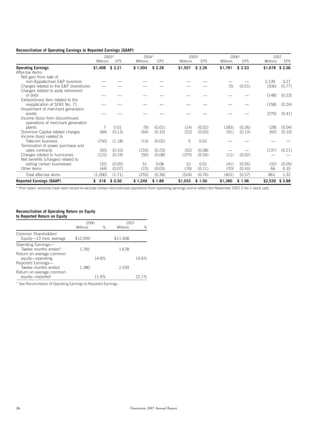
- 1. Reconciliation of Operating Earnings to Reported Earnings (GAAP) 2003* 2004* 2005* 2006* 2007 Millions EPS Millions EPS Millions EPS Millions EPS Millions EPS Operating Earnings $1,408 $ 2.21 $ 1,504 $ 2.28 $1,557 $ 2.26 $1,781 $ 2.53 $1,678 $ 2.56 After-tax items: Net gain from sale of non-Appalachian E&P business — — — — — — — — 2,139 3.27 Charges related to the E&P divestitures — — — — — — (5) (0.01) (506) (0.77) Charges related to early retirement of debt — — — — — — — — (148) (0.23) Extraordinary item related to the reapplication of SFAS No. 71 — — — — — — — — (158) (0.24) Impairment of merchant generation assets — — — — — — — — (270) (0.41) Income (loss) from discontinued operations of merchant generation plants 7 0.01 (9) (0.01) (14) (0.02) (183) (0.26) (28) (0.04) Dominion Capital related charges (84) (0.13) (64) (0.10) (22) (0.03) (91) (0.13) (65) (0.10) Income (loss) related to Telecom business (750) (1.18) (13) (0.02) 5 0.01 — — — — Termination of power purchase and sales contracts (65) (0.10) (155) (0.23) (52) (0.08) — — (137) (0.21) Charges related to hurricanes (122) (0.19) (50) (0.08) (375) (0.54) (11) (0.02) — — Net benefits (charges) related to exiting certain businesses (32) (0.05) 51 0.08 10 0.01 (41) (0.05) (32) (0.05) Other items (44) (0.07) (15) (0.03) (76) (0.11) (70) (0.10) 66 0.10 Total after-tax items (1,090) (1.71) (255) (0.39) (524) (0.76) (401) (0.57) 861 1.32 Reported Earnings (GAAP) $ 318 $ 0.50 $ 1,249 $ 1.89 $1,033 $ 1.50 $1,380 $ 1.96 $2,539 $ 3.88 * Prior years’ amounts have been recast to exclude certain discontinued operations from operating earnings and to reflect the November 2007 2-for-1 stock split. Reconciliation of Operating Return on Equity to Reported Return on Equity 2006 2007 Millions % Millions % Common Shareholders’ Equity—13 mos. average $12,059 $11,508 Operating Earnings— Twelve months ended* 1,781 1,678 Return on average common equity—operating 14.8% 14.6% Reported Earnings— Twelve months ended 1,380 2,539 Return on average common equity—reported 11.4% 22.1% * See Reconciliation of Operating Earnings to Reported Earnings. 26 Dominion 2007 Annual Report
- 2. Reconciliation of Operating ROIC to Reported ROIC 2006 2007 Millions % Millions % Invested capital—operating—13 mos. average $ 32,886 $ 29,113 Accumulated other comprehensive loss—13 mos. average (1,430) (190) Invested capital—reported—13 mos. average* 31,456 28,923 Operating Earnings—Twelve months ended** 1,781 1,678 Reported Earnings—Twelve months ended 1,380 2,539 Interest and related charges—operating (after-tax) 646 589 Charges related to debt tender offer (after-tax) — 143 Interest and related charges—reported (after-tax) 646 732 Operating Earnings & Interest and related charges (after-tax)— Twelve months ended 2,427 2,267 Return on invested capital—operating 7.4% 7.8% Reported Earnings & Interest and related charges (after-tax)— Twelve months ended 2,026 3,271 Return on invested capital—reported 6.4% 11.3% * Comprised of total debt, subsidiary preferred stock, and common shareholders’ equity. ** See Reconciliation of Operating Earnings to Reported Earnings. For factors that could cause actual results to differ, see Forward-Looking Statements, Risk Factors and Market Risk Sensitive Instruments and Risk Management in Management’s Discussion and Analysis of Financial Condition and Results of Operations. Dominion 2007 Annual Report 27