1. ATTACHMENT A
QWEST COMMUNICATIONS INTERNATIONAL INC.
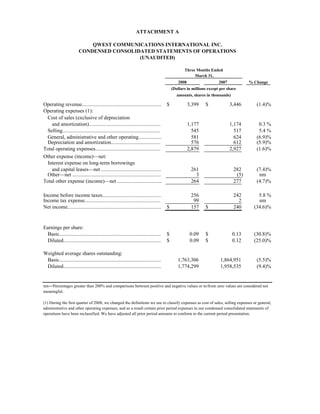
CONDENSED CONSOLIDATED STATEMENTS OF OPERATIONS
(UNAUDITED)
Three Months Ended
March 31,
2008 2007 % Change
(Dollars in millions except per share
amounts, shares in thousands)
Operating revenue............................................................. $ 3,399 $ 3,446 (1.4)%
Operating expenses (1):
Cost of sales (exclusive of depreciation
and amortization)....................................................... 1,177 1,174 0.3 %
Selling........................................................................... 545 517 5.4 %
General, administrative and other operating.................. 581 624 (6.9)%
Depreciation and amortization...................................... 576 612 (5.9)%
Total operating expenses.................................................. 2,879 2,927 (1.6)%
Other expense (income)—net:
Interest expense on long-term borrowings
and capital leases—net .............................................. 261 282 (7.4)%
Other—net .................................................................... 3 (5) nm
Total other expense (income)—net .................................. 264 277 (4.7)%
Income before income taxes............................................. 256 242 5.8 %
Income tax expense.......................................................... 99 2 nm
Net income........................................................................ $ 157 $ 240 (34.6)%
Earnings per share:
Basic.............................................................................. $ 0.09 $ 0.13 (30.8)%
Diluted........................................................................... $ 0.09 $ 0.12 (25.0)%
Weighted average shares outstanding:
Basic.............................................................................. 1,763,306 1,864,951 (5.5)%
Diluted........................................................................... 1,774,299 1,958,535 (9.4)%
nm—Percentages greater than 200% and comparisons between positive and negative values or to/from zero values are considered not
meaningful.
(1) During the first quarter of 2008, we changed the definitions we use to classify expenses as cost of sales, selling expenses or general,
administrative and other operating expenses, and as a result certain prior period expenses in our condensed consolidated statements of
operations have been reclassified. We have adjusted all prior period amounts to conform to the current period presentation.
2. ATTACHMENT B
QWEST COMMUNICATIONS INTERNATIONAL INC.
CONDENSED CONSOLIDATED BALANCE SHEETS
(UNAUDITED)
March 31, December 31,
2008 2007
(Dollars in millions)
ASSETS
Current assets:
Cash and cash equivalents................................................................. $ 634 $ 902
Other................................................................................................. 2,534 2,671
Total current assets............................................................................... 3,168 3,573
Property, plant and equipment—net and other..................................... 18,776 18,959
Total assets........................................................................................... $ 21,944 $ 22,532
LIABILITIES AND STOCKHOLDERS' EQUITY
Current liabilities:
Current portion of long-term borrowings ......................................... $ 852 $ 601
Accounts payable and other.............................................................. 3,072 3,608
Total current liabilities......................................................................... 3,924 4,209
Long-term borrowings—net................................................................. 13,402 13,650
Other..................................................................................................... 4,088 4,110
Total liabilities..................................................................................... 21,414 21,969
Stockholders' equity ............................................................................ 530 563
Total liabilities and stockholders' equity.............................................. $ 21,944 $ 22,532
3. ATTACHMENT C
QWEST COMMUNICATIONS INTERNATIONAL INC.
CONDENSED CONSOLIDATED STATEMENTS OF CASH FLOWS
(UNAUDITED)
Three Months Ended
March 31,
2008 2007
(Dollars in millions)
Cash provided by operating activities.................................................. $ 388 $ 268
Cash used for investing activities......................................................... (380) (308)
Cash used for financing activities......................................................... (276) (314)
Decrease in cash and cash equivalents................................................. $ (268) $ (354)
4. ATTACHMENT D
QWEST COMMUNICATIONS INTERNATIONAL INC.
SELECTED CONSOLIDATED DATA
(UNAUDITED)
Three Months Ended
March 31,
2008 2007 % Change
(Dollars in millions)
Operating revenue (1):
Segment revenue:
Business markets:
Voice services............................................................................. $ 375 $ 385 (2.6)%
Data and Internet services........................................................... 620 580 6.9 %
Total business markets................................................................... 995 965 3.1 %
Mass markets:
Voice services............................................................................. 1,020 1,083 (5.8)%
Data, Internet and video services................................................ 333 276 20.7 %
Wireless services........................................................................ 129 133 (3.0)%
Total mass markets........................................................................ 1,482 1,492 (0.7)%
Wholesale markets:
Voice services............................................................................. 465 539 (13.7)%
Data and Internet services........................................................... 376 365 3.0 %
Total wholesale markets................................................................. 841 904 (7.0)%
Total segment operating revenue....................................................... 3,318 3,361
Other revenue (primarily USF surcharges) ....................................... 81 85 (4.7)%
Total operating revenue ....................................................................... $ 3,399 $ 3,446 (1.4)%
Segment margins (1):
Business markets............................................................................... 38.1% 40.9%
Mass markets..................................................................................... 48.4% 48.3%
Wholesale markets............................................................................ 58.6% 55.6%
Capital expenditures (2):...................................................................... $ 416 $ 318 30.8 %
As of March 31,
2008 2007 % Change
(Amounts in thousands, except for
employees)
Operating metrics:
Total employees................................................................................. 36,519 38,011 (3.9)%
Access lines (1):
Business markets........................................................................... 2,758 2,853 (3.3)%
Mass markets................................................................................. 8,493 9,265 (8.3)%
Wholesale markets (3).................................................................... 1,246 1,433 (13.0)%
Total access lines............................................................................... 12,497 13,551 (7.8)%
Mass markets connections:
Access lines (1):
Consumer primary lines.............................................................. 6,539 7,200 (9.2)%
Consumer additional lines.......................................................... 631 740 (14.7)%
Small business lines.................................................................... 1,323 1,325 (0.2)%
Total access lines........................................................................... 8,493 9,265 (8.3)%
Other connections:
Broadband subscribers (4).......................................................... 2,701 2,305 17.2 %
Video subscribers (4).................................................................. 699 491 42.4 %
Wireless subscribers................................................................... 816 812 0.5 %
Total other connections.................................................................. 4,216 3,608 16.9 %
Total mass markets connections........................................................ 12,709 12,873 (1.3)%
Three Months Ended
March 31,
2008 2007 % Change
Consumer ARPU (in dollars) (5):...................................................... $ 55 $ 51 7.8 %
Wholesale minutes of use from carriers and CLECs (in millions)..... 10,431 11,690 (10.8)%
5. ATTACHMENT D
(CONTINUED)
QWEST COMMUNICATIONS INTERNATIONAL INC.
SELECTED CONSOLIDATED DATA
(UNAUDITED)
(1) During the first quarter of 2008, we changed our segments. Our new segments are business markets, mass markets and wholesale markets.
We centrally manage revenue from USF (Universal Service Fund) surcharges, consequently, it is not assigned to any of our segments. We have
adjusted all prior period revenue amounts to conform to the current period presentation. We have also adjusted access line amounts to
conform to this new presentation.
(2) Capital expenditures exclude assets acquired through capital leases.
(3) Wholesale markets access lines include UNE (Unbundled Network Elements) lines.
(4) Broadband and video subscribers include certain business markets customers.
(5) Consumer ARPU (Average Revenue Per Unit) is measured as consumer revenue, which includes revenue from voice services, data,
Internet and video services, in the period divided by the average number of primary access lines for the period. We believe this metric can be a
useful measure of the revenue performance of our consumer business within our mass markets segment on a per-customer basis. We use
ARPU internally to assess the revenue performance of our consumer business within our mass markets segment and the impact on this
business of periodic customer initiatives and product roll-outs. ARPU is not a measure determined in accordance with accounting principles
generally accepted in the United States of America, or GAAP, and should not be considered as a substitute for our mass markets segment
revenue or any other measure determined in accordance with GAAP. During the first quarter of 2008, we revised the consumer ARPU
calculation to exclude Universal Service Fund revenue, which was previously reported in voice services revenue. This change is consistent
with our current presentation of segment revenue described above. We have adjusted all prior period amounts to conform to the current period
presentation.
6. ATTACHMENT E
QWEST COMMUNICATIONS INTERNATIONAL INC.
RECONCILIATION OF NON-GAAP FINANCIAL MEASURES
(UNAUDITED)
Three Months Ended
March 31,
2008 2007
(Dollars in millions)
Operating revenue.............................................................................................................. $ 3,399 $ 3,446
Cost of sales (exclusive of depreciation and amortization) .............................................. (1,177) (1,174)
Selling expenses................................................................................................................. (545) (517)
General, administrative and other operating expenses...................................................... (581) (624)
EBITDA (1)........................................................................................................................ $ 1,096 $ 1,131
EBITDA—as adjusted (1): ............................................................................................. $ 1,141 $ 1,171
Less: Legal reserve.......................................................................................................... — (40)
Less: Realignment, severance and related costs............................................................. (45) —
EBITDA (1):...................................................................................................................... 1,096 1,131
Depreciation and amortization........................................................................................ (576) (612)
Total other expense (income)—net ............................................................................... (264) (277)
Income tax expense......................................................................................................... (99) (2)
Net income...................................................................................................................... $ 157 $ 240
EBITDA margin—as adjusted (1):
EBITDA—as adjusted ................................................................................................... $ 1,141 $ 1,171
Divided by total operating revenue................................................................................. $ 3,399 $ 3,446
EBITDA margin—as adjusted ....................................................................................... 33.6% 34.0%
EBITDA margin (1):
EBITDA.......................................................................................................................... $ 1,096 $ 1,131
Divided by total operating revenue................................................................................. $ 3,399 $ 3,446
EBITDA margin.............................................................................................................. 32.2% 32.8%
Free cash flow from operations (2):
Cash provided by operating activities............................................................................. $ 388 $ 268
Less: expenditures for property, plant
and equipment and capitalized software.................................................................... (416) (318)
Free cash flow from operations....................................................................................... (28) (50)
Add: certain one-time settlement payments ................................................................... 84 200
Adjusted free cash flow from operations........................................................................ $ 56 $ 150
7. ATTACHMENT E
(CONTINUED)
QWEST COMMUNICATIONS INTERNATIONAL INC.
RECONCILIATION OF NON-GAAP FINANCIAL MEASURES
(UNAUDITED)
As of March 31,
2008 2007
(Dollars in millions)
Net debt (3):
Current portion of long-term borrowings....................................................................... $ 852 $ 1,688
Long-term borrowings—net............................................................................................ 13,402 13,199
Total borrowings—net.................................................................................................... 14,254 14,887
Less: cash and cash equivalents ..................................................................................... (634) (887)
Less: short-term investments........................................................................................... (48) (242)
Less: long-term investments........................................................................................... (118) —
Net debt........................................................................................................................... $ 13,454 $ 13,758
(1) EBITDA, EBITDA margin, EBITDA—as adjusted and EBITDA margin—as adjusted are non-GAAP financial measures. Other companies may calculate
these measures (or similarly titled measures) differently. We believe these measures provide useful information to investors in evaluating our capital-intensive
business because they reflect our operating performance before the impacts of non-cash items and are indicators of our ability to service debt, pay taxes and
fund discretionary spending such as capital expenditures. Management also uses EBITDA for a number of purposes, including setting targets for compensation
and assessing the performance of our operations.
(2) Free cash flow and adjusted free cash flow from operations are non-GAAP financial measures that indicate cash generated by our business after operating
expenses, capital expenditures, interest expense and income tax expense. We believe these measures provide useful information to our investors for purposes of
evaluating our ability to satisfy our debt and other mandatory payment obligations and because they reflect cash flows available for financing activities,
voluntary debt repayment and to strengthen our balance sheet. This is of particular relevance for our business given our significant debt balance. We also use
free cash flow and adjusted free cash flow from operations internally for a variety of purposes, including setting targets for compensation and budgeting our
cash needs. These measures are not determined in accordance with GAAP and should not be considered as a substitute for “income before income taxes” or
“cash provided by operating activities” or any other measure determined in accordance with GAAP. Due to the forward-looking nature of expected free cash
flow amounts for 2008, information to reconcile this non-GAAP financial measure is not available at this time.
(3) Net debt is a non-GAAP financial measure that we calculate as our total borrowings (current plus long-term) less our cash and cash equivalents and short-
and long-term investments. We believe net debt is helpful in analyzing our leverage, and management uses this measure in making decisions regarding
potential financings. Net debt is not a measure determined in accordance with GAAP and should not be considered as a substitute for “current portion of long-
term borrowings” or “long-term borrowings” or any other measure determined in accordance with GAAP.