SlideShare une entreprise Scribd logo
1  sur  9
Télécharger pour lire hors ligne
VIACOM REPORTS SECOND QUARTER 2008 RESULTS


                      •           Revenues Increased 21% to $3.86 Billion with Media Networks Up
                                  11% and Filmed Entertainment Up 35%
                      •           Operating Income Grew Double Digits
                      •           Net Earnings from Continuing Operations Grew 10% and Diluted EPS
                                  from Continuing Operations of $0.64 Rose 19% versus the Prior Year’s
                                  Adjusted Results
New York, New York, July 29, 2008 — Viacom Inc. (NYSE: VIA and VIA.B) today reported financial results for
the second quarter ended June 30, 2008.

Second Quarter 2008 Results

                                                                       Quarter Ended                        Six Months Ended
                                                                                             B/(W)                                  B/(W)
                                                                          June 30,                               June 30,
 (in millions, except per share amounts)                             2008          2007     2008 vs.       2008           2007     2008 vs.
                                                                                             2007                                   2007

 Revenues....................................................... $            $     3,186      21%                  $      5,904    18%
                                                                      3,857                            $    6,974
 Operating income .........................................                          702       13%                         1,143    19%
                                                                        792                                 1,359
 Net earnings from continuing operations.....                                        433        (6%)                        635      6%
                                                                        406                                  676
 Diluted EPS from continuing operations .....                                        0.63        2%                         0.92    15%
                                                                       0.64                                  1.06
 Net earnings..................................................                      434        (6%)                        637      6%
                                                                        407                                  677
 Diluted EPS .................................................. $             $      0.63        3%                 $       0.92    16%
                                                                       0.65                            $     1.07


Revenues grew 21% to $3.86 billion in the second quarter 2008 led by a 35% increase in Filmed Entertainment
revenues. Operating income increased 13% versus a year ago to $792 million, or 11% over the prior year’s adjusted
results. Net earnings from continuing operations declined 6% to $406 million with diluted earnings per share (EPS)
of $0.64, which compares with second quarter 2007 results that include the net impact of the gain on the sale of
MTV Russia and restructuring and impairment charges. Net earnings from continuing operations rose 10% and
diluted EPS from continuing operations grew 19% to $0.64 compared with the adjusted second quarter 2007 results.
Adjustments are detailed in the Supplemental Disclosures at the end of this release.

Sumner M. Redstone, Executive Chairman of Viacom, said, “The strength of our brands, the breadth of our portfolio
and the proactive measures of our management team have helped Viacom deliver solid results overall in the second
quarter. Viacom has a strong financial position and we continue to build value for shareholders through our ongoing
share repurchase program.”

Philippe Dauman, President and Chief Executive Officer of Viacom, said, “Viacom delivered strong top and bottom
line results in the second quarter despite the challenges of a weakening economy and its impact on advertiser
spending. The advantages of our growing multiple revenue streams were evident in the quarter, as we delivered
double-digit growth in both our affiliate and ancillary revenues, led by the top-selling Rock Band music video game.
We are just beginning to develop this new franchise, which already has the largest music catalog of any music video
game and 18 million songs downloaded since launch. The recently announced Rock Band™ 2 will build on this
success and should produce meaningful bottom-line results next year.

“Paramount continues to excel at the box office, generating $1 billion in both domestic and international receipts in
record time this year and delivering significantly higher operating income. Driving Filmed Entertainment results in
the quarter were such global hits as Indiana Jones and the Kingdom of the Crystal Skull, DreamWorks Animation’s
Kung Fu Panda and the latest new franchise released by Paramount, Iron Man. Looking ahead, with a robust slate
of films scheduled for release and in development, Paramount is poised for continued long-term growth.

“We will continue to take appropriate steps to adjust our cost structure while maintaining our investment in new
programming that will drive future revenue growth. As a result of these efforts, we will be extremely well
positioned to capitalize on the opportunities that will emerge as economic conditions improve.”

Revenues

 Revenues                                                Quarter Ended                                    Six Months Ended
                                                             June 30,                   B/(W)                  June 30,               B/(W)
 (in millions)                                          2008           2007          2008 vs. 2007       2008           2007       2008 vs. 2007

 Media Networks ........................... $                    $       1,922            11%        $            $       3,655         14%
                                                         2,136                                            4,153
 Filmed Entertainment ...................                                1,311            35%                             2,335         25%
                                                         1,771                                            2,917
 Eliminations..................................                           (47)           N/M                                (86)        N/M
                                                          (50)                                             (96)
     Total revenues ......................... $                  $       3,186            21%        $            $       5,904         18%
                                                         3,857                                            6,974

N/M = Not Meaningful

Second Quarter 2008 revenues of $3.86 billion grew 21% from $3.19 billion in 2007. Media Networks revenues
increased 11% to $2.14 billion led by worldwide ancillary revenue growth of 62% to $307 million, primarily driven
by strong sales of Rock Band. Worldwide affiliate revenues increased 12% to $656 million. Worldwide advertising
revenues grew 2% to $1.17 billion and domestic advertising revenues increased 1%, reflecting the impact of softness
in the overall domestic ad market. Filmed Entertainment revenues grew 35% to $1.77 billion in the quarter driven
by an 84% increase in theatrical revenues. This growth was primarily due to the box office success of Marvel’s Iron
Man, Indiana Jones and the Kingdom of the Crystal Skull and DreamWorks Animation’s Kung Fu Panda. Home
entertainment revenues grew by 12% due to higher third-party distribution revenues and increased revenues from
catalog titles, driven by the reissue of the first three Indiana Jones films. Television license fees rose 4% and
ancillary revenues grew 35%, primarily due to an increase in licensing and merchandising revenues from
Transformers.

Operating Income

 Operating Income                                          Quarter Ended                                  Six Months Ended
                                                              June 30,                  B/(W)                  June 30,                B/(W)
 (in millions)                                            2008           2007        2008 vs. 2007       2008           2007        2008 vs. 2007

 Media Networks ............................... $                    $   735              4%         $                $   1,336         9%
                                                          765                                            1,459
 Filmed Entertainment .......................                             22            291%                               (86)         N/M
                                                            86                                              23
 Corporate ..........................................                    (55)            (7%)                             (109)       (13%)
                                                          (59)                                            (123)
 Eliminations......................................                        -              -                                    2        N/M
                                                            -                                                -
     Total operating income ............... $                        $   702             13%         $                $   1,143        19%
                                                          792                                            1,359
N/M = Not Meaningful


Second Quarter 2008 operating income increased 13% to $792 million versus $702 million in the second quarter
of 2007. Media Networks operating income grew 4% to $765 million, including a one-percentage point benefit
related to prior year restructuring charges. Operating income was impacted by higher expenses in the current
quarter, principally related to distribution and marketing costs for Rock Band and programming amortization costs.

                                                                                 2
Operating income for the Filmed Entertainment segment increased $64 million to $86 million in the second quarter
due to the success of Iron Man as well as the mix and timing of theatrical releases.

Second Quarter 2008 net earnings of $407 million decreased $27 million, or 6% from 2007 reported results,
which included the impact of the gain on the sale of MTV Russia. Diluted earnings per share for the quarter were
$0.65, a 3% increase over reported EPS of $0.63 in the second quarter of 2007. Diluted EPS from continuing
operations were up 19% over the prior year’s adjusted results, reflecting operating income growth, a lower effective
tax rate and fewer shares outstanding pursuant to the Company’s stock repurchase program.

Business Outlook

For the three-year period from 2008 through 2010, Viacom expects to deliver low double-digit annual growth in
diluted earnings per share from continuing operations. This outlook is based on adjusted earnings and reflects
growth from 2007 adjusted diluted earnings per share from continuing operations of $2.36.

Stock Repurchase Program
For the quarter ended June 30, 2008, 12.2 million shares were repurchased for an aggregate purchase price of $446
million. As of July 28, 2008, the Company has $1.6 billion remaining in its existing $4 billion share repurchase
program.

Debt
At June 30, 2008, total debt outstanding, including capital lease obligations, increased to $9.24 billion, compared
with $8.25 billion at December 31, 2007.

About Viacom
Viacom, consisting of BET Networks, MTV Networks and Paramount Pictures, is the world’s leading entertainment
content company. It engages audiences on television, motion picture and digital platforms through many of the
world’s best known entertainment brands, including MTV, VH1, CMT, Logo, Rock Band, Nickelodeon, Noggin,
Nick at Nite, AddictingGames, Neopets, COMEDY CENTRAL, Spike TV, TV Land, Atom, Gametrailers, BET,
Paramount Pictures, DreamWorks Pictures and Paramount Vantage. Viacom’s global reach includes approximately
160 channels and 340 online properties in 160 countries and territories.

For more information about Viacom and its businesses, visit www.viacom.com.


                                                       3
Cautionary Statement Concerning Forward-Looking Statements
This news release contains both historical and forward-looking statements. All statements, including Business
Outlook, which are not statements of historical fact are, or may be deemed to be, forward-looking statements.
Forward-looking statements reflect the Company’s current expectations concerning future results, objectives, plans
and goals, and involve known and unknown risks, uncertainties and other factors that are difficult to predict and
which may cause actual results, performance or achievements to differ. These risks, uncertainties and other factors
include, among others: advertising market conditions; the public acceptance of and ratings for the Company’s
feature films, programs, digital services and other content, as well as related advertisements; competition for
advertising dollars; technological developments and their effect in the Company’s markets and on consumer
behavior; fluctuations in the Company’s results due to the timing, mix and availability of the Company’s
programming, films and other content; changes in the Federal communications laws and regulations; the impact of
piracy; the impact of increased scale in parties involved in the distribution and aggregation of the Company’s
products and program services to consumers and advertisers; the impact of union activity; other domestic and
global economic, business, competitive and/or regulatory factors affecting the Company’s businesses generally; and
other factors described in the Company’s news releases and filings with the Securities and Exchange Commission,
including but not limited to the Company’s 2007 Annual Report on Form 10-K and reports on Form 10-Q and Form
8-K. The forward-looking statements included in this document are made only as of the date of this document, and
the Company does not have any obligation to publicly update any forward-looking statements to reflect subsequent
events or circumstances.


Contacts
Press:                                                          Investors:
Carl Folta                                                      James Bombassei
Executive Vice President, Corporate Communications              Senior Vice President, Investor Relations
(212) 258-6352                                                  (212) 258-6377
carl.folta@viacom.com                                           james.bombassei@viacom.com

Kelly McAndrew                                                  Pamela Yi
Vice President, Corporate Communications                        Director, Investor Relations
(212) 846-7455                                                  (212) 846-7581
kelly.mcandrew@viacom.com                                       pamela.yi@viacom.com


                                                       4
VIACOM INC.
                                                        CONSOLIDATED STATEMENTS OF EARNINGS
                                                                     (Unaudited)


                                                                                                                          Quarter Ended        Six Months Ended
                                                                                                                            June 30,                June 30,
                                                                                                                      2008         2007            2008          2007
(in millions, except earnings per share amounts)

Revenues ..........................................................................................................                $ 3,186                  $ 5,904
                                                                                                                      $ 3,857                  $ 6,974
Expenses:
     Operating ................................................................................................                        1,766                     3,327
                                                                                                                          2,238                    4,047
     Selling, general and administrative.........................................................                                        620                     1,240
                                                                                                                            730                    1,379
                                                                                                                                          98                       194
     Depreciation and amortization................................................................                                                   189
                                                                                                                             97

                 Total expenses...............................................................................                         2,484                     4,761
                                                                                                                          3,065                    5,615

Operating income .............................................................................................                          702                      1,143
                                                                                                                            792                    1,359
     Interest expense, net ...............................................................................                             (114)                      (225)
                                                                                                                           (123)                    (240)
     Gain on sale of equity investment...........................................................                                       151                        151
                                                                                                                             —                        —
     Equity in (losses) earnings of investee companies..................................                                                  9                         13
                                                                                                                            (10)                     (16)
     Other items, net.......................................................................................                            (42)                       (45)
                                                                                                                            (12)                     (15)

Earnings from continuing operations before provision for income taxes
   and minority interest...................................................................................                             706                      1,037
                                                                                                                            647                    1,088

        Provision for income taxes .....................................................................                               (268)                      (394)
                                                                                                                           (237)                    (404)
                                                                                                                                         (5)                        (8)
        Minority interest, net of tax ....................................................................                                            (8)
                                                                                                                             (4)

Net earnings from continuing operations .........................................................                                       433                       635
                                                                                                                            406                      676
      Discontinued operations, net of tax ........................................................                                        1                         2
                                                                                                                              1                        1

Net earnings .....................................................................................................                 $    434                 $     637
                                                                                                                      $     407                $     677

Basic earnings per common share:
      Earnings per share, continuing operations ..............................................                                     $ 0.63                   $     0.92
                                                                                                                      $ 0.65                   $ 1.07
      Earnings per share, discontinued operations...........................................                                       $—                       $      —
                                                                                                                      $—                       $—
      Net earnings per share ............................................................................                          $ 0.63                   $     0.92
                                                                                                                      $ 0.65                   $ 1.07

Diluted earnings per common share:
      Earnings per share, continuing operations ..............................................                                     $ 0.63                   $     0.92
                                                                                                                      $ 0.64                   $ 1.06
      Earnings per share, discontinued operations...........................................                                       $—
                                                                                                                      $ 0.01                   $ 0.01       $      —
      Net earnings per share ............................................................................                          $ 0.63                   $     0.92
                                                                                                                      $ 0.65                   $ 1.07

Weighted average number of common shares outstanding:
    Basic .......................................................................................................                  686.4
                                                                                                                      629.2                    634.4            689.3
    Diluted ....................................................................................................                   687.8                        690.9
                                                                                                                      630.1                    635.5


                                                                                               5
VIACOM INC.
                                                         CONSOLIDATED BALANCE SHEETS
                                                                  (Unaudited)


                                                                                                                                                   December 31,
                                                                                                                                   June 30, 2008
                                                                                                                                                       2007
(in millions, except par value)
ASSETS
Current assets:
     Cash and cash equivalents................................................................................... $                                $      920
                                                                                                                                           737
     Receivables (includes retained interests in securitizations) ................................                                                      2,617
                                                                                                                                         2,135
     Inventory .............................................................................................................                              727
                                                                                                                                           891
     Deferred tax assets, net .......................................................................................                                     248
                                                                                                                                           249
     Prepaid and other assets ......................................................................................                                      321
                                                                                                                                           353
             Total current assets ....................................................................................                                  4,833
                                                                                                                                         4,365
Property and equipment, net .........................................................................................                                   1,196
                                                                                                                                         1,253
Inventory.......................................................................................................................                        4,108
                                                                                                                                         4,442
Goodwill .......................................................................................................................                       11,375
                                                                                                                                        11,399
Intangibles, net .............................................................................................................                            684
                                                                                                                                           745
Other assets...................................................................................................................                           708
                                                                                                                                           684
Total assets ................................................................................................................... $                 $   22,904
                                                                                                                                        22,888
LIABILITIES AND STOCKHOLDERS’ EQUITY
Current liabilities:
     Accounts payable ................................................................................................ $                           $      497
                                                                                                                                           256
     Accrued expenses................................................................................................                                   1,563
                                                                                                                                         1,319
     Participants’ share and residuals .........................................................................                                        1,545
                                                                                                                                         1,299
     Program rights obligations ..................................................................................                                        370
                                                                                                                                           395
     Deferred revenue.................................................................................................                                    406
                                                                                                                                           357
     Financing obligations ..........................................................................................                                     187
                                                                                                                                           171
     Other liabilities....................................................................................................                                705
                                                                                                                                           625
             Total current liabilities...............................................................................                                   5,273
                                                                                                                                         4,422
Financing obligations ...................................................................................................                               8,059
                                                                                                                                         9,072
Participants’ share and residuals...................................................................................                                      285
                                                                                                                                           303
Program rights obligations............................................................................................                                    533
                                                                                                                                           539
Deferred tax liabilities, net ...........................................................................................                                 105
                                                                                                                                            62
Other liabilities .............................................................................................................                         1,501
                                                                                                                                         1,452
Minority interests..........................................................................................................                               37
                                                                                                                                            44
Commitments and contingencies
Stockholders’ equity:
      Class A Common stock, par value $0.001, 375.0 authorized; 57.4 and 57.4
                                                                                                                                                          —
                                                                                                                                            —
         outstanding, respectively ................................................................................
      Class B Common stock, par value $0.001, 5,000.0 authorized; 565.4 and
                                                                                                                                                             1
                                                                                                                                              1
         587.4 outstanding, respectively ......................................................................
      Additional paid-in capital....................................................................................                                     8,079
                                                                                                                                          8,123
      Treasury stock .....................................................................................................                             (4,502)
                                                                                                                                        (5,362)
      Retained earnings................................................................................................                                  3,407
                                                                                                                                          4,084
      Accumulated other comprehensive income ........................................................                                                      126
                                                                                                                                            148
                  Total stockholders’ equity .........................................................................                                  7,111
                                                                                                                                         6,994
Total liabilities and stockholders’ equity...................................................................... $                                 $   22,904
                                                                                                                                        22,888


                                                                                      6
VIACOM INC.
               SUPPLEMENTAL DISCLOSURES REGARDING NON-GAAP FINANCIAL INFORMATION


      The following tables reconcile the Company’s results for the six months ended June 30, 2008 and the quarter and six
      months ended June 30, 2007 to adjusted results that exclude the impact of impairments of minority investments,
      Media Networks restructuring activities and a realized gain on the sale of the Company’s non-controlling investment
      in MTV Russia. The Company uses adjusted operating income, adjusted net earnings and adjusted diluted EPS
      among other things, to evaluate the Company’s operating performance in the absence of these items and for
      planning and forecasting of future periods. The Company believes that the adjusted results provide relevant and
      useful information for investors because it allows investors to view performance in a manner similar to the method
      used by the Company’s management, improves their ability to understand the Company’s operating performance
      and makes it easier to compare the Company’s results with other companies. Since adjusted operating income,
      adjusted net earnings and adjusted diluted EPS are not measures of performance calculated in accordance with
      GAAP, they should not be considered in isolation of, or as a substitute for operating income, net earnings and
      diluted EPS as indicators of operating performance and they may not be comparable to similarly titled measures
      employed by other companies.


                                                                                                      Quarter Ended
                                                                                                      June 30, 2008


No adjustments to reported results.


                                                                                                    Six Months Ended
(in millions, except per share amounts)                                                               June 30, 2008

                                                                                              Pre-tax        Net Earnings    Diluted EPS
                                                                                           Earnings from         from            from
                                                                         Operating          Continuing        Continuing     Continuing
                                                                                            Operations(1)    Operations(2)
                                                                          Income                                             Operations

Reported results............................................................... $ 1,359        $    1,088          $   676      $   1.06
Adjustments:
    Impairment of investment(3) ..................................                     -               12               12          0.02
Adjusted results .............................................................   $ 1,359        $   1,100          $   688      $   1.08


                                                                                 7
Quarter Ended
(in millions, except per share amounts)                                                                        June 30, 2007

                                                                                                     Pre-tax           Net Earnings              Diluted EPS
                                                                                                  Earnings from            from                      from
                                                                                  Operating        Continuing           Continuing               Continuing
                                                                                                  Operations(1)        Operations(2)
                                                                                   Income                                                        Operations

Reported results...............................................................     $       702           $    706             $     433              $         0.63
Adjustments:
     Media Networks restructuring activities(4) .........                                  11                  11                       8                    0.01
     Gain on sale of equity investment(5) ..................                                -               (151)                    (94)                  (0.13)
     Impairment of investment(6) ...............................                            -                  36                      22                    0.03
Adjusted results ..............................................................         $ 713             $ 602                $      369             $      0.54


                                                                                                              Six Months Ended
(in millions, except per share amounts)                                                                         June 30, 2007

                                                                                                     Pre-tax           Net Earnings              Diluted EPS
                                                                                                  Earnings from            from                      from
                                                                                  Operating        Continuing           Continuing               Continuing
                                                                                                  Operations(1)        Operations(2)
                                                                                   Income                                                        Operations

Reported results............................................................... $       1,143         $       1,037            $     635              $         0.92
Adjustments:
     Media Networks restructuring activities(4) .........                                  67                    67                    42                    0.06
     Gain on sale of equity investment(5) ..................                                -                 (151)                  (94)                  (0.13)
     Impairment of investment(6) ...............................                            -                    36                    22                    0.03
Adjusted results .............................................................. $       1,210         $         989            $      605             $      0.88

            Pre-tax earnings represent earnings from continuing operations before provision for income taxes and minority interest.
      (1)
            The tax impact of adjustments has been calculated where appropriate using the applicable rates in effect for the period presented.
      (2)
      (3)   2008 adjusted results for the six months ended June 30, 2008 exclude a $12 million non-cash impairment of an investment in which the Company
            holds a minority interest.
      (4)   2007 adjusted results exclude $11 million and $67 million, respectively, of expenses related to Media Networks restructuring charges, principally
            severance, affecting MTV Networks domestic and international operations for the quarter and six months ended June 30, 2007.
      (5)   The Company sold its non-controlling investment in MTV Russia for $191 million and recognized a pre-tax gain of $151 million.
      (6)   The Company recorded a pre-tax non-cash impairment charge of $36 million to write off its investment in Amp’d Mobile which filed for bankruptcy.


                                                                                        8
The Company's business outlook is based on 2007 adjusted diluted earnings per share from continuing operations of
     $2.36. The following table reconciles the Company’s results for the full year ended December 31, 2007 to the
     adjusted results that exclude the impact of restructuring activities, the realized gain on the sale of the Company’s
     non-controlling interest in MTV Russia, an impairment charge associated with the write-down of Amp’d Mobile and
     net discrete tax benefits.

                                                                                                            Year Ended
                                                                                                         December 31, 2007
                                                                                               Pre-tax              Net Earnings            Diluted EPS
                                                                                             Earnings from              from                    from
                                                                                    Operating Continuing              Continuing             Continuing
                                                                                              Operations(1)         Operations(2)
                                                                                     Income                                                  Operations
(in millions, except per share amounts)
                                                                                     $ 2,936  $ 2,580               $    1,630             $      2.41
Reported results ................................................................
Adjustments:
     Media Networks restructuring activities(3) ...............                              77         77                     49                   0.07
     Gain on sale of equity investment(4) .........................                                   (151)                   (95)                 (0.14)
                                                                                             —
     Impairment of investment(5) .....................................                       —          36                     23                   0.04
     Discrete tax benefits (6) .............................................                            —                     (15)                 (0.02)
                                                                                             —
Adjusted results ................................................................       $ 3,013   $   2,542         $      1,592           $        2.36


     (1)   Pre-tax earnings represent earnings from continuing operations before provision for income taxes and minority interest.
     (2)   The tax impact of adjustments has been calculated where appropriate using the applicable rates in effect for the period presented.
     (3)   2007 adjusted results exclude $77 million of expenses related to Media Networks restructuring charges, principally severance, affecting
           MTV Networks domestic and international operations.
     (4)   The Company sold its non-controlling investment in MTV Russia for $191 million and recognized a pre-tax gain of $151 million.
     (5)   The Company recorded a pre-tax non-cash impairment charge of $36 million to write off its investment in Amp’d Mobile which filed for
           bankruptcy.
     (6)   2007 adjusted results exclude net discrete tax benefits of $15 million, which were principally the result of audit settlements related to prior
           period tax returns.


                                                                                    9

Contenu connexe

Plus de finance20

pg& e crop 2008 VotingResults
pg& e crop 2008 VotingResultspg& e crop 2008 VotingResults
pg& e crop 2008 VotingResults
finance20
 
pg& e crop 2008 ProxyStatement
pg& e crop 2008 ProxyStatementpg& e crop 2008 ProxyStatement
pg& e crop 2008 ProxyStatement
finance20
 
pg & e crop 2004 Proxy Statement
pg & e crop 2004 Proxy Statementpg & e crop 2004 Proxy Statement
pg & e crop 2004 Proxy Statement
finance20
 
pg & e crop 2005 Proxy Statement
pg & e crop 2005 Proxy Statementpg & e crop 2005 Proxy Statement
pg & e crop 2005 Proxy Statement
finance20
 
pg & e crop 2006 Proxy Statement
pg & e crop 2006 Proxy Statementpg & e crop 2006 Proxy Statement
pg & e crop 2006 Proxy Statement
finance20
 
pg & e crop 2007 Proxy Statement
pg & e crop 2007 Proxy Statementpg & e crop 2007 Proxy Statement
pg & e crop 2007 Proxy Statement
finance20
 
pg & e crop 2008 Proxy Statement
pg & e crop 2008 Proxy Statementpg & e crop 2008 Proxy Statement
pg & e crop 2008 Proxy Statement
finance20
 
pg & e crop 2003 Annual Report
pg & e crop 2003 Annual Reportpg & e crop 2003 Annual Report
pg & e crop 2003 Annual Report
finance20
 
pg & e crop 2004 Annual Report
pg & e crop 2004 Annual Reportpg & e crop 2004 Annual Report
pg & e crop 2004 Annual Report
finance20
 
pg & e crop 2005 Annual Report
pg & e crop 2005 Annual Reportpg & e crop 2005 Annual Report
pg & e crop 2005 Annual Report
finance20
 
pg & e crop 2006 Annual Report
pg & e crop 2006 Annual Reportpg & e crop 2006 Annual Report
pg & e crop 2006 Annual Report
finance20
 
pg & e crop 2007 Annual Report
pg & e crop 2007 Annual Reportpg & e crop 2007 Annual Report
pg & e crop 2007 Annual Report
finance20
 
waste management Groundwater_Well
waste management Groundwater_Wellwaste management Groundwater_Well
waste management Groundwater_Well
finance20
 
waste management Gas_Probe
waste management Gas_Probewaste management Gas_Probe
waste management Gas_Probe
finance20
 
waste management Anatomy of a Landfill
waste management Anatomy of a Landfillwaste management Anatomy of a Landfill
waste management Anatomy of a Landfill
finance20
 
waste management Waste By Rail
waste management Waste By Railwaste management Waste By Rail
waste management Waste By Rail
finance20
 
waste management Flyer
waste management Flyerwaste management Flyer
waste management Flyer
finance20
 
waste management Renewable_Energy_Brochure
waste management Renewable_Energy_Brochurewaste management Renewable_Energy_Brochure
waste management Renewable_Energy_Brochure
finance20
 
waste management WM RA FactSheet
waste management WM RA FactSheetwaste management WM RA FactSheet
waste management WM RA FactSheet
finance20
 
waste management 2003 annual
waste management 2003 annualwaste management 2003 annual
waste management 2003 annual
finance20
 

Plus de finance20 (20)

pg& e crop 2008 VotingResults
pg& e crop 2008 VotingResultspg& e crop 2008 VotingResults
pg& e crop 2008 VotingResults
 
pg& e crop 2008 ProxyStatement
pg& e crop 2008 ProxyStatementpg& e crop 2008 ProxyStatement
pg& e crop 2008 ProxyStatement
 
pg & e crop 2004 Proxy Statement
pg & e crop 2004 Proxy Statementpg & e crop 2004 Proxy Statement
pg & e crop 2004 Proxy Statement
 
pg & e crop 2005 Proxy Statement
pg & e crop 2005 Proxy Statementpg & e crop 2005 Proxy Statement
pg & e crop 2005 Proxy Statement
 
pg & e crop 2006 Proxy Statement
pg & e crop 2006 Proxy Statementpg & e crop 2006 Proxy Statement
pg & e crop 2006 Proxy Statement
 
pg & e crop 2007 Proxy Statement
pg & e crop 2007 Proxy Statementpg & e crop 2007 Proxy Statement
pg & e crop 2007 Proxy Statement
 
pg & e crop 2008 Proxy Statement
pg & e crop 2008 Proxy Statementpg & e crop 2008 Proxy Statement
pg & e crop 2008 Proxy Statement
 
pg & e crop 2003 Annual Report
pg & e crop 2003 Annual Reportpg & e crop 2003 Annual Report
pg & e crop 2003 Annual Report
 
pg & e crop 2004 Annual Report
pg & e crop 2004 Annual Reportpg & e crop 2004 Annual Report
pg & e crop 2004 Annual Report
 
pg & e crop 2005 Annual Report
pg & e crop 2005 Annual Reportpg & e crop 2005 Annual Report
pg & e crop 2005 Annual Report
 
pg & e crop 2006 Annual Report
pg & e crop 2006 Annual Reportpg & e crop 2006 Annual Report
pg & e crop 2006 Annual Report
 
pg & e crop 2007 Annual Report
pg & e crop 2007 Annual Reportpg & e crop 2007 Annual Report
pg & e crop 2007 Annual Report
 
waste management Groundwater_Well
waste management Groundwater_Wellwaste management Groundwater_Well
waste management Groundwater_Well
 
waste management Gas_Probe
waste management Gas_Probewaste management Gas_Probe
waste management Gas_Probe
 
waste management Anatomy of a Landfill
waste management Anatomy of a Landfillwaste management Anatomy of a Landfill
waste management Anatomy of a Landfill
 
waste management Waste By Rail
waste management Waste By Railwaste management Waste By Rail
waste management Waste By Rail
 
waste management Flyer
waste management Flyerwaste management Flyer
waste management Flyer
 
waste management Renewable_Energy_Brochure
waste management Renewable_Energy_Brochurewaste management Renewable_Energy_Brochure
waste management Renewable_Energy_Brochure
 
waste management WM RA FactSheet
waste management WM RA FactSheetwaste management WM RA FactSheet
waste management WM RA FactSheet
 
waste management 2003 annual
waste management 2003 annualwaste management 2003 annual
waste management 2003 annual
 

Dernier

VIP Call Girl in Mumbai 💧 9920725232 ( Call Me ) Get A New Crush Everyday Wit...
VIP Call Girl in Mumbai 💧 9920725232 ( Call Me ) Get A New Crush Everyday Wit...VIP Call Girl in Mumbai 💧 9920725232 ( Call Me ) Get A New Crush Everyday Wit...
VIP Call Girl in Mumbai 💧 9920725232 ( Call Me ) Get A New Crush Everyday Wit...
dipikadinghjn ( Why You Choose Us? ) Escorts
 
VIP Call Girl in Mira Road 💧 9920725232 ( Call Me ) Get A New Crush Everyday ...
VIP Call Girl in Mira Road 💧 9920725232 ( Call Me ) Get A New Crush Everyday ...VIP Call Girl in Mira Road 💧 9920725232 ( Call Me ) Get A New Crush Everyday ...
VIP Call Girl in Mira Road 💧 9920725232 ( Call Me ) Get A New Crush Everyday ...
dipikadinghjn ( Why You Choose Us? ) Escorts
 
( Jasmin ) Top VIP Escorts Service Dindigul 💧 7737669865 💧 by Dindigul Call G...
( Jasmin ) Top VIP Escorts Service Dindigul 💧 7737669865 💧 by Dindigul Call G...( Jasmin ) Top VIP Escorts Service Dindigul 💧 7737669865 💧 by Dindigul Call G...
( Jasmin ) Top VIP Escorts Service Dindigul 💧 7737669865 💧 by Dindigul Call G...
dipikadinghjn ( Why You Choose Us? ) Escorts
 
VIP Call Girl Service Andheri West ⚡ 9920725232 What It Takes To Be The Best ...
VIP Call Girl Service Andheri West ⚡ 9920725232 What It Takes To Be The Best ...VIP Call Girl Service Andheri West ⚡ 9920725232 What It Takes To Be The Best ...
VIP Call Girl Service Andheri West ⚡ 9920725232 What It Takes To Be The Best ...
dipikadinghjn ( Why You Choose Us? ) Escorts
 

Dernier (20)

Gurley shaw Theory of Monetary Economics.
Gurley shaw Theory of Monetary Economics.Gurley shaw Theory of Monetary Economics.
Gurley shaw Theory of Monetary Economics.
 
Mira Road Awesome 100% Independent Call Girls NUmber-9833754194-Dahisar Inter...
Mira Road Awesome 100% Independent Call Girls NUmber-9833754194-Dahisar Inter...Mira Road Awesome 100% Independent Call Girls NUmber-9833754194-Dahisar Inter...
Mira Road Awesome 100% Independent Call Girls NUmber-9833754194-Dahisar Inter...
 
Call Girls in New Friends Colony Delhi 💯 Call Us 🔝9205541914 🔝( Delhi) Escort...
Call Girls in New Friends Colony Delhi 💯 Call Us 🔝9205541914 🔝( Delhi) Escort...Call Girls in New Friends Colony Delhi 💯 Call Us 🔝9205541914 🔝( Delhi) Escort...
Call Girls in New Friends Colony Delhi 💯 Call Us 🔝9205541914 🔝( Delhi) Escort...
 
The Economic History of the U.S. Lecture 30.pdf
The Economic History of the U.S. Lecture 30.pdfThe Economic History of the U.S. Lecture 30.pdf
The Economic History of the U.S. Lecture 30.pdf
 
Top Rated Pune Call Girls Viman Nagar ⟟ 6297143586 ⟟ Call Me For Genuine Sex...
Top Rated  Pune Call Girls Viman Nagar ⟟ 6297143586 ⟟ Call Me For Genuine Sex...Top Rated  Pune Call Girls Viman Nagar ⟟ 6297143586 ⟟ Call Me For Genuine Sex...
Top Rated Pune Call Girls Viman Nagar ⟟ 6297143586 ⟟ Call Me For Genuine Sex...
 
Vip Call US 📞 7738631006 ✅Call Girls In Sakinaka ( Mumbai )
Vip Call US 📞 7738631006 ✅Call Girls In Sakinaka ( Mumbai )Vip Call US 📞 7738631006 ✅Call Girls In Sakinaka ( Mumbai )
Vip Call US 📞 7738631006 ✅Call Girls In Sakinaka ( Mumbai )
 
The Economic History of the U.S. Lecture 18.pdf
The Economic History of the U.S. Lecture 18.pdfThe Economic History of the U.S. Lecture 18.pdf
The Economic History of the U.S. Lecture 18.pdf
 
VIP Call Girl in Mumbai 💧 9920725232 ( Call Me ) Get A New Crush Everyday Wit...
VIP Call Girl in Mumbai 💧 9920725232 ( Call Me ) Get A New Crush Everyday Wit...VIP Call Girl in Mumbai 💧 9920725232 ( Call Me ) Get A New Crush Everyday Wit...
VIP Call Girl in Mumbai 💧 9920725232 ( Call Me ) Get A New Crush Everyday Wit...
 
00_Main ppt_MeetupDORA&CyberSecurity.pptx
00_Main ppt_MeetupDORA&CyberSecurity.pptx00_Main ppt_MeetupDORA&CyberSecurity.pptx
00_Main ppt_MeetupDORA&CyberSecurity.pptx
 
The Economic History of the U.S. Lecture 23.pdf
The Economic History of the U.S. Lecture 23.pdfThe Economic History of the U.S. Lecture 23.pdf
The Economic History of the U.S. Lecture 23.pdf
 
03_Emmanuel Ndiaye_Degroof Petercam.pptx
03_Emmanuel Ndiaye_Degroof Petercam.pptx03_Emmanuel Ndiaye_Degroof Petercam.pptx
03_Emmanuel Ndiaye_Degroof Petercam.pptx
 
Shrambal_Distributors_Newsletter_Apr-2024 (1).pdf
Shrambal_Distributors_Newsletter_Apr-2024 (1).pdfShrambal_Distributors_Newsletter_Apr-2024 (1).pdf
Shrambal_Distributors_Newsletter_Apr-2024 (1).pdf
 
VIP Call Girl in Mira Road 💧 9920725232 ( Call Me ) Get A New Crush Everyday ...
VIP Call Girl in Mira Road 💧 9920725232 ( Call Me ) Get A New Crush Everyday ...VIP Call Girl in Mira Road 💧 9920725232 ( Call Me ) Get A New Crush Everyday ...
VIP Call Girl in Mira Road 💧 9920725232 ( Call Me ) Get A New Crush Everyday ...
 
Booking open Available Pune Call Girls Wadgaon Sheri 6297143586 Call Hot Ind...
Booking open Available Pune Call Girls Wadgaon Sheri  6297143586 Call Hot Ind...Booking open Available Pune Call Girls Wadgaon Sheri  6297143586 Call Hot Ind...
Booking open Available Pune Call Girls Wadgaon Sheri 6297143586 Call Hot Ind...
 
TEST BANK For Corporate Finance, 13th Edition By Stephen Ross, Randolph Weste...
TEST BANK For Corporate Finance, 13th Edition By Stephen Ross, Randolph Weste...TEST BANK For Corporate Finance, 13th Edition By Stephen Ross, Randolph Weste...
TEST BANK For Corporate Finance, 13th Edition By Stephen Ross, Randolph Weste...
 
Indore Real Estate Market Trends Report.pdf
Indore Real Estate Market Trends Report.pdfIndore Real Estate Market Trends Report.pdf
Indore Real Estate Market Trends Report.pdf
 
( Jasmin ) Top VIP Escorts Service Dindigul 💧 7737669865 💧 by Dindigul Call G...
( Jasmin ) Top VIP Escorts Service Dindigul 💧 7737669865 💧 by Dindigul Call G...( Jasmin ) Top VIP Escorts Service Dindigul 💧 7737669865 💧 by Dindigul Call G...
( Jasmin ) Top VIP Escorts Service Dindigul 💧 7737669865 💧 by Dindigul Call G...
 
The Economic History of the U.S. Lecture 22.pdf
The Economic History of the U.S. Lecture 22.pdfThe Economic History of the U.S. Lecture 22.pdf
The Economic History of the U.S. Lecture 22.pdf
 
VIP Call Girl Service Andheri West ⚡ 9920725232 What It Takes To Be The Best ...
VIP Call Girl Service Andheri West ⚡ 9920725232 What It Takes To Be The Best ...VIP Call Girl Service Andheri West ⚡ 9920725232 What It Takes To Be The Best ...
VIP Call Girl Service Andheri West ⚡ 9920725232 What It Takes To Be The Best ...
 
(INDIRA) Call Girl Mumbai Call Now 8250077686 Mumbai Escorts 24x7
(INDIRA) Call Girl Mumbai Call Now 8250077686 Mumbai Escorts 24x7(INDIRA) Call Girl Mumbai Call Now 8250077686 Mumbai Escorts 24x7
(INDIRA) Call Girl Mumbai Call Now 8250077686 Mumbai Escorts 24x7
 

viacom Q2%202008%20Release%2007.29%20(final)

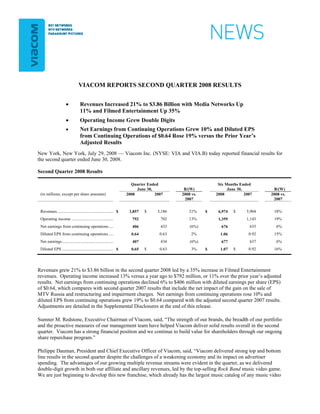
  • 1. VIACOM REPORTS SECOND QUARTER 2008 RESULTS • Revenues Increased 21% to $3.86 Billion with Media Networks Up 11% and Filmed Entertainment Up 35% • Operating Income Grew Double Digits • Net Earnings from Continuing Operations Grew 10% and Diluted EPS from Continuing Operations of $0.64 Rose 19% versus the Prior Year’s Adjusted Results New York, New York, July 29, 2008 — Viacom Inc. (NYSE: VIA and VIA.B) today reported financial results for the second quarter ended June 30, 2008. Second Quarter 2008 Results Quarter Ended Six Months Ended B/(W) B/(W) June 30, June 30, (in millions, except per share amounts) 2008 2007 2008 vs. 2008 2007 2008 vs. 2007 2007 Revenues....................................................... $ $ 3,186 21% $ 5,904 18% 3,857 $ 6,974 Operating income ......................................... 702 13% 1,143 19% 792 1,359 Net earnings from continuing operations..... 433 (6%) 635 6% 406 676 Diluted EPS from continuing operations ..... 0.63 2% 0.92 15% 0.64 1.06 Net earnings.................................................. 434 (6%) 637 6% 407 677 Diluted EPS .................................................. $ $ 0.63 3% $ 0.92 16% 0.65 $ 1.07 Revenues grew 21% to $3.86 billion in the second quarter 2008 led by a 35% increase in Filmed Entertainment revenues. Operating income increased 13% versus a year ago to $792 million, or 11% over the prior year’s adjusted results. Net earnings from continuing operations declined 6% to $406 million with diluted earnings per share (EPS) of $0.64, which compares with second quarter 2007 results that include the net impact of the gain on the sale of MTV Russia and restructuring and impairment charges. Net earnings from continuing operations rose 10% and diluted EPS from continuing operations grew 19% to $0.64 compared with the adjusted second quarter 2007 results. Adjustments are detailed in the Supplemental Disclosures at the end of this release. Sumner M. Redstone, Executive Chairman of Viacom, said, “The strength of our brands, the breadth of our portfolio and the proactive measures of our management team have helped Viacom deliver solid results overall in the second quarter. Viacom has a strong financial position and we continue to build value for shareholders through our ongoing share repurchase program.” Philippe Dauman, President and Chief Executive Officer of Viacom, said, “Viacom delivered strong top and bottom line results in the second quarter despite the challenges of a weakening economy and its impact on advertiser spending. The advantages of our growing multiple revenue streams were evident in the quarter, as we delivered double-digit growth in both our affiliate and ancillary revenues, led by the top-selling Rock Band music video game. We are just beginning to develop this new franchise, which already has the largest music catalog of any music video
  • 2. game and 18 million songs downloaded since launch. The recently announced Rock Band™ 2 will build on this success and should produce meaningful bottom-line results next year. “Paramount continues to excel at the box office, generating $1 billion in both domestic and international receipts in record time this year and delivering significantly higher operating income. Driving Filmed Entertainment results in the quarter were such global hits as Indiana Jones and the Kingdom of the Crystal Skull, DreamWorks Animation’s Kung Fu Panda and the latest new franchise released by Paramount, Iron Man. Looking ahead, with a robust slate of films scheduled for release and in development, Paramount is poised for continued long-term growth. “We will continue to take appropriate steps to adjust our cost structure while maintaining our investment in new programming that will drive future revenue growth. As a result of these efforts, we will be extremely well positioned to capitalize on the opportunities that will emerge as economic conditions improve.” Revenues Revenues Quarter Ended Six Months Ended June 30, B/(W) June 30, B/(W) (in millions) 2008 2007 2008 vs. 2007 2008 2007 2008 vs. 2007 Media Networks ........................... $ $ 1,922 11% $ $ 3,655 14% 2,136 4,153 Filmed Entertainment ................... 1,311 35% 2,335 25% 1,771 2,917 Eliminations.................................. (47) N/M (86) N/M (50) (96) Total revenues ......................... $ $ 3,186 21% $ $ 5,904 18% 3,857 6,974 N/M = Not Meaningful Second Quarter 2008 revenues of $3.86 billion grew 21% from $3.19 billion in 2007. Media Networks revenues increased 11% to $2.14 billion led by worldwide ancillary revenue growth of 62% to $307 million, primarily driven by strong sales of Rock Band. Worldwide affiliate revenues increased 12% to $656 million. Worldwide advertising revenues grew 2% to $1.17 billion and domestic advertising revenues increased 1%, reflecting the impact of softness in the overall domestic ad market. Filmed Entertainment revenues grew 35% to $1.77 billion in the quarter driven by an 84% increase in theatrical revenues. This growth was primarily due to the box office success of Marvel’s Iron Man, Indiana Jones and the Kingdom of the Crystal Skull and DreamWorks Animation’s Kung Fu Panda. Home entertainment revenues grew by 12% due to higher third-party distribution revenues and increased revenues from catalog titles, driven by the reissue of the first three Indiana Jones films. Television license fees rose 4% and ancillary revenues grew 35%, primarily due to an increase in licensing and merchandising revenues from Transformers. Operating Income Operating Income Quarter Ended Six Months Ended June 30, B/(W) June 30, B/(W) (in millions) 2008 2007 2008 vs. 2007 2008 2007 2008 vs. 2007 Media Networks ............................... $ $ 735 4% $ $ 1,336 9% 765 1,459 Filmed Entertainment ....................... 22 291% (86) N/M 86 23 Corporate .......................................... (55) (7%) (109) (13%) (59) (123) Eliminations...................................... - - 2 N/M - - Total operating income ............... $ $ 702 13% $ $ 1,143 19% 792 1,359 N/M = Not Meaningful Second Quarter 2008 operating income increased 13% to $792 million versus $702 million in the second quarter of 2007. Media Networks operating income grew 4% to $765 million, including a one-percentage point benefit related to prior year restructuring charges. Operating income was impacted by higher expenses in the current quarter, principally related to distribution and marketing costs for Rock Band and programming amortization costs. 2
  • 3. Operating income for the Filmed Entertainment segment increased $64 million to $86 million in the second quarter due to the success of Iron Man as well as the mix and timing of theatrical releases. Second Quarter 2008 net earnings of $407 million decreased $27 million, or 6% from 2007 reported results, which included the impact of the gain on the sale of MTV Russia. Diluted earnings per share for the quarter were $0.65, a 3% increase over reported EPS of $0.63 in the second quarter of 2007. Diluted EPS from continuing operations were up 19% over the prior year’s adjusted results, reflecting operating income growth, a lower effective tax rate and fewer shares outstanding pursuant to the Company’s stock repurchase program. Business Outlook For the three-year period from 2008 through 2010, Viacom expects to deliver low double-digit annual growth in diluted earnings per share from continuing operations. This outlook is based on adjusted earnings and reflects growth from 2007 adjusted diluted earnings per share from continuing operations of $2.36. Stock Repurchase Program For the quarter ended June 30, 2008, 12.2 million shares were repurchased for an aggregate purchase price of $446 million. As of July 28, 2008, the Company has $1.6 billion remaining in its existing $4 billion share repurchase program. Debt At June 30, 2008, total debt outstanding, including capital lease obligations, increased to $9.24 billion, compared with $8.25 billion at December 31, 2007. About Viacom Viacom, consisting of BET Networks, MTV Networks and Paramount Pictures, is the world’s leading entertainment content company. It engages audiences on television, motion picture and digital platforms through many of the world’s best known entertainment brands, including MTV, VH1, CMT, Logo, Rock Band, Nickelodeon, Noggin, Nick at Nite, AddictingGames, Neopets, COMEDY CENTRAL, Spike TV, TV Land, Atom, Gametrailers, BET, Paramount Pictures, DreamWorks Pictures and Paramount Vantage. Viacom’s global reach includes approximately 160 channels and 340 online properties in 160 countries and territories. For more information about Viacom and its businesses, visit www.viacom.com. 3
  • 4. Cautionary Statement Concerning Forward-Looking Statements This news release contains both historical and forward-looking statements. All statements, including Business Outlook, which are not statements of historical fact are, or may be deemed to be, forward-looking statements. Forward-looking statements reflect the Company’s current expectations concerning future results, objectives, plans and goals, and involve known and unknown risks, uncertainties and other factors that are difficult to predict and which may cause actual results, performance or achievements to differ. These risks, uncertainties and other factors include, among others: advertising market conditions; the public acceptance of and ratings for the Company’s feature films, programs, digital services and other content, as well as related advertisements; competition for advertising dollars; technological developments and their effect in the Company’s markets and on consumer behavior; fluctuations in the Company’s results due to the timing, mix and availability of the Company’s programming, films and other content; changes in the Federal communications laws and regulations; the impact of piracy; the impact of increased scale in parties involved in the distribution and aggregation of the Company’s products and program services to consumers and advertisers; the impact of union activity; other domestic and global economic, business, competitive and/or regulatory factors affecting the Company’s businesses generally; and other factors described in the Company’s news releases and filings with the Securities and Exchange Commission, including but not limited to the Company’s 2007 Annual Report on Form 10-K and reports on Form 10-Q and Form 8-K. The forward-looking statements included in this document are made only as of the date of this document, and the Company does not have any obligation to publicly update any forward-looking statements to reflect subsequent events or circumstances. Contacts Press: Investors: Carl Folta James Bombassei Executive Vice President, Corporate Communications Senior Vice President, Investor Relations (212) 258-6352 (212) 258-6377 carl.folta@viacom.com james.bombassei@viacom.com Kelly McAndrew Pamela Yi Vice President, Corporate Communications Director, Investor Relations (212) 846-7455 (212) 846-7581 kelly.mcandrew@viacom.com pamela.yi@viacom.com 4
  • 5. VIACOM INC. CONSOLIDATED STATEMENTS OF EARNINGS (Unaudited) Quarter Ended Six Months Ended June 30, June 30, 2008 2007 2008 2007 (in millions, except earnings per share amounts) Revenues .......................................................................................................... $ 3,186 $ 5,904 $ 3,857 $ 6,974 Expenses: Operating ................................................................................................ 1,766 3,327 2,238 4,047 Selling, general and administrative......................................................... 620 1,240 730 1,379 98 194 Depreciation and amortization................................................................ 189 97 Total expenses............................................................................... 2,484 4,761 3,065 5,615 Operating income ............................................................................................. 702 1,143 792 1,359 Interest expense, net ............................................................................... (114) (225) (123) (240) Gain on sale of equity investment........................................................... 151 151 — — Equity in (losses) earnings of investee companies.................................. 9 13 (10) (16) Other items, net....................................................................................... (42) (45) (12) (15) Earnings from continuing operations before provision for income taxes and minority interest................................................................................... 706 1,037 647 1,088 Provision for income taxes ..................................................................... (268) (394) (237) (404) (5) (8) Minority interest, net of tax .................................................................... (8) (4) Net earnings from continuing operations ......................................................... 433 635 406 676 Discontinued operations, net of tax ........................................................ 1 2 1 1 Net earnings ..................................................................................................... $ 434 $ 637 $ 407 $ 677 Basic earnings per common share: Earnings per share, continuing operations .............................................. $ 0.63 $ 0.92 $ 0.65 $ 1.07 Earnings per share, discontinued operations........................................... $— $ — $— $— Net earnings per share ............................................................................ $ 0.63 $ 0.92 $ 0.65 $ 1.07 Diluted earnings per common share: Earnings per share, continuing operations .............................................. $ 0.63 $ 0.92 $ 0.64 $ 1.06 Earnings per share, discontinued operations........................................... $— $ 0.01 $ 0.01 $ — Net earnings per share ............................................................................ $ 0.63 $ 0.92 $ 0.65 $ 1.07 Weighted average number of common shares outstanding: Basic ....................................................................................................... 686.4 629.2 634.4 689.3 Diluted .................................................................................................... 687.8 690.9 630.1 635.5 5
  • 6. VIACOM INC. CONSOLIDATED BALANCE SHEETS (Unaudited) December 31, June 30, 2008 2007 (in millions, except par value) ASSETS Current assets: Cash and cash equivalents................................................................................... $ $ 920 737 Receivables (includes retained interests in securitizations) ................................ 2,617 2,135 Inventory ............................................................................................................. 727 891 Deferred tax assets, net ....................................................................................... 248 249 Prepaid and other assets ...................................................................................... 321 353 Total current assets .................................................................................... 4,833 4,365 Property and equipment, net ......................................................................................... 1,196 1,253 Inventory....................................................................................................................... 4,108 4,442 Goodwill ....................................................................................................................... 11,375 11,399 Intangibles, net ............................................................................................................. 684 745 Other assets................................................................................................................... 708 684 Total assets ................................................................................................................... $ $ 22,904 22,888 LIABILITIES AND STOCKHOLDERS’ EQUITY Current liabilities: Accounts payable ................................................................................................ $ $ 497 256 Accrued expenses................................................................................................ 1,563 1,319 Participants’ share and residuals ......................................................................... 1,545 1,299 Program rights obligations .................................................................................. 370 395 Deferred revenue................................................................................................. 406 357 Financing obligations .......................................................................................... 187 171 Other liabilities.................................................................................................... 705 625 Total current liabilities............................................................................... 5,273 4,422 Financing obligations ................................................................................................... 8,059 9,072 Participants’ share and residuals................................................................................... 285 303 Program rights obligations............................................................................................ 533 539 Deferred tax liabilities, net ........................................................................................... 105 62 Other liabilities ............................................................................................................. 1,501 1,452 Minority interests.......................................................................................................... 37 44 Commitments and contingencies Stockholders’ equity: Class A Common stock, par value $0.001, 375.0 authorized; 57.4 and 57.4 — — outstanding, respectively ................................................................................ Class B Common stock, par value $0.001, 5,000.0 authorized; 565.4 and 1 1 587.4 outstanding, respectively ...................................................................... Additional paid-in capital.................................................................................... 8,079 8,123 Treasury stock ..................................................................................................... (4,502) (5,362) Retained earnings................................................................................................ 3,407 4,084 Accumulated other comprehensive income ........................................................ 126 148 Total stockholders’ equity ......................................................................... 7,111 6,994 Total liabilities and stockholders’ equity...................................................................... $ $ 22,904 22,888 6
  • 7. VIACOM INC. SUPPLEMENTAL DISCLOSURES REGARDING NON-GAAP FINANCIAL INFORMATION The following tables reconcile the Company’s results for the six months ended June 30, 2008 and the quarter and six months ended June 30, 2007 to adjusted results that exclude the impact of impairments of minority investments, Media Networks restructuring activities and a realized gain on the sale of the Company’s non-controlling investment in MTV Russia. The Company uses adjusted operating income, adjusted net earnings and adjusted diluted EPS among other things, to evaluate the Company’s operating performance in the absence of these items and for planning and forecasting of future periods. The Company believes that the adjusted results provide relevant and useful information for investors because it allows investors to view performance in a manner similar to the method used by the Company’s management, improves their ability to understand the Company’s operating performance and makes it easier to compare the Company’s results with other companies. Since adjusted operating income, adjusted net earnings and adjusted diluted EPS are not measures of performance calculated in accordance with GAAP, they should not be considered in isolation of, or as a substitute for operating income, net earnings and diluted EPS as indicators of operating performance and they may not be comparable to similarly titled measures employed by other companies. Quarter Ended June 30, 2008 No adjustments to reported results. Six Months Ended (in millions, except per share amounts) June 30, 2008 Pre-tax Net Earnings Diluted EPS Earnings from from from Operating Continuing Continuing Continuing Operations(1) Operations(2) Income Operations Reported results............................................................... $ 1,359 $ 1,088 $ 676 $ 1.06 Adjustments: Impairment of investment(3) .................................. - 12 12 0.02 Adjusted results ............................................................. $ 1,359 $ 1,100 $ 688 $ 1.08 7
  • 8. Quarter Ended (in millions, except per share amounts) June 30, 2007 Pre-tax Net Earnings Diluted EPS Earnings from from from Operating Continuing Continuing Continuing Operations(1) Operations(2) Income Operations Reported results............................................................... $ 702 $ 706 $ 433 $ 0.63 Adjustments: Media Networks restructuring activities(4) ......... 11 11 8 0.01 Gain on sale of equity investment(5) .................. - (151) (94) (0.13) Impairment of investment(6) ............................... - 36 22 0.03 Adjusted results .............................................................. $ 713 $ 602 $ 369 $ 0.54 Six Months Ended (in millions, except per share amounts) June 30, 2007 Pre-tax Net Earnings Diluted EPS Earnings from from from Operating Continuing Continuing Continuing Operations(1) Operations(2) Income Operations Reported results............................................................... $ 1,143 $ 1,037 $ 635 $ 0.92 Adjustments: Media Networks restructuring activities(4) ......... 67 67 42 0.06 Gain on sale of equity investment(5) .................. - (151) (94) (0.13) Impairment of investment(6) ............................... - 36 22 0.03 Adjusted results .............................................................. $ 1,210 $ 989 $ 605 $ 0.88 Pre-tax earnings represent earnings from continuing operations before provision for income taxes and minority interest. (1) The tax impact of adjustments has been calculated where appropriate using the applicable rates in effect for the period presented. (2) (3) 2008 adjusted results for the six months ended June 30, 2008 exclude a $12 million non-cash impairment of an investment in which the Company holds a minority interest. (4) 2007 adjusted results exclude $11 million and $67 million, respectively, of expenses related to Media Networks restructuring charges, principally severance, affecting MTV Networks domestic and international operations for the quarter and six months ended June 30, 2007. (5) The Company sold its non-controlling investment in MTV Russia for $191 million and recognized a pre-tax gain of $151 million. (6) The Company recorded a pre-tax non-cash impairment charge of $36 million to write off its investment in Amp’d Mobile which filed for bankruptcy. 8
  • 9. The Company's business outlook is based on 2007 adjusted diluted earnings per share from continuing operations of $2.36. The following table reconciles the Company’s results for the full year ended December 31, 2007 to the adjusted results that exclude the impact of restructuring activities, the realized gain on the sale of the Company’s non-controlling interest in MTV Russia, an impairment charge associated with the write-down of Amp’d Mobile and net discrete tax benefits. Year Ended December 31, 2007 Pre-tax Net Earnings Diluted EPS Earnings from from from Operating Continuing Continuing Continuing Operations(1) Operations(2) Income Operations (in millions, except per share amounts) $ 2,936 $ 2,580 $ 1,630 $ 2.41 Reported results ................................................................ Adjustments: Media Networks restructuring activities(3) ............... 77 77 49 0.07 Gain on sale of equity investment(4) ......................... (151) (95) (0.14) — Impairment of investment(5) ..................................... — 36 23 0.04 Discrete tax benefits (6) ............................................. — (15) (0.02) — Adjusted results ................................................................ $ 3,013 $ 2,542 $ 1,592 $ 2.36 (1) Pre-tax earnings represent earnings from continuing operations before provision for income taxes and minority interest. (2) The tax impact of adjustments has been calculated where appropriate using the applicable rates in effect for the period presented. (3) 2007 adjusted results exclude $77 million of expenses related to Media Networks restructuring charges, principally severance, affecting MTV Networks domestic and international operations. (4) The Company sold its non-controlling investment in MTV Russia for $191 million and recognized a pre-tax gain of $151 million. (5) The Company recorded a pre-tax non-cash impairment charge of $36 million to write off its investment in Amp’d Mobile which filed for bankruptcy. (6) 2007 adjusted results exclude net discrete tax benefits of $15 million, which were principally the result of audit settlements related to prior period tax returns. 9