SlideShare une entreprise Scribd logo
1  sur  44
Télécharger pour lire hors ligne
“I’m a shareholder.”                           “We are customers.”


     “This is my community.”                                “I work here.”


“ What can we expect from the merger
  of Duke Energy and Cinergy? ”


                               2005 Summary Annual Report
IN THIS REPORT


2   FINANCIAL HIGHLIGHTS
3   CHAIRMAN’S LETTER TO STAKEHOLDERS
9   2006 DUKE ENERGY CHARTER
11 CEO’S LETTER TO STAKEHOLDERS
17 THE NEW DUKE ENERGY
    21 U.S. FRANCHISED ELECTRIC AND GAS
    25 DUKE ENERGY GAS TRANSMISSION
    26 DUKE ENERGY FIELD SERVICES
    27 DUKE ENERGY AMERICAS
    28 CRESCENT RESOURCES
29 CONSOLIDATED FINANCIAL STATEMENTS
34 BOARD OF DIRECTORS
36 EXECUTIVE MANAGEMENT
38 NON-GAAP FINANCIAL MEASURES
41 INVESTOR INFORMATION


Safe Harbor Statement Under the Private Securities Litigation Reform Act of 1995
This document contains forward-looking information which is subject to risks and uncertainties that could cause actual results to be different than
those contemplated, including, but not limited to: changes in state, federal or international regulatory environments; commercial, industrial and
residential growth in the company’s service territory; the weather and other natural phenomena; the timing and extent of changes in commodity
prices, interest rates and foreign currency exchange rates; general economic conditions; changes in environmental and other laws and regula-
tions to which Duke Energy and its subsidiaries are subject, or other external factors over which Duke Energy has no control; the results of
financing efforts; the effect of accounting pronouncements; growth in opportunities for Duke Energy’s business units; and other risks described in
the 2005 Form 10-Ks filed by Duke Energy and Cinergy Corp., the registration statement on Form S-4 filed by Duke Energy and other Securities
and Exchange Commission filings. The company undertakes no obligation to publicly update or revise any forward-looking statements, whether as
a result of new information, future events or otherwise.
What can you expect from this merger?

You can expect a company committed to its
many stakeholders.
That means increasing value for our investors.
Delivering reliable and affordable service to
our customers.
Supporting and enhancing our local communities.
Providing a safe and rewarding workplace for
our employees.
Growing our business, while sustaining the
environment and quality of life.

                           To find out more, read on...
FINANCIAL HIGHLIGHTSa


                                                                                                                                              2003c
    (In millions, except per-share amounts)                                                          2005                 2004                                    2002               2001
    Statement of Operations
    Operating revenues                                                                          $ 16,746              $ 20,549            $ 18,021           $ 14,752            $ 15,383
    Operating expenses                                                                            13,855                17,376              17,087             12,393              13,036
    Gains on sales of investments in commercial
     and multi-family real estate                                                                         191                 192                   84                106                106
    Gains (losses) on sales of other assets, net                                                          534                (404)                (199)                32                238
    Operating income                                                                                   3,616               2,961                  819              2,497              2,691
    Other income and expenses, net                                                                     1,800                 305                  550                369                293
    Interest expense                                                                                   1,062               1,281                1,330              1,116                777
    Minority interest expense                                                                            538                 200                   62                 91                268
    Earnings (loss) from continuing operations
      before income taxes                                                                              3,816               1,785                    (23)           1,659              1,939
    Income tax expense (benefit) from continuing operations                                            1,283                 533                    (94)             514                713
    Income from continuing operations                                                                  2,533               1,252                   71              1,145              1,226
    (Loss) income from discontinued operations, net of tax                                              (705)                238               (1,232)              (111)               768
    Income (loss) before cumulative effect of
      change in accounting principle                                                                   1,828               1,490               (1,161)             1,034              1,994
    Cumulative effect of change in
      accounting principle, net of tax and minority interest                                                 (4)                 —                (162)                 —                 (96)
    Net income (loss)                                                                                  1,824               1,490               (1,323)             1,034              1,898
    Dividends and premiums on redemption of
     preferred and preference stock                                                                         12                    9                  15                 13                 14
    Earnings (loss) available for common stockholders                                           $      1,812          $ 1,481             $ (1,338)          $ 1,021             $ 1,884
    Ratio of Earnings to Fixed Chargesd                                                                                                              —b
                                                                                                           4.7                 2.4                                     2.1                2.8
    Common Stock Data
    Shares of common stock outstanding
     Year-end                                                                                             928                 957                  911                895                777
     Weighted average–basic                                                                               934                 931                  903                836                767
     Weighted average–diluted                                                                             970                 966                  904                838                773
    Earnings (loss) per share
     Basic                                                                                             $1.94               $1.59               $(1.48)             $1.22              $2.45
     Diluted                                                                                            1.88                1.54                (1.48)              1.22               2.44
    Dividends per share                                                                                 1.17                1.10                 1.10               1.10               1.10
    Balance Sheet
    Total assets                                                                                $ 54,723              $ 55,770            $ 57,485           $ 60,122            $ 49,624
    Long-term debt including capital leases,
     less current maturities                                                                    $ 14,547              $ 16,932            $ 20,622           $ 20,221            $ 12,321
    Capitalization
     Common equity                                                                                       50%                  45%                 37%                36%                 41%
     Preferred stock                                                                                      0%                   0%                  0%                 1%                  1%
     Trust preferred securities                                                                           0%                   0%                  0%                 3%                  5%
      Total common equity and preferred securities                                                       50%                  45%                 37%                40%                 47%
      Minority interests                                                                                  2%                   4%                  5%                 5%                  7%
      Total debt                                                                                         48%                  51%                 58%                55%                 46%
    a Significant transactions reflected in the results above include: 2005 DENA disposition (see Note 13 to the Consolidated Financial Statements, “Discontinued Operations and Assets Held for Sale”),
      2005 deconsolidation of DEFS effective July 1, 2005 (see Note 2 to the Consolidated Financial Statements, “Acquisitions and Dispositions”), 2005 DEFS sale of TEPPCO (see Note 2 to the
      Consolidated Financial Statements, “Acquisitions and Dispositions”), 2004 DENA sale of the Southeast plants (see Note 2 to the Consolidated Financial Statements, “Acquisitions and Dispositions”)
      and 2003 DENA charges (see Note 13 to the Consolidated Financial Statements, “Discontinued Operations and Assets Held for Sale”).
    b Earnings were inadequate to cover fixed charges by $19 million for the year ended December 31, 2003.
    c As of January 1, 2003, Duke Energy adopted the remaining provisions of Emerging Issues Task Force (EITF) 02-03, “Issues Involved in Accounting for Derivative Contracts Held for Trading
      Purposes and for Contracts Involved in Energy Trading and Risk Management Activities” (EITF 02-03) and SFAS No. 143, “Accounting for Asset Retirement Obligations.” In accordance with the
      transition guidance for these standards, Duke Energy recorded a net-of-tax and minority interest cumulative effect adjustment for change in accounting principles. (See Note 1 to the Consolidated
      Financial Statements, “Summary of Significant Accounting Policies,” for further discussion.)
    d Includes pre-tax gains on the sale of TEPPCO GP and LP of approximately $0.9 billion, net of minority interest, in 2005.

    See Notes to Consolidated Financial Statements in Duke Energy’s 2005 Form 10-K.


2
Paul M. Anderson
                                                                                     Chairman of the Board


Dear Fellow Stakeholder,

This report comes to you at an important juncture in our company’s history — actually, in the history
of two companies.

Many of you have recently become Duke Energy shareholders as a result of our merger with Cinergy.
I welcome you to Duke Energy, and I welcome this opportunity to give all of our investors a first
glimpse of the combined company. We believe this merger is good for everyone who has a stake in
our success, and this report will tell you why. But first, let me recap the events of 2005 that brought
us to where we are today.

For Duke Energy, 2005 was a year of transition. We repositioned the company to reduce risk, capture
value for shareholders and create a flexible platform for future growth. We took a number of decisive
steps and implemented them swiftly, but deliberately. The result is a whole “new” Duke Energy, with a
revised business model for our electric operations and greater flexibility for the rest of the portfolio.


CAPTURING VALUE

We began the year by announcing the transfer of a 19.7 percent interest in Duke Energy Field Services
(DEFS) to our partner ConocoPhillips for about $1.1 billion in cash and assets. At the same time, DEFS
sold its interest in TEPPCO for another $1.1 billion. The company used part of those proceeds to buy
back 32.6 million shares of common stock, and raised the quarterly dividend by 12.7 percent.

The assets transferred as part of the DEFS/ConocoPhillips deal positioned DEFS to launch a new
master limited partnership (DCP Midstream Partners) in the United States, and allowed Duke Energy


                                                                                                                           3
                                                                                  DUKE ENERGY 2005 SUMMARY ANNUAL REPORT
Gas Transmission (DEGT) to create a similar investment vehicle in Canada. These tax-efficient vehicles
    feature a lower cost of capital, allowing us to better compete for future acquisitions.

    At the operating level, each of our major businesses met their profit goals while pursuing growth
    opportunities. Later in this report, you will find their 2005 highlights, along with those of Cinergy’s
    businesses. I would only add that I am quite proud of their performance.

    On a less dramatic scale, we continued to reduce our backlog of litigation and to exit from non-core
    legacy projects and businesses. That relentless focus helped us to exceed our profit targets for
    the year.


    POSITIONING FOR THE FUTURE

    We took two major actions to position ourselves for the future. The first was the decision to merge with
    Cinergy to create the foundation for our future electric business. The second was the decision to exit all
    of Duke Energy North America’s (DENA’s) trading positions and operations, except for assets in the Midwest.

    For the foreseeable future, it appears that the electric industry will remain stalled somewhere between a
    regulated/integrated model and an unregulated/disaggregated model. Many states are testing their
    models, but none appear eager for wholesale change. As a result, the rules of the regulatory game
    are evolving.

    At the same time, increasingly stringent environmental standards, growing concern about greenhouse
    gases, skyrocketing fossil-fuel prices and a need to develop the next generation of capacity will
    challenge the industry like it has never been challenged before. Massive investments will be required at a
    time when customers are becoming more and more concerned about price and reliability.

    The combination of these factors will drive the industry to create super-regional consolidated players
    that have economies of scale, financial strength and organizational flexibility. It is a pattern we have seen
    in banking and other industries under similar circumstances.

    Duke Energy intends to be a consolidator in this new environment. The merger with Cinergy is a first
    step, providing not only scale and diversity, but also an opportunity to remodel our electric business to
    better face future challenges, while continuing to provide reliable and affordable service to our customers.
    The new model provides the opportunity for growth beyond Duke Power’s historical service territory,
    giving our electric operations the scale and flexibility to operate as a stand-alone business in this
    changing environment.


    REDUCING RISK

    Our newly combined electric fleet uses a diverse combination of fuels — nuclear, coal, gas and hydro
    — reducing our dependence on any one commodity. We also operate in diverse markets, blending
    higher-growth opportunities in the Carolinas with more moderate but steady growth in the Midwest. Our
    geographic diversity reduces year-to-year weather volatility. And operations in five separate regulatory


4
jurisdictions allow us to pursue regulatory initiatives specific to the needs of customers in each service
area, while broadly applying best practices in customer service.

Our decision to exit DENA outside the Midwest was a logical follow-on to our decision to merge with
Cinergy. DENA’s gas-fired plants in the Midwest complement Cinergy’s merchant assets, providing a
more flexible fleet in the short term and reduced environmental compliance costs in the longer term.
However, much of the rest of DENA’s portfolio was encumbered by long-dated contracts that limited
our ability to develop a sustainable business model. We ultimately decided that we would realize the
greatest shareholder value by exiting DENA’s operations outside the Midwest.

We have disposed of most of DENA’s electricity and natural gas contracts, and expect to close on the
pending sale of our remaining eight merchant power plants, as well as unwind any remaining contracts,
by mid-year. The net result of our exit from DENA is a substantial reduction in market risk and a much
more focused merchant operation.


ASSESSING OUR PERFORMANCE

Our Charter provides four measures of success which are useful in assessing our performance in
2005. We feel we did well against all of them.

Our investors realize a superior return on their investment.

     It was a good year relative to the S&P 500. We provided total shareholder return (TSR) of
     13 percent, compared to the S&P’s TSR of just under 5 percent. However, we fell short of the
     Dow Jones Utilities’ 25 percent. We attribute that lag to uncertainties around the merger with
     Cinergy, as investors stood by to see if and when it would come to fruition. Now that the merger
     is complete, we’re expecting to see a rebound in the stock price.

     Shareholders did see their annual dividend increase to $1.24 per share in 2005, and ongoing
     basic earnings per share were $1.79, topping our employee incentive target of $1.65.

Our customers and suppliers benefit from our business relationships.

     The year 2005 will long be remembered for its devastating hurricanes. Duke Power crews were
     there — more than 1,500 employees and contractors — to help rebuild the electric grid after
     Katrina and Rita hit the Gulf Coast. Not a single contracted DEGT customer missed a delivery
     during the hurricanes, thanks to our storage capacity and some creative solutions — like building
     a new interconnect to bypass a heavily damaged processing plant. DEGT is also working with
     industry peers on new standards to ensure pipeline and storage facility safety in case of
     future disasters.

     Customers ranked Duke Power “Highest in Customer Satisfaction With Residential Electric
     Service in the Southern U.S.,” based on a 2005 J.D. Power and Associates study and, in a
     separate benchmark survey conducted by TQS Research, manufacturing and institutional
     customers ranked the utility first in the Southeast and third nationally.


                                                                                                                          5
                                                                                 DUKE ENERGY 2005 SUMMARY ANNUAL REPORT
As for suppliers, we are encouraging them to improve safety for their employees, and many are
         following our lead. We are also working to improve supplier diversity — we made progress in
         2005, but we can still do better.

    The communities in which we operate value our citizenship.

         Our employees, retirees and The Duke Energy Foundation
                                                                           Community Recognition in 2005
         gave more than $800,000 in hurricane and tsunami relief.
                                                                           • An Environmental Excellence Award from the
         We gave more than $5 million to the U.S. United Way and             Southern Gas Association for DEGT’s leadership in
         more than $1 million to the Canadian United Way in 2005.            developing the Texas Corporate Wetlands Restoration
                                                                             Partnership.
         Total Foundation and companywide giving for the year —
                                                                           • The Newcomen Award honoring Duke Power for its
         including in-kind donations, contributions from employees
                                                                             outstanding business accomplishments, stewardship
         and retirees, and the value of volunteer service —-                 and integrity. Duke Power is the only three-time
         exceeded $32 million.                                               recipient of the award.

                                                                           • A Corporate Stewardship Award from the South
         Employees collected tons of food and other essentials for
                                                                             Carolina Department of Archives and History for
         displaced hurricane victims, and thousands of Duke Energy           archaeology and historic preservation at Crescent
         employees and retirees completed some 450 community                 Resources’ Palmetto Bluff community.

         service projects during our 2005 Global Service Event.            • An Environmental Achievement and Education Award
                                                                             to DEGT from the City of Calgary for development
         Employees also received financial support for their volunteer
                                                                             of an Urban Ecology Program for schools.
         projects with more than $200,000 in grants from the
                                                                           • An Award of Recognition from the British Columbia
         Foundation. On this page you will find examples of the many         School Superintendents Association for DEGT’s
         ways our communities recognized Duke Energy for business            contributions to public education through the
                                                                             Northern Opportunities program.
         integrity and environmental stewardship in 2005.
                                                                           • A Corporate Plus Award from the Charlotte
    Every employee starts each day with a sense of purpose,                  chapter of INROADS for Duke Energy’s support of
    and ends each day with a sense of accomplishment.                        the organization’s mission to provide internship
                                                                             opportunities for minority students.
         Overall employee satisfaction is at its highest level in more
                                                                           • The 2005 Diversity Best Practices Award from the
         than five years. In our 2005 employee survey, most                  Charlotte Chamber of Commerce, honoring Duke
                                                                             Energy for its multicultural involvement in the
         employees expressed confidence in the company’s future
                                                                             community.
         and pride in Duke Energy and their work. Nine out of 10
                                                                           • A Community Service Award from the Hale
         employees ranked the company favorably for environmental,
                                                                             Reservation for Duke Energy’s role in restoring the
         health and safety practices.                                        organization’s environmental education facilities and
                                                                             preserving natural resources in the Boston area.
         In 2005 we made a recommitment to professional
         development, which had been somewhat on the back burner
         for several years. Employees seized those opportunities — training hours were up 83 percent in
         2005 over 2004. Along with other members of the executive team, I personally participated in
         advanced leadership training for some 2,700 managers.

         For 2006, we’re adding to this measure of success — that employees end each day safely. The
         year 2005 was a sad one for five families who lost fathers and husbands who were contractors


6
at work for Duke Energy. We can’t say any year has been truly successful if we don’t keep our
     workers safe.


MOVING FORWARD

Our new Charter objectives spell out what you can expect from us in 2006.

The first imperative is to establish an industry-leading electric power platform through
successful execution of the merger with Cinergy.

We know that we have to earn the right to pursue other consolidations in the future, by demonstrating
that this merger benefits all of our stakeholders — employees, shareholders, customers, regulators
and our communities. We intend to do just that.

We will continue to build a high-performance culture focused on safety, diversity and
inclusion, employee development, leadership and results.

Both Duke Energy and Cinergy have a deep bench of talent, and we put both companies’ best minds to
work on an integration plan to create a winning combination of leadership and resources. We share the
same business values, and a commitment to serve our stakeholders with integrity from a position of
industry leadership. Our compatible company cultures create a strong foundation for organic growth
and for future mergers and acquisitions.

We intend to deliver on our 2006 financial objectives and position the company for growth
in 2007 and beyond.

All employees have an incentive target of $1.90 per ongoing diluted share in 2006. (This year, we are
framing our objectives in terms of diluted as opposed to basic shares, consistent with Wall Street’s
comparison of earnings on a fully diluted basis.) We see this as a challenging but realistic goal, based
on the groundwork we have laid and opportunities ahead. It assumes synergy savings from the merger
and a sharing of those savings with customers, but excludes costs to achieve as those are considered
one-time items.

Long-term management incentives are tied to total shareholder return. Working safely also remains
an important measure of our success. Top leaders will see a 5 percent reduction in their short-term
bonus payouts in the event of an employee, contractor or subcontractor fatality in 2006.

We plan to complete the Duke Energy North America exit and pursue strategic portfolio
opportunities.

With the merger complete, our focus moves to the question of whether to separate our gas and power
businesses and to new opportunities for electric utility consolidation. As with the Cinergy merger, our
litmus test for all decisions will continue to be the degree to which they create value for investors and
other stakeholders.


                                                                                                                          7
                                                                                 DUKE ENERGY 2005 SUMMARY ANNUAL REPORT
Finally, we will continue to build credibility through leadership on key policy issues,
    transparent communications and excellent customer service.

    Our aggressive position on global climate change ruffled more than a few feathers in 2005. Last year,
    Cinergy devoted nearly its entire annual report to this issue, so be assured that Jim Rogers shares my
    commitment to facing facts about its potential effect on our industry. We share a philosophy that it is
    better to help shape the future with solutions, than to ignore reality and hope the tough problems just
    go away.

    Jim and I also share a strong belief in straightforward communication with our shareholders and all of
    our constituents, and in providing superior service to customers, the lifeblood of our company. You will
    read more about Jim’s plans as your new CEO in his letter, which follows.

    I heartily welcome Jim and our new leaders from Cinergy to Duke Energy’s management team. I will
    continue in my leadership role as chairman of the board. Let me take this opportunity to also welcome
    our new board members — Bill Barnet and Jim Hance, who joined the board in 2005, and five new
    board members from Cinergy — Michael Browning, Phil Cox, Mary Schapiro, Dudley Taft and of course
    Jim Rogers. Our outgoing board members, Max Lennon and Jim Martin, deserve special thanks for
    their years of dedicated service during a turbulent period in our company’s history.

    As I settle into my role as chairman, I thank you for your support during my time as CEO. When I
    accepted that position in November 2003, my objective was to restore our credibility and financial
    health, and meet the needs of our stakeholders. Thanks to your support and the contributions of
    thousands of employees, we have largely achieved those goals.

    I now feel comfortable handing over the CEO role to Jim Rogers, who shares my strong belief in the
    future of Duke Energy and its people. It is a good feeling to know that I am leaving in his capable hands
    a company that is financially strong, has a bright future and is positioned to be an industry leader.

    Sincerely,


    Paul M. Anderson
    Chairman of the Board


    April 3, 2006


8
How will we know our merger is successful?

     We have developed a scorecard to track key
     measures, including savings, customer and
     employee satisfaction, reliability, safety and
     sustainability.

     And we will share our progress with our
     stakeholders on a regular basis.

                         Read more about what
                         success will look like at
                         the new Duke Energy …


10
James E. Rogers
                                                                                      President and Chief Executive Officer


Dear fellow investors, customers, employees and others who have a vested interest in our
success — our policymakers, regulators, suppliers, partners and communities:

The best way to celebrate the traditions and the people of two strong companies is by building an even
stronger company on the combined foundations of each.

Cinergy and Duke Energy each have a long and proud history with many successes. Of course, we have
each had some missteps, as is true with all companies. However, as a combined company, we will honor
our past achievements and the people who came before us by building on their accomplishments. As we
plan for the future, we will remember the lessons learned from both our past successes and mistakes.

Combined, we are a very large company. But I am mindful that bigger doesn’t necessarily mean better. To
me, being better means having a relentless focus on what we do well. It means listening to our stakeholders
and then working to balance their sometimes competing needs. It’s knowing that we must earn the right to
serve all of our stakeholders each and every day.

As the CEO of the new Duke Energy, my number one objective is to create an effective team of dedicated
employees who come to work every day with the purpose of earning the right to serve you. Our team
must be unrelenting and uncompromising in its drive to deliver on our promises. A team, simply put, that
is accountable to be good stewards.


MEETING OUR FUTURE CHALLENGES

In his preceding letter, Paul Anderson gave you a good overview of Duke Energy as a whole. My focus here
is primarily on the outlook for our combined franchised electric and gas utilities, competitive Midwest
generation, and wholesale marketing and trading businesses. Our merger greatly increases the value of
these businesses. We believe they can be significant contributors to our future earnings growth.

                                                                                                                              11
                                                                                  DUKE ENERGY 2005 SUMMARY ANNUAL REPORT
As Paul notes in his letter, our industry is stalled between regulation and deregulation. Efforts by states to
     provide retail customers with energy choices have essentially come to a halt. As federal regulators continue
     to regionalize our nation’s power grid, wholesale competition is taking incremental but uneven steps forward.

     Successful companies will be those who can operate comfortably in both regulated and competitive markets
     and create customer value in each. The new Duke Energy will be one of those companies. Here’s why:

     We have combined two premier, franchised electric utility businesses with long histories of reliably supplying
     energy at costs below the national average. Each company is known for its ability to consistently provide
     superior customer satisfaction. We view low rates and attentive customer service as essential investments in
     our future growth. One result of low rates and top-tier customer service is increased credibility in the
     regulatory arena.

     Our diverse customer base will benefit from our aspiration to rank among the top performers in our
     industry for safety, efficiency, low costs, and reliable generation and distribution performance. Also, our
     fuel diversity — nuclear, coal, gas and hydro — will reduce our sensitivity to volatility caused by changes
     in commodity costs, weather and economic conditions.

     Our combined commercial generation assets straddle the seam between the Midwest ISO and PJM
     Interconnection regional transmission organizations, two of the most developed and dynamic power markets
     in the United States. These assets represent a diverse mix of baseload, midmerit and peaking generation
     that give us the flexibility to meet diverse customer needs in still-evolving competitive supply markets.

     Our energy marketing and trading organization is positioned to continue to take advantage of opportunities
     in competitive gas and electric markets in a low-risk manner. We believe we’ve created the right size
     platform with the right level of risk tolerance to be able to contribute steady, incremental earnings to the
     overall portfolio.


     A NEW VALUE PROPOSITION

     Over the past decade, we’ve seen dramatic shifts in how investors view the power industry. Not long ago,
     the market favored merchant players with greater earnings growth potential but also higher levels of
     volatility. As the commodity cycle bottomed out, investors exited the merchant sector and returned to
     traditional regulated utilities. This “back to basics” approach has taken utility stock valuations to record
     levels for many companies.

     As a result, our industry has significantly out-performed the S&P 500 in both 2004 and 2005. Of course,
     history shows that it is rare for any one industry sector to beat the broader market for three consecutive
     years. Since interest rates have risen, the utility sector’s opportunity to do so for a third consecutive year
     will be significantly challenged. I hope that 2006 proves history wrong.

     But however the industry fares, in my view, our business model allows us to out-perform comparable
     companies in our industry. We have the ability to deliver stable, predictable earnings from low-cost,
     regulated operations, and we can also manage low-risk growth in competitive wholesale markets. As
     such, we believe our combined company will have the earnings diversity and financial flexibility to weather
     changes in the regulatory landscape and investor sentiment.


12
With these perspectives as background, and based on the 2006 Charter objectives Paul introduced in his
letter, here are our priorities for the rest of this year and beyond:

  • Build an effective management team committed to one company, one stock and one team.
    Our team will create a high-performance culture focused on safety, diversity and inclusion, employee
    development, leadership and results.

  • Harvest the savings from our merger. We expect to realize approximately $650 million in
    aggregate net savings during the initial five years after the merger closes. These savings will help
    drive our earnings growth for shareholders and — through equitable sharing mechanisms with
    customers and shareholders — our aspiration to be a low-cost supplier for our customers.

  • Comply with more stringent environmental rules. We intend to reduce sulfur dioxide (SO2),
    nitrogen oxides (NOx) and mercury emissions from our coal-fired generation plants with the installation
    of new pollution control equipment on our largest units. We are also preparing for a future in which we
    believe new environmental laws and regulations will regulate the emissions of greenhouse gases.

  • Continue planning for new power plant construction to meet longer-term customer
    demand. Given the long lead times to build new baseload plants and the increased complexities of
    environmental compliance, we must place a strong emphasis on developing long-range plans to
    ensure that we maintain adequate generation reserves in all of our jurisdictions. As we carefully
    assess estimates of future supply and demand, we will evaluate all types of generation — coal,
    nuclear, coal gasification, hydroelectric, natural gas and renewable energy. We will continue to find
    cost-effective ways to lessen our exposure to the economic and environmental risks associated with
    any one fuel. For example, we intend to relicense our hydroelectric fleet and modernize our most
    economic coal units.

  • Minimize the impact of volatile fuel prices on customers. Generation fuel expense is one of the
    primary drivers of electricity prices. We intend to take advantage of our fuel diversity, purchasing
    power and efficient fuel delivery systems to minimize the impact of fuel price swings on our customers.

  • Renew our focus on energy conservation and efficiency. We will pursue policies promoting
    conservation, efficiency and wise energy use. In the past, our customers benefited from these
    programs, which help them use less energy without compromising their quality of life. In collaboration
    with our state utility regulatory commissions and consumer advocates, there is so much more we can
    and will do.

  • Modernize and expand our aging transmission and distribution systems. We expect to invest
    approximately $2.3 billion in our regulated operations over the next three years to improve the
    reliability of our regulated gas and electric delivery systems.

  • Maintain low risk in our energy marketing and trading businesses. We will continue to
    have a conservative, low-risk focus in our marketing and trading businesses with narrow risk
    parameters for products offered and committed capital. We will focus strictly on near-term,
    credit-advantaged opportunities.

  • Support the economic well-being of our communities. The average organic growth rate of our
    regulated franchises (demand in kilowatt-hours) is expected to be approximately 1.5 percent over the

                                                                                                                          13
                                                                                 DUKE ENERGY 2005 SUMMARY ANNUAL REPORT
next three years. We will work with community and political leaders to focus on local economic
         development, which should increase this rate over time.

     In all, you can expect us to work on these priorities to achieve predictable earnings and dividend growth.


     CINERGY — A HISTORY OF SUCCESS

     I would like to review my experience at Cinergy both for former Cinergy shareholders who are new to
     Duke Energy, as well as for those shareholders who owned Duke Energy prior to the merger. I am proud
     of the people of Cinergy because they bring a rich heritage of accomplishments to this merger. As the
     new CEO of Duke Energy, I am grounded in this history and inspired to build on these successes. Because
     we chose not to issue a final Cinergy annual report, I will briefly highlight our accomplishments during
     Cinergy’s nearly 12 years of existence.

     Total Return Focus: Since the merger of PSI Energy and Cincinnati Gas & Electric to create Cinergy in
     1994, we provided our investors with an average annual total shareholder return of 11.9 percent through
     2005. During that time, we beat the S&P 500, the S&P 500 Electric Utility and the Philadelphia Stock
     Exchange Utility indexes, and we returned approximately $3.5 billion in cash dividends to shareholders.

     Governance Leadership: Institutional Shareholder Services has consistently ranked Cinergy as one
     of the top 10 companies in the S&P 500 for its governance. I believe this recognition reflects the
     Cinergy board’s consistent focus on what constitutes good corporate governance. The board created
     one of the first corporate governance committees in the United States in 1994, shortly after the
     company was formed.

     Customer Focused: Our customers enjoy some of the lowest electric and natural gas rates in Ohio and
     Kentucky. In 2005, our Indiana electric rates were the same as they were in 1988 when I became CEO of
     PSI Energy, while our investors have earned a fair return. Across the board, our rates are significantly
     below the national average, and keeping our rates competitive has been a commitment to our customers.

     For many years, we’ve ranked in the top quartile of Midwest utilities for customer satisfaction. For two
     consecutive years — 2005 and 2006 — our call centers have been certified for providing “An
     Outstanding Customer Service Experience” by J.D. Power and Associates. We were the first energy
     company in the United States to earn this prestigious certification.

     Emergency Response: I’m proud of the way our employees have responded to emergencies in our
     communities and elsewhere. Last year, we sent crews to the Gulf States following Hurricanes Katrina
     and Rita. After a severe ice storm in December, Cinergy crews worked alongside their Duke Power
     counterparts to restore service to 700,000 customers in the Carolinas. For the last two years, the Edison
     Electric Institute, our industry’s leading trade organization, has recognized our emergency assistance to
     other utilities.

     Employer of Choice: We earned the U.S. secretary of labor’s top diversity award for our efforts to
     recognize the talents and respect the differences of our employees. Also, for nine consecutive years —
     1997–2006 — Cinergy was named one of the 100 best companies for working mothers by Working


14
Mother magazine, and for many of those years we were the only utility listed. Last year, AARP recognized
Cinergy as a top employer for employees over age 50.

No Surprises for Regulators and Policymakers: Our relationships with federal, state and local
regulators and policymakers have been consistently based on a powerful but simple premise: “No
surprises.” Our efforts to balance the needs of our investors and customers resulted in many regulatory
wins for both, including most recently, our rate stabilization plan in Ohio and our environmental
compliance settlement in Indiana.

Industry Leadership on Public Policy: We worked to mold and shape national energy policy. Along with
Duke Energy and other energy companies, we helped to secure passage last year of the Energy Policy
Act, probably the most significant energy legislation to be enacted since the 1970s. And we will continue
to push for passage of comprehensive multipollutant legislation at the federal level.

Environmental Leadership: As one of the largest users of coal to generate power, we have been a
leader on the issue of reducing coal-fired emissions. At the first Cinergy board meeting in 1994, we
adopted an environmental leadership pledge — one of the first in our industry. Our pledge illustrated a
key operating principle: Accountability starts at the board level.

Cinergy has been one of a handful of utilities with experience in coal gasification. We are using this
knowledge to obtain public and private support to build one of the first commercial cleaner-burning coal
gasification plants to replace one of our older coal plants.

We earned national recognition for our partnerships on numerous environmental projects. Most recently,
the U.S. Department of Energy and the U.S. Environmental Protection Agency recognized Cinergy and
BP with its Energy Star award for the operational and environmental efficiency of Cinergy Solutions’
cogeneration plant at the BP refinery near Houston.

Over the past 15 years, Cinergy reduced its SO2 and NOx emission rates by 50 percent and 45 percent,
respectively. Also, we were one of the few utilities that voluntarily committed to reduce our greenhouse
gas emissions. In late 2004, we issued our “Air Issues Report to Stakeholders,” and last year we devoted
our annual report to climate change. We did this to jump-start a debate on what must be done to prepare
our stakeholders for the inevitability of a carbon-constrained world. We owe it to our children and
grandchildren to start dealing now with the climate change issue.

Committed to Communities: Our people are involved in virtually every major nonprofit organization in
each community we serve. They volunteer their time and talents whenever the need arises. And Cinergy
Foundation has given back $45 million to improve education, community development, health care,
social services and culture.

Cinergy has been an industry leader in economic development. We continued to support our communities,
even as states such as Ohio were deregulated. We’ve always considered economic development to be the
heart of our organic growth.

Sustainability Leader: Lots of companies talk about sustainability. Many don’t think about what it really
means. To us, it has meant reducing our environmental footprint in a world where our grandchildren may
not be able to take the basics, such as clean air, plentiful water and affordable energy, for granted.


                                                                                                                          15
                                                                                 DUKE ENERGY 2005 SUMMARY ANNUAL REPORT
Viewing our business as a whole, we’ve always known that responsible actions based on balancing the
     needs of our stakeholders lead to long-term success. That is how we have defined sustainability.

     In 2005, we were again recognized for sustainability leadership. For the third consecutive year, Cinergy
     was named to the Dow Jones Sustainability Indexes. We were one of only two utilities in the United States
     and eight in the world to be so named.

     As a further commitment to sustainability, we encourage you to enroll in electronic delivery of our financial
     information and proxy statements. Besides preserving our natural resources by reducing paper, electronic
     delivery also significantly reduces the costs of printing and mailing. In 2007, for every shareholder who
     selects electronic delivery rather than a printed copy of their 2006 Duke Energy annual report, we will
     donate $1 to The Nature Conservancy, with whom we’ve worked on numerous environmental initiatives.
     (See page 41 for more information.)


     EARN THE RIGHT EVERY DAY

     As a combined company, I have no doubt that we will achieve even greater successes in the future. I believe
     success is about people who want to create a better future. I have confidence that together, this new team
     of Duke Energy and former Cinergy employees will carry on our best traditions and start new ones.

     I thank the employees of Cinergy who have traveled with me on this journey. You never wavered from our
     vision of “people making history by making a difference.” You made a real difference. We would not be
     where we are today were it not for your hard work and dedication.

     I want to thank the past and present officers who helped grow Cinergy into a great company and a great
     merger partner.

     And my thanks to the Cinergy board of directors, especially George Juilfs, Tom Petry, Jack Schiff and
     Phil Sharp, who are departing. Your insights and thoughtful debate helped us to maintain our focus on
     growth and on serving our stakeholders.

     I’m both humbled and excited about being the CEO of Duke Energy. I know it is a company where each of
     us will strive every day to earn the right to serve you, our stakeholders.


     James E. Rogers
     President and Chief Executive Officer


     April 3, 2006


16
What does the new Duke Energy look like?

The merger of Duke Energy and Cinergy creates a
premier energy company serving 3.8 million electric
customers in five states, and 1.7 million gas customers.

Our six major lines of business form a strong platform
for future growth, and give Duke Energy the ability to
succeed in both regulated and nonregulated markets.

On the pages that follow, you will learn more about
how the new Duke Energy is structured for future
growth, highlights of our combined companies’ 2005
accomplishments, and a strategic look ahead.

You will also see the benefits of the merger from
the perspective of our shareholders, our customers,
our employees and our communities.

                                          Read on…


                                                                                17
                                       DUKE ENERGY 2005 SUMMARY ANNUAL REPORT
As an investor, what can I expect from this merger?
     We expect the financial strength of the new Duke Energy to deliver steady earnings-per-share (EPS) growth. Our targeted
     earnings will be $2 per ongoing diluted share in 2007, our first full year as a combined company, and 4 to 6 percent
     ongoing annual EPS growth thereafter. Our diverse portfolio of assets and operations, both regulated and nonregulated,
     will enable us to sustain that growth. With the merger complete, we are resuming our stock buyback program and will
     consider increasing the dividend, based on our target payout ratio of 70 percent.


     Farmer, conservationist and Duke Energy shareholder Ernie Averett. The Averett family has owned and operated Flatwood Farms in Oxford, N.C.,
     for seven generations. Averett began investing in Duke Energy more than 10 years ago to smooth out his seasonal income with reliable dividends.


18
DUKE ENERGY + CINERGY = THE NEW DUKE ENERGY


With this merger, our newly combined power business         Combined North American Assets
joins our natural gas businesses to rank among the
largest in North America. While the merger benefits our
entire company and all of its stakeholders, the key
advantages are largely related to our electric business:
  • The combined strength and diversity of our franchised
                                                                             Calgary
   electric utilities put us in a better position for            Vancouver
   sustained growth, and our greater size and scope
   give us a stronger platform for participation in the
   consolidation of the electric power industry.
                                                                                                          Chatham
  • We will continue to grow our earnings by investing
                                                                                                    Plainfield
                                                                              Denver
   in the expansion and reliability of our operations —                                                             Cincinnati
   focusing on new generating capacity, environmental                                                                         Charlotte
   controls and the modernization of our power delivery
   system.                                                                                Houston

  • In our competitive supply markets, we will reap the benefits
   of fuel, asset and geographic diversity.
  • Approximately $650 million in net cost savings aggregated over the                                           Corporate Headquarters
                                                                                                                 Major Office Location
   first five years will be shared equitably with customers and shareholders.                                    Natural Gas Storage
                                                                                                                 DEGT–Natural Gas Processing Plant
                                                                                                                 Natural Gas Transmission Pipeline
  • Our public voice on energy and environmental policy issues will be stronger                                  Natural Gas Liquids (NGL) Pipeline
   and heard more broadly.                                                                                       Union Gas Distribution Service Area
                                                                                                                 Franchised Electric Service Area
                                                                                                                 DEFS–Processing Plant
  • We can better maintain our commitments to support our communities and                                        Natural Gas Gathering Pipeline
                                                                                                                 Propane Terminal
   to be the “employer of choice.”                                                                               Wholesale Generation Plant

  • Most importantly, this merger reinforces our focus on understanding and balancing
   the needs of all of our stakeholders, which is fundamental to continued leadership
   as a sustainable business.
With the merger, some of our business names have changed. What has not
changed is their commitment to our shared purpose: to create value for our
investors, customers, communities and employees.
Our U.S. franchised electric and gas utilities — formerly Duke Power in
the Carolinas, Cincinnati Gas & Electric in Ohio, Union Light, Heat and
Power in Kentucky and PSI Energy in Indiana — are now known simply as
Duke Energy.
Cinergy Solutions is now Duke Energy Generation Services. Duke Energy
Americas, Duke Energy International, Duke Energy Gas Transmission, Duke
Energy Field Services, Crescent Resources and Union Gas, our local distribu-
tion company in Canada, retain their names.
                                                    President and CEO Jim Rogers (left)
The following summaries recap the primary
                                                    is responsible for the company's
accomplishments of our major businesses
                                                    day-to-day operations and business
in 2005 and their main areas of focus
                                                    decisions, while Chairman Paul
going forward.                                      Anderson's role focuses on high-
                                                    level strategy development and
                                                    management succession.
                                                                                                                                          19
As customers, what can we expect from this merger?
     We know that the energy and related services we supply to millions of customers are essential to their way of life. We
     are committed to keeping our electric and gas utility rates, which in 2005 were below the U.S. national average, as
     competitive and stable as possible, while earning a fair return for our investors. We will continue to strive for the highest
     standards in customer service and satisfaction. We will work diligently to maintain outstanding system reliability and
     safety, and to help our customers find the energy solutions they need.


     Heather Hallenberg, Frank Satogata and their son Sean, at their home in Cincinnati’s Mount Washington neighborhood. The Satogatas have been
     Cincinnati Gas & Electric customers for nearly 20 years. Active in the Greater Cincinnati arts community, Frank is a graphic designer and
     painter, Heather is arts services director of Cincinnati’s Fine Arts Fund, and Sean is a freshman in high school.

20
U.S. FRANCHISED ELECTRIC AND GAS

Duke Energy’s franchised electric and gas operations deliver safe, reliable and      U.S. Franchised Electric and Gas
                                                                                     Service Area and Major Offices
competitively priced electricity to more than 3.8 million electric customers in
North Carolina, South Carolina, Ohio, Indiana and Kentucky. A diverse fuel mix of
                                                                                                       IN
nuclear, coal-fired, hydroelectric and combustion-turbine generation provides                                         OH
approximately 28,000 megawatts of total generating capability. These operations
also serve more than 500,000 natural gas customers in Ohio and Kentucky.                           Plainfield     Cincinnati
                                                                                                                               WV
                                                                                                                                         VA
Our regulated utilities are focused on revenue growth, operational                                           KY
performance and continued partnerships with customers and
communities. For the first time in 20 years, future demand is projected                              TN                                         NC
                                                                                                                                    Charlotte
to outpace generation capacity — in the Carolinas alone, we foresee a
                                                                                    Midwest Regulated
need for 20 percent more capacity, about 4,000 megawatts, by 2015,                                                                  SC
                                                                                    Generation
and we are pursuing options to build both coal and nuclear generation               Coal  6,103 MW
                                                                                                                     GA
                                                                                    Gas   1,752 MW
plants. In Indiana, we are evaluating the construction of a state-of-the-art
                                                                                    Oil   259 MW
coal gasification project to replace a more than 50-year-old coal-fired             Hydro 45 MW
plant. New generation will support our already diverse portfolio of                 Midwest Retail Gas
low-cost coal and nuclear baseload generation, supplemented by hydro-               Operations                    Southeast Regulated
                                                                                    6,350 miles of                Generation
electric, combustion-turbine and purchased power for peak periods.                  distribution pipelines        Nuclear 6,996 MW
                                                                                                                  Coal     7,699 MW
The successful integration of our franchised electric businesses will achieve                                     Gas      2,424 MW
                                                                                                                  Hydro    2,800 MW
cost savings and enhance customer service and reliability across all service territories.

Ongoing segment earnings before interest and taxes (EBIT) for U.S. Franchised
Electric and Gas in 2006 is expected to be approximately $1.95 billion.

2005 Highlights
Duke Power
Duke Power contributed approximately $1.5 billion in segment EBIT in 2005,
slightly higher than 2004 segment EBIT of $1.47 billion due to
favorable weather, strong bulk power sales and the impact of
continued economic development efforts — partially
offset by a charge for December ice storm
expenses and by higher operating and
maintenance expenses.
Population growth — and demand for Duke
Power’s attractive electric rates — continue in
the Piedmont Carolinas. New high-tech indus-
tries such as biotechnology and automotive
research moved to the region, replacing lost
business and jobs in the textile sector.

These leaders are responsible for providing franchised
electric and gas customers with efficient and reliable
operations (from left): Patty Walker, group vice president,
Ohio and Kentucky gas operations; Brew Barron, group vice
president, nuclear generation and chief nuclear officer;
Bill McCollum, group vice president, regulated fossil/hydro
generation; Theopolis Holeman, group vice president,
power delivery; and Todd Arnold, group vice president,
customer service.
What can my community expect from this merger?
     We are committed to maintaining a local presence with “go to” people who live in and are actively involved in the
     communities we serve. We will continue to support local economic development efforts — in many communities, we’re
     already a catalyst for those efforts. We will help provide energy assistance to our low-income customers through flexible
     billing and assistance programs. We pledge that our corporate foundation giving in support of community health,
     education and cultural enrichment will continue. And we will provide leadership in environmental responsibility and
     sustainability — a corporate priority.


     Charlotte Otto, Global External Relations Officer for The Procter & Gamble Co. Active in her community’s business and cultural life, Otto currently
     chairs the Cincinnati USA Regional Chamber and Downtown Cincinnati Inc., and serves on the board of Cincinnati Playhouse in the Park.


22
Regional growth continued to add to Duke Power’s total customer base, which grew by 43,000
customers — about a 2 percent net increase — in 2005. In July, the company set a new peak
demand record of 18,687 megawatts.
To meet growing demand, Duke Power focused on new generation plans — and on operating its
current generation and delivery systems as efficiently as possible. In 2005, the company’s
fossil/hydro fleet set a new all-time generation record, beating the previous record by more than
2 million megawatt-hours. Duke Power’s two largest steam stations, Marshall and Belews Creek,
were ranked second and third in efficiency among U.S. coal-fired stations by Electric Light & Power
magazine. And our nuclear fleet achieved its second highest capacity factor ever — 93.68 percent,
up from 2004’s 90.23 percent. (Capacity factor measures how much electricity the system
produces as a percent of its total capability.)
In October, Duke Power confirmed it is proceeding with the federal application process for a
combined construction and operating license for two Westinghouse AP1000 nuclear reactors.
A potential site in South Carolina has been selected for a joint project with Southern Company.
Cinergy
Cinergy’s regulated businesses contributed approximately $645 million in adjusted EBIT in 2005,
compared to approximately $586 million in 2004, while advancements in reliability and customer
service were recognized by regulatory authorities and earned national recognition.
Ohio regulators approved a $51.5 million electric distribution rate increase, the first in a decade, for
Cincinnati Gas & Electric Co. (CG&E). Effective in 2006, the increase recognized CG&E’s reliability
improvements over the past 12 years. Kentucky regulators approved an
                                                                              These leaders are the face of Duke Energy in their business
$8.1 million natural gas distribution rate increase for Union Light, Heat
                                                                              communities (from left): Bill Easter, president and CEO,
and Power (ULH&P) for continued improvement of its gas distribution
                                                                              Duke Energy Field Services; Martha Wyrsch, president,
system. PSI Energy (PSI) reached a settlement to recover approximately
                                                                              Duke Energy Gas Transmission; Art Fields, president
$1 billion to comply with new federal clean air and mercury rules. The
                                                                              and CEO, Crescent Resources; Ellen Ruff, president,
five-year plan will result in further significant reductions in the emissions Duke Energy Carolinas; Sandra Meyer, president,
of sulfur dioxide and nitrogen oxides as well as mercury emissions.           Duke Energy Ohio and Kentucky; Kay Pashos, president,
                                                                                    Duke Energy Indiana; and Richard McGee, president,
                                                                                    Duke Energy International.


                                                                                                                                   23
As an employee, what can I expect from this merger?
     We recognize that employees are the foundation of our company. They create value for our stakeholders, day in and
     day out. We believe our larger scale and scope will help us maintain competitive pay and benefits, and provide more
     opportunities for employees to grow and develop in their careers. We will continue to recognize employees for their
     work and to foster a diverse, inclusive, performance-based culture where they feel valued and can reach their full
     potential. Above all, we are committed to our employees’ health and safety, both on and off the job.


     James W. Bowden, General Manager of Power Delivery Operations for Duke Power’s Northern Region. Bowden oversees the operation,
     modification and maintenance of Duke Power’s transmission system in a region serving 830,000 customers. His family history with Duke Power
     goes back more than 100 years -— his grandfather joined the company in 1905 and his father also worked for Duke Power.

24
And state and federal regulators also agreed to the transfer of approximately 1,100 megawatts of
generation assets from CG&E to ULH&P to meet future customer demand.
In January 2006, the CG&E and PSI customer call centers in Ohio and Indiana were recertified by
J.D. Power and Associates. Last year, Cinergy was the first energy company in the United States to
be certified for providing “An Outstanding Customer Service Experience.” (Duke Power was the second.)
And, for the second year in a row, Cinergy received the Edison Electric Institute’s emergency
assistance award, this time for the help it gave Gulf Coast utilities in the wake of Hurricanes Katrina
and Rita last fall. In December after a severe ice storm, Cinergy crews worked alongside their
Duke Power counterparts in the Carolinas to restore service to 700,000 customers.


DUKE ENERGY GAS TRANSMISSION

Duke Energy Gas Transmission has more than 17,500 miles of transmission pipelines; 250 billion cubic feet of
natural gas storage; gathering and processing assets; a natural gas liquids processing operation; and a local
distribution company serving more than 1.2 million customers in Canada. DEGT is well positioned to connect new
and existing natural gas supplies to growing markets, with timely pipeline expansions and the development of
highly flexible natural gas storage capacity.


Duke Energy Gas Transmission (DEGT) continues to make a consistent contribution to cash flow and
earnings by providing natural gas transmission and storage, gathering and processing, and local
distribution services to premium markets in North America.
Going forward, DEGT is expected to deliver ongoing segment EBIT of approximately $1.39 billion,
which is essentially flat with 2005. Ongoing earnings for this business are anticipated to grow by
3 to 5 percent annually — driven by opportunities for continued pipeline development, optimization
of existing transmission, distribution, gathering and processing systems, storage development and
control of costs. Demand for natural gas is expected to grow 2 to 3 percent in DEGT’s key markets.
2005 Highlights

DEGT contributed approximately $1.39 billion in segment EBIT, compared to approximately $1.33 billion
in 2004 — an increase driven by improved operations, U.S. system expansions, newly acquired
Canadian assets and a favorable currency exchange rate.
The geographic strength of DEGT’s system was evident following last year’s devastating hurricanes.
Although the company’s Gulf Coast-area assets were temporarily affected, not a single contracted
customer in our Northeast market area missed a natural gas delivery during that trying time.
Other key 2005 successes included:
  • An agreement with CenterPoint Energy on a proposed pipeline to connect supply from East Texas
    basins to growing eastern U.S. markets
  • Acquisition from AGL Resources of the remaining 50 percent interest in Saltville Gas Storage,
    strengthening DEGT’s storage position in the Mid-Atlantic
  • A high rate of long-term contract renewals

  • Successful regulatory settlements which reduced volatility and created a stable rate environment
    for customers
  • In Canada, acquisition of the Empress liquids processing system, the transfer of Duke Energy
    Field Services’ gas processing operations to DEGT and the establishment of the Duke Energy
    Income Fund investment vehicle


                                                                                                                               25
                                                                                      DUKE ENERGY 2005 SUMMARY ANNUAL REPORT
• Agreements to expand Union Gas’                           Natural Gas Operations
         Dawn–Trafalgar transportation system to
         reach markets in Ontario, Quebec and the
         U.S. Northeast
       • Precedent agreements to expand the
         Maritimes & Northeast pipeline to transport                                 Calgary
                                                                         Vancouver
         natural gas to U.S. and Canadian markets from
         proposed liquefied natural gas import terminals                                                                                                   Halifax
         in Atlantic Canada.
                                                                                                                                                  Boston
                                                                                                                   Chatham

     DUKE ENERGY FIELD SERVICES                                                       Denver

     Duke Energy Field Services gathers, treats, compresses,                                                  Nashville
                                                                                                         Tulsa               Charlotte
     processes, transports, markets and stores natural gas;
                                                                                               Midland
     and produces, fractionates, transports, trades and markets                                   Houston
     natural gas liquids (NGL). DEFS is one of the largest natural gas
     gatherers in the United States, the largest NGL producer and one
     of the largest NGL marketers. DEFS owns or operates 54 plants
     and 56,000 miles of pipeline. It is a 50-50 joint venture between
                                                                                                                    Corporate Headquarters
     Duke Energy and ConocoPhillips.                                                                                Major Office Location
                                                                                                                    DEGT–Natural Gas Storage
                                                                                                                    DEGT–Natural Gas Processing Plant
                                                                                                                    DEGT–Wholesale Generation Plant
     Duke Energy Field Services (DEFS) is moving from a period of rapid growth to focus                             DEGT–Natural Gas Transmission Pipeline
                                                                                                                    DEGT–Natural Gas Liquids (NGL) Pipeline
     on selective growth and performance excellence — rigorously driving improvement                                DEGT–Union Gas Distribution Service Area
                                                                                                                    DEFS–Processing Plant
     in operations and in commercial and support activities. DEFS’ new master limited                               DEFS–Natural Gas Gathering Pipeline
     partnership, DCP Midstream Partners, will be an important growth vehicle, allowing                             DEFS–Propane Terminal

     for capital-efficient growth and solid cash flow. DEFS’ solid financial position provides
     options for deploying cash through reinvestment, debt repayment and dividends to its parent
     companies, Duke Energy and ConocoPhillips.
     For 2006, ongoing equity earnings to Duke Energy are anticipated to be approximately $500 million,
     assuming an average crude oil price of $61 per barrel.

     2005 Highlights

     Strong commodity prices as well as operational and commercial improvements more than offset
     disruptions from the Gulf Coast hurricanes to net record earnings for DEFS, which contributed
     $291 million in ongoing segment EBIT for the first six months of 2005. For the second half of the
     year, DEFS contributed $214 million in ongoing equity earnings as a result of a change in ownership
     with ConocoPhillips.
     It was a year to position DEFS for future success. In a restructuring move, Duke Energy sold
     nearly 20 percent of its ownership interest to DEFS partner ConocoPhillips, forming a 50/50 joint
     venture. DEFS’ natural gas gathering and processing assets in western Canada moved to Duke
     Energy Gas Transmission.
     DEFS also sold the general partner of TEPPCO to Enterprise GP Holdings L.P. for more than
     $1.1 billion, and created a new master limited partnership (MLP), DCP Midstream Partners LP.
     DEFS owns the general partner of the new MLP and operates its assets in Texas and Louisiana.


26
DUKE ENERGY AMERICAS

Duke Energy Americas includes the company’s major wholesale energy operations and commercial businesses.
With approximately 7,000 megawatts and 4,000 megawatts, respectively, in the United States and internationally,
Duke Energy Americas has a diverse mix of power generation facilities, and is engaged in the sale and marketing
of electric power, natural gas and generation services.


Duke Energy International

Duke Energy International (DEI) will continue to pursue organic growth opportunities for our existing
generation assets in Latin America and improve operational efficiency to increase the returns on
those assets.
For 2006, DEI is expected to deliver ongoing segment EBIT of approximately $275 million.

2005 Highlights

DEI exceeded expectations with segment EBIT of $314 million, compared to $222 million in 2004.
Those results were largely driven by improved Latin American operations (due primarily to favorable
pricing and weather conditions in Peru and Argentina), favorable currency exchange impacts in Brazil
and record earnings from National Methanol Co. due to higher commodity prices.
The improved results achieved by DEI in total, as well as on its portfolio of Latin American generation
assets, continued a positive earnings trend that began in 2003.
DEI’s operations continued to generate strong cash flow. During 2005, DEI took advantage of a one-
time opportunity to repatriate more than $500 million in foreign earnings to Duke Energy Corp. at a
lower tax rate.


North American Nonregulated Generation and Marketing

The merger with Cinergy gives our nonregulated generation and trading and marketing businesses a
fresh start. CG&E’s coal-fired merchant generation portfolio gains fuel diversity and reliability with the
addition of DENA’s Midwest fleet of new and efficient natural gas-fired plants. Now that the exit from
DENA’s legacy trading business is nearly complete, we are moving to Cinergy’s commercial business
model which focuses on transactions with contract terms of less than one year — a stronger
platform for growth.
Ongoing segment EBIT for North American Nonregulated Generation and Marketing in 2006 is
expected to be approximately $325 million.

2005 Highlights

Cinergy
Cinergy’s commercial businesses contributed approximately $443 million in adjusted EBIT in 2005,
compared to approximately $345 million in 2004. Power Operations, the group responsible for oper-
ating and maintaining Cinergy’s nonregulated power generation assets, set records for generation,
productivity and safety last year. The 26,608,001 megawatt-hours (MWH) of generation and an
average 40,503 MWH generated per employee beat previous Cinergy records set in 2000. Power
Operations employees and contractors also achieved their best-ever safety incident rate and logged
the lowest number of recordable incidents in company history.


                                                                                                                               27
                                                                                      DUKE ENERGY 2005 SUMMARY ANNUAL REPORT
The Power Trading and Portfolio Optimization groups each benefited from market conditions to deliver
     a solid year. Power Trading gross margins were up $46 million from the prior year. Portfolio
     Optimization sold emission allowances no longer needed to meet future non-retail commitments,
     which increased emission allowance gross margins by $121 million.
     Cinergy’s commercial businesses also realized a $37 million increase in retail margins, primarily
     resulting from implementation of our rate stabilization plan in Ohio.
     Cinergy Solutions implemented new efficiency measures for Procter & Gamble manufacturing plants,
     and was engaged to design, build, own and operate a new steam generating plant for Dow Chemical’s
     Union Carbide subsidiary.


     Duke Energy North America
     Duke Energy put most of Duke Energy North America’s (DENA) assets up for sale in September 2005,
     and announced in November the transfer of virtually all of DENA’s trading book of outstanding gas and
     power derivative contracts to Barclays Bank. That move essentially eliminated all credit, collateral,
     market and legal risk associated with DENA’s derivative trading positions.
     In January 2006, Duke Energy announced an agreement to sell DENA’s 6,200 megawatts of power
     generation in the western and northeastern United States to LS Power Equity Partners for approxi-
     mately $1.5 billion. DENA’s remaining 3,600 megawatts of generation in the Midwest are being
     combined with Cinergy’s commercial operations.
     (Note: For 2005, approximately $120 million of ongoing EBIT losses for DENA’s continuing operations
     were included in Other, and its discontinued results are reported in Discontinued Operations.)


     CRESCENT RESOURCES

     Crescent Resources manages land holdings and develops high-quality commercial, residential and multi-family
     real estate projects in nine states. Crescent Resources has received numerous awards for its environmentally
     sensitive property development strategies and partnerships with environmental and wildlife groups.


     Crescent Resources continues to focus on real estate development in growth markets, primarily in the
     southeastern and southwestern United States. The company will invest in commercial and residential
     opportunities based on earnings potential and geographic market demand.
     Crescent Resources is expected to deliver ongoing segment EBIT of approximately $250 million
     in 2006.

     2005 Highlights

     Crescent Resources continued to benefit from robust commercial and residential real estate markets,
     to end 2005 with segment EBIT of $314 million, compared to $240 million in 2004 — generating
     more earnings than anticipated for the second consecutive year.
     Crescent actively managed its real estate holdings to achieve gains on the sale of a site in Nashville,
     Tenn., to Nissan for its North American corporate headquarters, a legacy land tract in South Carolina,
     its interest in a portfolio of office buildings in Georgia and Florida, and 2,483 residential lots in the
     Carolinas, Georgia, Florida, Texas and Arizona.
     The book value of Crescent’s portfolio was $1.3 billion at year-end 2005, compared with $1.1 billion
     at the end of 2004.


28
C O N S O L I D AT E D S TAT E M E N T S O F O P E R AT I O N S
                                                                                               Years Ended December 31
(In millions, except per-share amounts)                                                     2005        2004        2003
Operating Revenues
 Nonregulated electric, natural gas, natural gas liquids, and other                       $ 7,661     $ 12,232    $ 10,088
 Regulated electric                                                                         5,406        5,041       4,851
 Regulated natural gas and natural gas liquids                                              3,679        3,276       3,082
     Total operating revenues                                                              16,746      20,549       18,021
Operating Expenses
 Natural gas and petroleum products purchased                                               6,279      10,156        8,479
 Operation, maintenance and other                                                           3,553       3,317        3,496
 Fuel used in electric generation and purchased power                                       1,584       1,576        1,465
 Depreciation and amortization                                                              1,728       1,750        1,675
 Property and other taxes                                                                     571         513          499
 Impairments and other charges                                                                140          64        1,219
 Impairment of goodwill                                                                        —           —           254
     Total operating expenses                                                              13,855      17,376       17,087
Gains on Sales of Investments in Commercial and Multi-Family Real Estate                     191          192             84
Gains (Losses) on Sales of Other Assets, net                                                 534          (404)          (199)
Operating Income                                                                            3,616        2,961           819
Other Income and Expenses
 Equity in earnings of unconsolidated affiliates                                              479         161            123
 Gains (Losses) on sales and impairments of equity method investments                       1,225           (4)          279
 Other income and expenses, net                                                                96         148            148
     Total other income and expenses                                                        1,800          305         550
Interest Expense                                                                            1,062        1,281       1,330
Minority Interest Expense                                                                     538          200          62
Earnings (Loss) from Continuing Operations Before Income Taxes                              3,816        1,785            (23)
Income Tax Expense (Benefit) from Continuing Operations                                     1,283          533            (94)
Income from Continuing Operations                                                           2,533        1,252          71
(Loss) Income from Discontinued Operations, net of tax                                       (705)         238      (1,232)
Income (Loss) Before Cumulative Effect of Change in Accounting Principle                    1,828        1,490      (1,161)
Cumulative Effect of Change in Accounting Principle,
  net of tax and minority interest                                                             (4)          —            (162)
Net Income (Loss)                                                                           1,824        1,490      (1,323)
Dividends and Premiums on Redemption of Preferred and Preference Stock                         12            9          15
Earnings (Loss) Available for Common Stockholders                                         $ 1,812     $ 1,481     $ (1,338)
Common Stock Data
 Weighted-average shares outstanding
   Basic                                                                                     934          931            903
   Diluted                                                                                   970          966            904
 Earnings per share (from continuing operations)
   Basic                                                                                   $ 2.69        $1.33      $ 0.06
   Diluted                                                                                 $ 2.61        $1.29      $ 0.06
 (Loss) Earnings per share (from discontinued operations)
   Basic                                                                                   $(0.75)       $0.26      $(1.36)
   Diluted                                                                                 $(0.73)       $0.25      $(1.36)
 Earnings (Loss) per share (before cumulative effect of change in accounting principle)
   Basic                                                                                   $ 1.94        $1.59      $(1.30)
   Diluted                                                                                 $ 1.88        $1.54      $(1.30)
 Earnings (Loss) per share
   Basic                                                                                   $ 1.94        $1.59      $(1.48)
   Diluted                                                                                 $ 1.88        $1.54      $(1.48)
 Dividends per share                                                                       $ 1.17        $1.10      $ 1.10
See Notes to Consolidated Financial Statements in Duke Energy’s 2005 Form 10-K.


                                                                                                                                   29
                                                                                          DUKE ENERGY 2005 SUMMARY ANNUAL REPORT
C O N S O L I D AT E D B A L A N C E S H E E T S
                                                                                                    December 31
     (In millions)                                                                         2005                   2004
     ASSETS
     Current Assets
       Cash and cash equivalents                                                       $     511              $     533
       Short-term investments                                                                632                   1,319
       Receivables (net of allowance for doubtful accounts
         of $127 at December 31, 2005 and $135 at December 31, 2004)                        2,580                  3,184
       Inventory                                                                             863                    942
       Assets held for sale                                                                 1,528                    40
       Unrealized gains on mark-to-market and hedging transactions                            87                    962
       Other                                                                                1,756                   938
           Total current assets                                                             7,957                  7,918
     Investments and Other Assets
       Investments in unconsolidated affiliates                                             1,933                  1,292
       Nuclear decommissioning trust funds                                                  1,504                  1,374
       Goodwill                                                                             3,775                  4,148
       Notes receivable                                                                      138                    232
       Unrealized gains on mark-to-market and hedging transactions                            62                   1,379
       Assets held for sale                                                                 3,597                    84
       Investments in residential, commercial and multi-family real estate
         (net of accumulated depreciation of $17 at December 31, 2005,
         and $15 at December 31, 2004)                                                      1,281                  1,128
       Other                                                                                2,743                  1,949
           Total investments and other assets                                              15,033                 11,586
     Property, Plant and Equipment
       Cost                                                                                40,574                 46,806
       Less accumulated depreciation and amortization                                      11,374                 13,000
           Net property, plant and equipment                                               29,200                 33,806
     Regulatory Assets and Deferred Debits
       Deferred debt expense                                                                 269                    297
       Regulatory assets related to income taxes                                            1,338                  1,269
       Other                                                                                 926                    894
           Total regulatory assets and deferred debits                                      2,533                  2,460
     Total Assets                                                                      $ 54,723               $ 55,770
     See Notes to Consolidated Financial Statements in Duke Energy’s 2005 Form 10-K.


30
December 31
(In millions)                                                                         2005                   2004
LIABILITIES AND COMMON STOCKHOLDERS’ EQUITY
Current Liabilities
 Accounts payable                                                                  $ 2,431               $ 2,414
 Notes payable and commercial paper                                                       83                    68
 Taxes accrued                                                                           327                   273
 Interest accrued                                                                        230                   287
 Liabilities associated with assets held for sale                                      1,488                    30
 Current maturities of long-term debt                                                  1,400                  1,832
 Unrealized losses on mark-to-market and hedging transactions                            204                   819
 Other                                                                                 2,255                  1,779

     Total current liabilities                                                         8,418                  7,502

Long-term Debt                                                                       14,547                  16,932

Deferred Credits and Other Liabilities
 Deferred income taxes                                                                 5,253                  5,228
 Investment tax credit                                                                   144                   154
 Unrealized losses on mark-to-market and hedging transactions                             10                   971
 Liabilities associated with assets held for sale                                      2,085                    14
 Asset retirement obligations                                                          2,058                  1,926
 Other                                                                                 5,020                  4,982

     Total deferred credits and other liabilities                                    14,570                  13,275

Commitments and Contingencies
Minority Interests                                                                       749                  1,486

Preferred and Preference Stock without Sinking Fund Requirements                          —                    134

Common Stockholders’ Equity
 Common stock, no par, 2 billion shares authorized; 928 million and 957 million
   shares outstanding at December 31, 2005, and December 31, 2004, respectively      10,388                  11,252
 Retained earnings                                                                     5,335                  4,539
 Accumulated other comprehensive income                                                  716                   650

     Total common stockholders’ equity                                               16,439                  16,441

Total Liabilities and Common Stockholders’ Equity                                  $ 54,723              $ 55,770
See Notes to Consolidated Financial Statements in Duke Energy’s 2005 Form 10-K.


                                                                                                                           31
                                                                                  DUKE ENERGY 2005 SUMMARY ANNUAL REPORT
Duke_Energy_2005_Annual_Report

Contenu connexe

Tendances

conoco phillips 2005First Quarter
conoco phillips 2005First Quarterconoco phillips 2005First Quarter
conoco phillips 2005First Quarter
finance1
 
Q1 2007 Earnings Release Financial Tables
 	Q1 2007 Earnings Release Financial Tables 	Q1 2007 Earnings Release Financial Tables
Q1 2007 Earnings Release Financial Tables
finance7
 
conoco phillips 2006Fourth Quarter
conoco phillips 2006Fourth Quarterconoco phillips 2006Fourth Quarter
conoco phillips 2006Fourth Quarter
finance1
 
viacom FINAL%20Q108%20Web%20Deck
viacom FINAL%20Q108%20Web%20Deckviacom FINAL%20Q108%20Web%20Deck
viacom FINAL%20Q108%20Web%20Deck
finance20
 
conoco phillips 2004Fourth Quarter
conoco phillips 2004Fourth Quarterconoco phillips 2004Fourth Quarter
conoco phillips 2004Fourth Quarter
finance1
 
marriott international Third Quarter 2007
marriott international Third Quarter 2007marriott international Third Quarter 2007
marriott international Third Quarter 2007
finance20
 
ameriprise 4Q05_Supplement
ameriprise 4Q05_Supplementameriprise 4Q05_Supplement
ameriprise 4Q05_Supplement
finance43
 
CLOrox fy05_q2_spmt
CLOrox   fy05_q2_spmtCLOrox   fy05_q2_spmt
CLOrox fy05_q2_spmt
finance48
 
conoco phillips 2006Second Quarter
conoco phillips 2006Second Quarterconoco phillips 2006Second Quarter
conoco phillips 2006Second Quarter
finance1
 
el paso 22758BEF-CBE8-4368-BDC6-D02434EE5C13_EP_4Q08OpStatsFinal
el paso 22758BEF-CBE8-4368-BDC6-D02434EE5C13_EP_4Q08OpStatsFinalel paso 22758BEF-CBE8-4368-BDC6-D02434EE5C13_EP_4Q08OpStatsFinal
el paso 22758BEF-CBE8-4368-BDC6-D02434EE5C13_EP_4Q08OpStatsFinal
finance49
 
conoco phillips 2004Second Quarter
conoco phillips 2004Second Quarterconoco phillips 2004Second Quarter
conoco phillips 2004Second Quarter
finance1
 
ecolab 2_DscrptBusnFinHighlight
ecolab  2_DscrptBusnFinHighlightecolab  2_DscrptBusnFinHighlight
ecolab 2_DscrptBusnFinHighlight
finance37
 
energy east 2Q08_EAS_release
energy east 2Q08_EAS_releaseenergy east 2Q08_EAS_release
energy east 2Q08_EAS_release
finance40
 

Tendances (16)

conoco phillips 2005First Quarter
conoco phillips 2005First Quarterconoco phillips 2005First Quarter
conoco phillips 2005First Quarter
 
Q1 2007 Earnings Release Financial Tables
 	Q1 2007 Earnings Release Financial Tables 	Q1 2007 Earnings Release Financial Tables
Q1 2007 Earnings Release Financial Tables
 
conoco phillips 2006Fourth Quarter
conoco phillips 2006Fourth Quarterconoco phillips 2006Fourth Quarter
conoco phillips 2006Fourth Quarter
 
viacom FINAL%20Q108%20Web%20Deck
viacom FINAL%20Q108%20Web%20Deckviacom FINAL%20Q108%20Web%20Deck
viacom FINAL%20Q108%20Web%20Deck
 
conoco phillips 2004Fourth Quarter
conoco phillips 2004Fourth Quarterconoco phillips 2004Fourth Quarter
conoco phillips 2004Fourth Quarter
 
Amd Q208 Financials
Amd Q208 FinancialsAmd Q208 Financials
Amd Q208 Financials
 
marriott international Third Quarter 2007
marriott international Third Quarter 2007marriott international Third Quarter 2007
marriott international Third Quarter 2007
 
Q1 2009 Earning Report of Potlatch Corp
Q1 2009 Earning Report of Potlatch CorpQ1 2009 Earning Report of Potlatch Corp
Q1 2009 Earning Report of Potlatch Corp
 
ameriprise 4Q05_Supplement
ameriprise 4Q05_Supplementameriprise 4Q05_Supplement
ameriprise 4Q05_Supplement
 
CLOrox fy05_q2_spmt
CLOrox   fy05_q2_spmtCLOrox   fy05_q2_spmt
CLOrox fy05_q2_spmt
 
conoco phillips 2006Second Quarter
conoco phillips 2006Second Quarterconoco phillips 2006Second Quarter
conoco phillips 2006Second Quarter
 
el paso 22758BEF-CBE8-4368-BDC6-D02434EE5C13_EP_4Q08OpStatsFinal
el paso 22758BEF-CBE8-4368-BDC6-D02434EE5C13_EP_4Q08OpStatsFinalel paso 22758BEF-CBE8-4368-BDC6-D02434EE5C13_EP_4Q08OpStatsFinal
el paso 22758BEF-CBE8-4368-BDC6-D02434EE5C13_EP_4Q08OpStatsFinal
 
conoco phillips 2004Second Quarter
conoco phillips 2004Second Quarterconoco phillips 2004Second Quarter
conoco phillips 2004Second Quarter
 
ecolab 2_DscrptBusnFinHighlight
ecolab  2_DscrptBusnFinHighlightecolab  2_DscrptBusnFinHighlight
ecolab 2_DscrptBusnFinHighlight
 
9M 2008 Results
9M 2008 Results9M 2008 Results
9M 2008 Results
 
energy east 2Q08_EAS_release
energy east 2Q08_EAS_releaseenergy east 2Q08_EAS_release
energy east 2Q08_EAS_release
 

Similaire à Duke_Energy_2005_Annual_Report

advanced micro devices Q408Financials
advanced micro devices Q408Financialsadvanced micro devices Q408Financials
advanced micro devices Q408Financials
finance34
 
advanced micro devices Q408Financials
advanced micro devices Q408Financialsadvanced micro devices Q408Financials
advanced micro devices Q408Financials
finance34
 
AMD Q408Financials
AMD Q408FinancialsAMD Q408Financials
AMD Q408Financials
finance34
 
AMD-Q408Financials
AMD-Q408FinancialsAMD-Q408Financials
AMD-Q408Financials
finance34
 
AMD Q408Financials
AMD Q408FinancialsAMD Q408Financials
AMD Q408Financials
finance34
 
cummins ar2003
cummins  ar2003cummins  ar2003
cummins ar2003
finance21
 
fredie mac financial-statement
fredie mac financial-statementfredie mac financial-statement
fredie mac financial-statement
finance6
 
el paso 22758BEF-CBE8-4368-BDC6-D02434EE5C13_EP_4Q08OpStatsFinal
el paso 22758BEF-CBE8-4368-BDC6-D02434EE5C13_EP_4Q08OpStatsFinalel paso 22758BEF-CBE8-4368-BDC6-D02434EE5C13_EP_4Q08OpStatsFinal
el paso 22758BEF-CBE8-4368-BDC6-D02434EE5C13_EP_4Q08OpStatsFinal
finance49
 
22758BEF-CBE8-4368-BDC6-D02434EE5C13_EP_4Q08OpStatsFinal
22758BEF-CBE8-4368-BDC6-D02434EE5C13_EP_4Q08OpStatsFinal22758BEF-CBE8-4368-BDC6-D02434EE5C13_EP_4Q08OpStatsFinal
22758BEF-CBE8-4368-BDC6-D02434EE5C13_EP_4Q08OpStatsFinal
finance49
 
morgan stanley Annual Reports 2001
morgan stanley  Annual Reports 2001 morgan stanley  Annual Reports 2001
morgan stanley Annual Reports 2001
finance2
 
4Q06OpStats_FNAL_022307
4Q06OpStats_FNAL_0223074Q06OpStats_FNAL_022307
4Q06OpStats_FNAL_022307
finance49
 
4Q06OpStats_FNAL_022307
4Q06OpStats_FNAL_0223074Q06OpStats_FNAL_022307
4Q06OpStats_FNAL_022307
finance49
 
United Health Group Form 8-K Related to Earnings Release
United Health Group Form 8-K Related to Earnings ReleaseUnited Health Group Form 8-K Related to Earnings Release
United Health Group Form 8-K Related to Earnings Release
finance3
 
advanced micro devices Q208Financials
advanced micro devices Q208Financialsadvanced micro devices Q208Financials
advanced micro devices Q208Financials
finance34
 
conoco phillips 2005Fourth Quarter
conoco phillips 2005Fourth Quarterconoco phillips 2005Fourth Quarter
conoco phillips 2005Fourth Quarter
finance1
 
07/30/03_Reg_G
07/30/03_Reg_G07/30/03_Reg_G
07/30/03_Reg_G
finance21
 
Duke Energy Non GAAP-Q203
 Duke Energy Non GAAP-Q203 Duke Energy Non GAAP-Q203
Duke Energy Non GAAP-Q203
finance21
 

Similaire à Duke_Energy_2005_Annual_Report (20)

4Q05OpStats
4Q05OpStats4Q05OpStats
4Q05OpStats
 
advanced micro devices Q408Financials
advanced micro devices Q408Financialsadvanced micro devices Q408Financials
advanced micro devices Q408Financials
 
advanced micro devices Q408Financials
advanced micro devices Q408Financialsadvanced micro devices Q408Financials
advanced micro devices Q408Financials
 
AMD Q408Financials
AMD Q408FinancialsAMD Q408Financials
AMD Q408Financials
 
AMD-Q408Financials
AMD-Q408FinancialsAMD-Q408Financials
AMD-Q408Financials
 
AMD Q408Financials
AMD Q408FinancialsAMD Q408Financials
AMD Q408Financials
 
cummins ar2003
cummins  ar2003cummins  ar2003
cummins ar2003
 
fredie mac financial-statement
fredie mac financial-statementfredie mac financial-statement
fredie mac financial-statement
 
el paso 22758BEF-CBE8-4368-BDC6-D02434EE5C13_EP_4Q08OpStatsFinal
el paso 22758BEF-CBE8-4368-BDC6-D02434EE5C13_EP_4Q08OpStatsFinalel paso 22758BEF-CBE8-4368-BDC6-D02434EE5C13_EP_4Q08OpStatsFinal
el paso 22758BEF-CBE8-4368-BDC6-D02434EE5C13_EP_4Q08OpStatsFinal
 
22758BEF-CBE8-4368-BDC6-D02434EE5C13_EP_4Q08OpStatsFinal
22758BEF-CBE8-4368-BDC6-D02434EE5C13_EP_4Q08OpStatsFinal22758BEF-CBE8-4368-BDC6-D02434EE5C13_EP_4Q08OpStatsFinal
22758BEF-CBE8-4368-BDC6-D02434EE5C13_EP_4Q08OpStatsFinal
 
morgan stanley Annual Reports 2001
morgan stanley  Annual Reports 2001 morgan stanley  Annual Reports 2001
morgan stanley Annual Reports 2001
 
Consolidated Financial Statements 2010
Consolidated Financial Statements 2010Consolidated Financial Statements 2010
Consolidated Financial Statements 2010
 
4Q06OpStats_FNAL_022307
4Q06OpStats_FNAL_0223074Q06OpStats_FNAL_022307
4Q06OpStats_FNAL_022307
 
4Q06OpStats_FNAL_022307
4Q06OpStats_FNAL_0223074Q06OpStats_FNAL_022307
4Q06OpStats_FNAL_022307
 
United Health Group Form 8-K Related to Earnings Release
United Health Group Form 8-K Related to Earnings ReleaseUnited Health Group Form 8-K Related to Earnings Release
United Health Group Form 8-K Related to Earnings Release
 
advanced micro devices Q208Financials
advanced micro devices Q208Financialsadvanced micro devices Q208Financials
advanced micro devices Q208Financials
 
conoco phillips 2005Fourth Quarter
conoco phillips 2005Fourth Quarterconoco phillips 2005Fourth Quarter
conoco phillips 2005Fourth Quarter
 
07/30/03_Reg_G
07/30/03_Reg_G07/30/03_Reg_G
07/30/03_Reg_G
 
Duke Energy Non GAAP-Q203
 Duke Energy Non GAAP-Q203 Duke Energy Non GAAP-Q203
Duke Energy Non GAAP-Q203
 
itw finan
itw finanitw finan
itw finan
 

Plus de finance21

ConAgra June92003Q&A
ConAgra June92003Q&AConAgra June92003Q&A
ConAgra June92003Q&A
finance21
 
ConAgraFY04Q1
ConAgraFY04Q1ConAgraFY04Q1
ConAgraFY04Q1
finance21
 
ConAgra UAP10-03
ConAgra UAP10-03ConAgra UAP10-03
ConAgra UAP10-03
finance21
 
ConAgra DealClosing11-03
ConAgra DealClosing11-03ConAgra DealClosing11-03
ConAgra DealClosing11-03
finance21
 
ConAgra DealClosingb11-03
ConAgra DealClosingb11-03ConAgra DealClosingb11-03
ConAgra DealClosingb11-03
finance21
 
SharePurchase12-03
SharePurchase12-03SharePurchase12-03
SharePurchase12-03
finance21
 
ConAgra Q2Dec03
ConAgra Q2Dec03ConAgra Q2Dec03
ConAgra Q2Dec03
finance21
 
ConAgra Q3Mar04
ConAgra Q3Mar04ConAgra Q3Mar04
ConAgra Q3Mar04
finance21
 
ConAgra Q4Jul04
ConAgra Q4Jul04ConAgra Q4Jul04
ConAgra Q4Jul04
finance21
 
ConAgra Q1Sept22-04
ConAgra Q1Sept22-04ConAgra Q1Sept22-04
ConAgra Q1Sept22-04
finance21
 
ConAgra Q2Dec04
ConAgra Q2Dec04ConAgra Q2Dec04
ConAgra Q2Dec04
finance21
 
ConAgra Q4Jun05
ConAgra Q4Jun05ConAgra Q4Jun05
ConAgra Q4Jun05
finance21
 
ConAgra QAFY06Q1
ConAgra QAFY06Q1ConAgra QAFY06Q1
ConAgra QAFY06Q1
finance21
 
ConAgra QAFY06Q2
ConAgra QAFY06Q2ConAgra QAFY06Q2
ConAgra QAFY06Q2
finance21
 
ConAgra QAFY06Q3
ConAgra QAFY06Q3ConAgra QAFY06Q3
ConAgra QAFY06Q3
finance21
 
ConAgra QAFY06Q4
ConAgra QAFY06Q4ConAgra QAFY06Q4
ConAgra QAFY06Q4
finance21
 
ConAgra QAFY07Q1
ConAgra QAFY07Q1ConAgra QAFY07Q1
ConAgra QAFY07Q1
finance21
 
ConAgra QAFY07Q2
ConAgra QAFY07Q2ConAgra QAFY07Q2
ConAgra QAFY07Q2
finance21
 
ConAgra QAFY07Q3
ConAgra QAFY07Q3ConAgra QAFY07Q3
ConAgra QAFY07Q3
finance21
 

Plus de finance21 (20)

ConAgra June92003Q&A
ConAgra June92003Q&AConAgra June92003Q&A
ConAgra June92003Q&A
 
ConAgraFY04Q1
ConAgraFY04Q1ConAgraFY04Q1
ConAgraFY04Q1
 
ConAgra UAP10-03
ConAgra UAP10-03ConAgra UAP10-03
ConAgra UAP10-03
 
ConAgra DealClosing11-03
ConAgra DealClosing11-03ConAgra DealClosing11-03
ConAgra DealClosing11-03
 
ConAgra DealClosingb11-03
ConAgra DealClosingb11-03ConAgra DealClosingb11-03
ConAgra DealClosingb11-03
 
SharePurchase12-03
SharePurchase12-03SharePurchase12-03
SharePurchase12-03
 
ConAgra Q2Dec03
ConAgra Q2Dec03ConAgra Q2Dec03
ConAgra Q2Dec03
 
ConAgra Q3Mar04
ConAgra Q3Mar04ConAgra Q3Mar04
ConAgra Q3Mar04
 
ConAgra Q4Jul04
ConAgra Q4Jul04ConAgra Q4Jul04
ConAgra Q4Jul04
 
ConAgra Q1Sept22-04
ConAgra Q1Sept22-04ConAgra Q1Sept22-04
ConAgra Q1Sept22-04
 
ConAgra Q2Dec04
ConAgra Q2Dec04ConAgra Q2Dec04
ConAgra Q2Dec04
 
Q3Mar05
Q3Mar05Q3Mar05
Q3Mar05
 
ConAgra Q4Jun05
ConAgra Q4Jun05ConAgra Q4Jun05
ConAgra Q4Jun05
 
ConAgra QAFY06Q1
ConAgra QAFY06Q1ConAgra QAFY06Q1
ConAgra QAFY06Q1
 
ConAgra QAFY06Q2
ConAgra QAFY06Q2ConAgra QAFY06Q2
ConAgra QAFY06Q2
 
ConAgra QAFY06Q3
ConAgra QAFY06Q3ConAgra QAFY06Q3
ConAgra QAFY06Q3
 
ConAgra QAFY06Q4
ConAgra QAFY06Q4ConAgra QAFY06Q4
ConAgra QAFY06Q4
 
ConAgra QAFY07Q1
ConAgra QAFY07Q1ConAgra QAFY07Q1
ConAgra QAFY07Q1
 
ConAgra QAFY07Q2
ConAgra QAFY07Q2ConAgra QAFY07Q2
ConAgra QAFY07Q2
 
ConAgra QAFY07Q3
ConAgra QAFY07Q3ConAgra QAFY07Q3
ConAgra QAFY07Q3
 

Dernier

( Jasmin ) Top VIP Escorts Service Dindigul 💧 7737669865 💧 by Dindigul Call G...
( Jasmin ) Top VIP Escorts Service Dindigul 💧 7737669865 💧 by Dindigul Call G...( Jasmin ) Top VIP Escorts Service Dindigul 💧 7737669865 💧 by Dindigul Call G...
( Jasmin ) Top VIP Escorts Service Dindigul 💧 7737669865 💧 by Dindigul Call G...
dipikadinghjn ( Why You Choose Us? ) Escorts
 
VIP Independent Call Girls in Mira Bhayandar 🌹 9920725232 ( Call Me ) Mumbai ...
VIP Independent Call Girls in Mira Bhayandar 🌹 9920725232 ( Call Me ) Mumbai ...VIP Independent Call Girls in Mira Bhayandar 🌹 9920725232 ( Call Me ) Mumbai ...
VIP Independent Call Girls in Mira Bhayandar 🌹 9920725232 ( Call Me ) Mumbai ...
dipikadinghjn ( Why You Choose Us? ) Escorts
 
VIP Independent Call Girls in Bandra West 🌹 9920725232 ( Call Me ) Mumbai Esc...
VIP Independent Call Girls in Bandra West 🌹 9920725232 ( Call Me ) Mumbai Esc...VIP Independent Call Girls in Bandra West 🌹 9920725232 ( Call Me ) Mumbai Esc...
VIP Independent Call Girls in Bandra West 🌹 9920725232 ( Call Me ) Mumbai Esc...
dipikadinghjn ( Why You Choose Us? ) Escorts
 
VIP Call Girl in Mira Road 💧 9920725232 ( Call Me ) Get A New Crush Everyday ...
VIP Call Girl in Mira Road 💧 9920725232 ( Call Me ) Get A New Crush Everyday ...VIP Call Girl in Mira Road 💧 9920725232 ( Call Me ) Get A New Crush Everyday ...
VIP Call Girl in Mira Road 💧 9920725232 ( Call Me ) Get A New Crush Everyday ...
dipikadinghjn ( Why You Choose Us? ) Escorts
 

Dernier (20)

( Jasmin ) Top VIP Escorts Service Dindigul 💧 7737669865 💧 by Dindigul Call G...
( Jasmin ) Top VIP Escorts Service Dindigul 💧 7737669865 💧 by Dindigul Call G...( Jasmin ) Top VIP Escorts Service Dindigul 💧 7737669865 💧 by Dindigul Call G...
( Jasmin ) Top VIP Escorts Service Dindigul 💧 7737669865 💧 by Dindigul Call G...
 
The Economic History of the U.S. Lecture 30.pdf
The Economic History of the U.S. Lecture 30.pdfThe Economic History of the U.S. Lecture 30.pdf
The Economic History of the U.S. Lecture 30.pdf
 
The Economic History of the U.S. Lecture 20.pdf
The Economic History of the U.S. Lecture 20.pdfThe Economic History of the U.S. Lecture 20.pdf
The Economic History of the U.S. Lecture 20.pdf
 
WhatsApp 📞 Call : 9892124323 ✅Call Girls In Chembur ( Mumbai ) secure service
WhatsApp 📞 Call : 9892124323  ✅Call Girls In Chembur ( Mumbai ) secure serviceWhatsApp 📞 Call : 9892124323  ✅Call Girls In Chembur ( Mumbai ) secure service
WhatsApp 📞 Call : 9892124323 ✅Call Girls In Chembur ( Mumbai ) secure service
 
The Economic History of the U.S. Lecture 25.pdf
The Economic History of the U.S. Lecture 25.pdfThe Economic History of the U.S. Lecture 25.pdf
The Economic History of the U.S. Lecture 25.pdf
 
Booking open Available Pune Call Girls Wadgaon Sheri 6297143586 Call Hot Ind...
Booking open Available Pune Call Girls Wadgaon Sheri  6297143586 Call Hot Ind...Booking open Available Pune Call Girls Wadgaon Sheri  6297143586 Call Hot Ind...
Booking open Available Pune Call Girls Wadgaon Sheri 6297143586 Call Hot Ind...
 
VIP Independent Call Girls in Mira Bhayandar 🌹 9920725232 ( Call Me ) Mumbai ...
VIP Independent Call Girls in Mira Bhayandar 🌹 9920725232 ( Call Me ) Mumbai ...VIP Independent Call Girls in Mira Bhayandar 🌹 9920725232 ( Call Me ) Mumbai ...
VIP Independent Call Girls in Mira Bhayandar 🌹 9920725232 ( Call Me ) Mumbai ...
 
Vip Call US 📞 7738631006 ✅Call Girls In Sakinaka ( Mumbai )
Vip Call US 📞 7738631006 ✅Call Girls In Sakinaka ( Mumbai )Vip Call US 📞 7738631006 ✅Call Girls In Sakinaka ( Mumbai )
Vip Call US 📞 7738631006 ✅Call Girls In Sakinaka ( Mumbai )
 
The Economic History of the U.S. Lecture 23.pdf
The Economic History of the U.S. Lecture 23.pdfThe Economic History of the U.S. Lecture 23.pdf
The Economic History of the U.S. Lecture 23.pdf
 
Gurley shaw Theory of Monetary Economics.
Gurley shaw Theory of Monetary Economics.Gurley shaw Theory of Monetary Economics.
Gurley shaw Theory of Monetary Economics.
 
Indore Real Estate Market Trends Report.pdf
Indore Real Estate Market Trends Report.pdfIndore Real Estate Market Trends Report.pdf
Indore Real Estate Market Trends Report.pdf
 
05_Annelore Lenoir_Docbyte_MeetupDora&Cybersecurity.pptx
05_Annelore Lenoir_Docbyte_MeetupDora&Cybersecurity.pptx05_Annelore Lenoir_Docbyte_MeetupDora&Cybersecurity.pptx
05_Annelore Lenoir_Docbyte_MeetupDora&Cybersecurity.pptx
 
06_Joeri Van Speybroek_Dell_MeetupDora&Cybersecurity.pdf
06_Joeri Van Speybroek_Dell_MeetupDora&Cybersecurity.pdf06_Joeri Van Speybroek_Dell_MeetupDora&Cybersecurity.pdf
06_Joeri Van Speybroek_Dell_MeetupDora&Cybersecurity.pdf
 
VIP Independent Call Girls in Bandra West 🌹 9920725232 ( Call Me ) Mumbai Esc...
VIP Independent Call Girls in Bandra West 🌹 9920725232 ( Call Me ) Mumbai Esc...VIP Independent Call Girls in Bandra West 🌹 9920725232 ( Call Me ) Mumbai Esc...
VIP Independent Call Girls in Bandra West 🌹 9920725232 ( Call Me ) Mumbai Esc...
 
VVIP Pune Call Girls Katraj (7001035870) Pune Escorts Nearby with Complete Sa...
VVIP Pune Call Girls Katraj (7001035870) Pune Escorts Nearby with Complete Sa...VVIP Pune Call Girls Katraj (7001035870) Pune Escorts Nearby with Complete Sa...
VVIP Pune Call Girls Katraj (7001035870) Pune Escorts Nearby with Complete Sa...
 
Stock Market Brief Deck (Under Pressure).pdf
Stock Market Brief Deck (Under Pressure).pdfStock Market Brief Deck (Under Pressure).pdf
Stock Market Brief Deck (Under Pressure).pdf
 
Mira Road Awesome 100% Independent Call Girls NUmber-9833754194-Dahisar Inter...
Mira Road Awesome 100% Independent Call Girls NUmber-9833754194-Dahisar Inter...Mira Road Awesome 100% Independent Call Girls NUmber-9833754194-Dahisar Inter...
Mira Road Awesome 100% Independent Call Girls NUmber-9833754194-Dahisar Inter...
 
VIP Call Girl in Mira Road 💧 9920725232 ( Call Me ) Get A New Crush Everyday ...
VIP Call Girl in Mira Road 💧 9920725232 ( Call Me ) Get A New Crush Everyday ...VIP Call Girl in Mira Road 💧 9920725232 ( Call Me ) Get A New Crush Everyday ...
VIP Call Girl in Mira Road 💧 9920725232 ( Call Me ) Get A New Crush Everyday ...
 
TEST BANK For Corporate Finance, 13th Edition By Stephen Ross, Randolph Weste...
TEST BANK For Corporate Finance, 13th Edition By Stephen Ross, Randolph Weste...TEST BANK For Corporate Finance, 13th Edition By Stephen Ross, Randolph Weste...
TEST BANK For Corporate Finance, 13th Edition By Stephen Ross, Randolph Weste...
 
(INDIRA) Call Girl Mumbai Call Now 8250077686 Mumbai Escorts 24x7
(INDIRA) Call Girl Mumbai Call Now 8250077686 Mumbai Escorts 24x7(INDIRA) Call Girl Mumbai Call Now 8250077686 Mumbai Escorts 24x7
(INDIRA) Call Girl Mumbai Call Now 8250077686 Mumbai Escorts 24x7
 

Duke_Energy_2005_Annual_Report

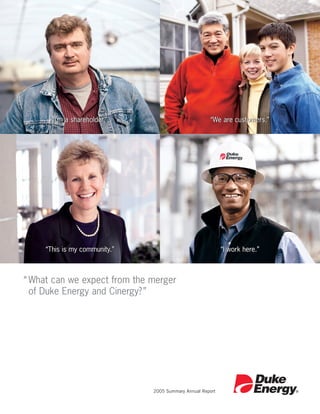
  • 1. “I’m a shareholder.” “We are customers.” “This is my community.” “I work here.” “ What can we expect from the merger of Duke Energy and Cinergy? ” 2005 Summary Annual Report
  • 2. IN THIS REPORT 2 FINANCIAL HIGHLIGHTS 3 CHAIRMAN’S LETTER TO STAKEHOLDERS 9 2006 DUKE ENERGY CHARTER 11 CEO’S LETTER TO STAKEHOLDERS 17 THE NEW DUKE ENERGY 21 U.S. FRANCHISED ELECTRIC AND GAS 25 DUKE ENERGY GAS TRANSMISSION 26 DUKE ENERGY FIELD SERVICES 27 DUKE ENERGY AMERICAS 28 CRESCENT RESOURCES 29 CONSOLIDATED FINANCIAL STATEMENTS 34 BOARD OF DIRECTORS 36 EXECUTIVE MANAGEMENT 38 NON-GAAP FINANCIAL MEASURES 41 INVESTOR INFORMATION Safe Harbor Statement Under the Private Securities Litigation Reform Act of 1995 This document contains forward-looking information which is subject to risks and uncertainties that could cause actual results to be different than those contemplated, including, but not limited to: changes in state, federal or international regulatory environments; commercial, industrial and residential growth in the company’s service territory; the weather and other natural phenomena; the timing and extent of changes in commodity prices, interest rates and foreign currency exchange rates; general economic conditions; changes in environmental and other laws and regula- tions to which Duke Energy and its subsidiaries are subject, or other external factors over which Duke Energy has no control; the results of financing efforts; the effect of accounting pronouncements; growth in opportunities for Duke Energy’s business units; and other risks described in the 2005 Form 10-Ks filed by Duke Energy and Cinergy Corp., the registration statement on Form S-4 filed by Duke Energy and other Securities and Exchange Commission filings. The company undertakes no obligation to publicly update or revise any forward-looking statements, whether as a result of new information, future events or otherwise.
  • 3. What can you expect from this merger? You can expect a company committed to its many stakeholders. That means increasing value for our investors. Delivering reliable and affordable service to our customers. Supporting and enhancing our local communities. Providing a safe and rewarding workplace for our employees. Growing our business, while sustaining the environment and quality of life. To find out more, read on...
  • 4. FINANCIAL HIGHLIGHTSa 2003c (In millions, except per-share amounts) 2005 2004 2002 2001 Statement of Operations Operating revenues $ 16,746 $ 20,549 $ 18,021 $ 14,752 $ 15,383 Operating expenses 13,855 17,376 17,087 12,393 13,036 Gains on sales of investments in commercial and multi-family real estate 191 192 84 106 106 Gains (losses) on sales of other assets, net 534 (404) (199) 32 238 Operating income 3,616 2,961 819 2,497 2,691 Other income and expenses, net 1,800 305 550 369 293 Interest expense 1,062 1,281 1,330 1,116 777 Minority interest expense 538 200 62 91 268 Earnings (loss) from continuing operations before income taxes 3,816 1,785 (23) 1,659 1,939 Income tax expense (benefit) from continuing operations 1,283 533 (94) 514 713 Income from continuing operations 2,533 1,252 71 1,145 1,226 (Loss) income from discontinued operations, net of tax (705) 238 (1,232) (111) 768 Income (loss) before cumulative effect of change in accounting principle 1,828 1,490 (1,161) 1,034 1,994 Cumulative effect of change in accounting principle, net of tax and minority interest (4) — (162) — (96) Net income (loss) 1,824 1,490 (1,323) 1,034 1,898 Dividends and premiums on redemption of preferred and preference stock 12 9 15 13 14 Earnings (loss) available for common stockholders $ 1,812 $ 1,481 $ (1,338) $ 1,021 $ 1,884 Ratio of Earnings to Fixed Chargesd —b 4.7 2.4 2.1 2.8 Common Stock Data Shares of common stock outstanding Year-end 928 957 911 895 777 Weighted average–basic 934 931 903 836 767 Weighted average–diluted 970 966 904 838 773 Earnings (loss) per share Basic $1.94 $1.59 $(1.48) $1.22 $2.45 Diluted 1.88 1.54 (1.48) 1.22 2.44 Dividends per share 1.17 1.10 1.10 1.10 1.10 Balance Sheet Total assets $ 54,723 $ 55,770 $ 57,485 $ 60,122 $ 49,624 Long-term debt including capital leases, less current maturities $ 14,547 $ 16,932 $ 20,622 $ 20,221 $ 12,321 Capitalization Common equity 50% 45% 37% 36% 41% Preferred stock 0% 0% 0% 1% 1% Trust preferred securities 0% 0% 0% 3% 5% Total common equity and preferred securities 50% 45% 37% 40% 47% Minority interests 2% 4% 5% 5% 7% Total debt 48% 51% 58% 55% 46% a Significant transactions reflected in the results above include: 2005 DENA disposition (see Note 13 to the Consolidated Financial Statements, “Discontinued Operations and Assets Held for Sale”), 2005 deconsolidation of DEFS effective July 1, 2005 (see Note 2 to the Consolidated Financial Statements, “Acquisitions and Dispositions”), 2005 DEFS sale of TEPPCO (see Note 2 to the Consolidated Financial Statements, “Acquisitions and Dispositions”), 2004 DENA sale of the Southeast plants (see Note 2 to the Consolidated Financial Statements, “Acquisitions and Dispositions”) and 2003 DENA charges (see Note 13 to the Consolidated Financial Statements, “Discontinued Operations and Assets Held for Sale”). b Earnings were inadequate to cover fixed charges by $19 million for the year ended December 31, 2003. c As of January 1, 2003, Duke Energy adopted the remaining provisions of Emerging Issues Task Force (EITF) 02-03, “Issues Involved in Accounting for Derivative Contracts Held for Trading Purposes and for Contracts Involved in Energy Trading and Risk Management Activities” (EITF 02-03) and SFAS No. 143, “Accounting for Asset Retirement Obligations.” In accordance with the transition guidance for these standards, Duke Energy recorded a net-of-tax and minority interest cumulative effect adjustment for change in accounting principles. (See Note 1 to the Consolidated Financial Statements, “Summary of Significant Accounting Policies,” for further discussion.) d Includes pre-tax gains on the sale of TEPPCO GP and LP of approximately $0.9 billion, net of minority interest, in 2005. See Notes to Consolidated Financial Statements in Duke Energy’s 2005 Form 10-K. 2
  • 5. Paul M. Anderson Chairman of the Board Dear Fellow Stakeholder, This report comes to you at an important juncture in our company’s history — actually, in the history of two companies. Many of you have recently become Duke Energy shareholders as a result of our merger with Cinergy. I welcome you to Duke Energy, and I welcome this opportunity to give all of our investors a first glimpse of the combined company. We believe this merger is good for everyone who has a stake in our success, and this report will tell you why. But first, let me recap the events of 2005 that brought us to where we are today. For Duke Energy, 2005 was a year of transition. We repositioned the company to reduce risk, capture value for shareholders and create a flexible platform for future growth. We took a number of decisive steps and implemented them swiftly, but deliberately. The result is a whole “new” Duke Energy, with a revised business model for our electric operations and greater flexibility for the rest of the portfolio. CAPTURING VALUE We began the year by announcing the transfer of a 19.7 percent interest in Duke Energy Field Services (DEFS) to our partner ConocoPhillips for about $1.1 billion in cash and assets. At the same time, DEFS sold its interest in TEPPCO for another $1.1 billion. The company used part of those proceeds to buy back 32.6 million shares of common stock, and raised the quarterly dividend by 12.7 percent. The assets transferred as part of the DEFS/ConocoPhillips deal positioned DEFS to launch a new master limited partnership (DCP Midstream Partners) in the United States, and allowed Duke Energy 3 DUKE ENERGY 2005 SUMMARY ANNUAL REPORT
  • 6. Gas Transmission (DEGT) to create a similar investment vehicle in Canada. These tax-efficient vehicles feature a lower cost of capital, allowing us to better compete for future acquisitions. At the operating level, each of our major businesses met their profit goals while pursuing growth opportunities. Later in this report, you will find their 2005 highlights, along with those of Cinergy’s businesses. I would only add that I am quite proud of their performance. On a less dramatic scale, we continued to reduce our backlog of litigation and to exit from non-core legacy projects and businesses. That relentless focus helped us to exceed our profit targets for the year. POSITIONING FOR THE FUTURE We took two major actions to position ourselves for the future. The first was the decision to merge with Cinergy to create the foundation for our future electric business. The second was the decision to exit all of Duke Energy North America’s (DENA’s) trading positions and operations, except for assets in the Midwest. For the foreseeable future, it appears that the electric industry will remain stalled somewhere between a regulated/integrated model and an unregulated/disaggregated model. Many states are testing their models, but none appear eager for wholesale change. As a result, the rules of the regulatory game are evolving. At the same time, increasingly stringent environmental standards, growing concern about greenhouse gases, skyrocketing fossil-fuel prices and a need to develop the next generation of capacity will challenge the industry like it has never been challenged before. Massive investments will be required at a time when customers are becoming more and more concerned about price and reliability. The combination of these factors will drive the industry to create super-regional consolidated players that have economies of scale, financial strength and organizational flexibility. It is a pattern we have seen in banking and other industries under similar circumstances. Duke Energy intends to be a consolidator in this new environment. The merger with Cinergy is a first step, providing not only scale and diversity, but also an opportunity to remodel our electric business to better face future challenges, while continuing to provide reliable and affordable service to our customers. The new model provides the opportunity for growth beyond Duke Power’s historical service territory, giving our electric operations the scale and flexibility to operate as a stand-alone business in this changing environment. REDUCING RISK Our newly combined electric fleet uses a diverse combination of fuels — nuclear, coal, gas and hydro — reducing our dependence on any one commodity. We also operate in diverse markets, blending higher-growth opportunities in the Carolinas with more moderate but steady growth in the Midwest. Our geographic diversity reduces year-to-year weather volatility. And operations in five separate regulatory 4
  • 7. jurisdictions allow us to pursue regulatory initiatives specific to the needs of customers in each service area, while broadly applying best practices in customer service. Our decision to exit DENA outside the Midwest was a logical follow-on to our decision to merge with Cinergy. DENA’s gas-fired plants in the Midwest complement Cinergy’s merchant assets, providing a more flexible fleet in the short term and reduced environmental compliance costs in the longer term. However, much of the rest of DENA’s portfolio was encumbered by long-dated contracts that limited our ability to develop a sustainable business model. We ultimately decided that we would realize the greatest shareholder value by exiting DENA’s operations outside the Midwest. We have disposed of most of DENA’s electricity and natural gas contracts, and expect to close on the pending sale of our remaining eight merchant power plants, as well as unwind any remaining contracts, by mid-year. The net result of our exit from DENA is a substantial reduction in market risk and a much more focused merchant operation. ASSESSING OUR PERFORMANCE Our Charter provides four measures of success which are useful in assessing our performance in 2005. We feel we did well against all of them. Our investors realize a superior return on their investment. It was a good year relative to the S&P 500. We provided total shareholder return (TSR) of 13 percent, compared to the S&P’s TSR of just under 5 percent. However, we fell short of the Dow Jones Utilities’ 25 percent. We attribute that lag to uncertainties around the merger with Cinergy, as investors stood by to see if and when it would come to fruition. Now that the merger is complete, we’re expecting to see a rebound in the stock price. Shareholders did see their annual dividend increase to $1.24 per share in 2005, and ongoing basic earnings per share were $1.79, topping our employee incentive target of $1.65. Our customers and suppliers benefit from our business relationships. The year 2005 will long be remembered for its devastating hurricanes. Duke Power crews were there — more than 1,500 employees and contractors — to help rebuild the electric grid after Katrina and Rita hit the Gulf Coast. Not a single contracted DEGT customer missed a delivery during the hurricanes, thanks to our storage capacity and some creative solutions — like building a new interconnect to bypass a heavily damaged processing plant. DEGT is also working with industry peers on new standards to ensure pipeline and storage facility safety in case of future disasters. Customers ranked Duke Power “Highest in Customer Satisfaction With Residential Electric Service in the Southern U.S.,” based on a 2005 J.D. Power and Associates study and, in a separate benchmark survey conducted by TQS Research, manufacturing and institutional customers ranked the utility first in the Southeast and third nationally. 5 DUKE ENERGY 2005 SUMMARY ANNUAL REPORT
  • 8. As for suppliers, we are encouraging them to improve safety for their employees, and many are following our lead. We are also working to improve supplier diversity — we made progress in 2005, but we can still do better. The communities in which we operate value our citizenship. Our employees, retirees and The Duke Energy Foundation Community Recognition in 2005 gave more than $800,000 in hurricane and tsunami relief. • An Environmental Excellence Award from the We gave more than $5 million to the U.S. United Way and Southern Gas Association for DEGT’s leadership in more than $1 million to the Canadian United Way in 2005. developing the Texas Corporate Wetlands Restoration Partnership. Total Foundation and companywide giving for the year — • The Newcomen Award honoring Duke Power for its including in-kind donations, contributions from employees outstanding business accomplishments, stewardship and retirees, and the value of volunteer service —- and integrity. Duke Power is the only three-time exceeded $32 million. recipient of the award. • A Corporate Stewardship Award from the South Employees collected tons of food and other essentials for Carolina Department of Archives and History for displaced hurricane victims, and thousands of Duke Energy archaeology and historic preservation at Crescent employees and retirees completed some 450 community Resources’ Palmetto Bluff community. service projects during our 2005 Global Service Event. • An Environmental Achievement and Education Award to DEGT from the City of Calgary for development Employees also received financial support for their volunteer of an Urban Ecology Program for schools. projects with more than $200,000 in grants from the • An Award of Recognition from the British Columbia Foundation. On this page you will find examples of the many School Superintendents Association for DEGT’s ways our communities recognized Duke Energy for business contributions to public education through the Northern Opportunities program. integrity and environmental stewardship in 2005. • A Corporate Plus Award from the Charlotte Every employee starts each day with a sense of purpose, chapter of INROADS for Duke Energy’s support of and ends each day with a sense of accomplishment. the organization’s mission to provide internship opportunities for minority students. Overall employee satisfaction is at its highest level in more • The 2005 Diversity Best Practices Award from the than five years. In our 2005 employee survey, most Charlotte Chamber of Commerce, honoring Duke Energy for its multicultural involvement in the employees expressed confidence in the company’s future community. and pride in Duke Energy and their work. Nine out of 10 • A Community Service Award from the Hale employees ranked the company favorably for environmental, Reservation for Duke Energy’s role in restoring the health and safety practices. organization’s environmental education facilities and preserving natural resources in the Boston area. In 2005 we made a recommitment to professional development, which had been somewhat on the back burner for several years. Employees seized those opportunities — training hours were up 83 percent in 2005 over 2004. Along with other members of the executive team, I personally participated in advanced leadership training for some 2,700 managers. For 2006, we’re adding to this measure of success — that employees end each day safely. The year 2005 was a sad one for five families who lost fathers and husbands who were contractors 6
  • 9. at work for Duke Energy. We can’t say any year has been truly successful if we don’t keep our workers safe. MOVING FORWARD Our new Charter objectives spell out what you can expect from us in 2006. The first imperative is to establish an industry-leading electric power platform through successful execution of the merger with Cinergy. We know that we have to earn the right to pursue other consolidations in the future, by demonstrating that this merger benefits all of our stakeholders — employees, shareholders, customers, regulators and our communities. We intend to do just that. We will continue to build a high-performance culture focused on safety, diversity and inclusion, employee development, leadership and results. Both Duke Energy and Cinergy have a deep bench of talent, and we put both companies’ best minds to work on an integration plan to create a winning combination of leadership and resources. We share the same business values, and a commitment to serve our stakeholders with integrity from a position of industry leadership. Our compatible company cultures create a strong foundation for organic growth and for future mergers and acquisitions. We intend to deliver on our 2006 financial objectives and position the company for growth in 2007 and beyond. All employees have an incentive target of $1.90 per ongoing diluted share in 2006. (This year, we are framing our objectives in terms of diluted as opposed to basic shares, consistent with Wall Street’s comparison of earnings on a fully diluted basis.) We see this as a challenging but realistic goal, based on the groundwork we have laid and opportunities ahead. It assumes synergy savings from the merger and a sharing of those savings with customers, but excludes costs to achieve as those are considered one-time items. Long-term management incentives are tied to total shareholder return. Working safely also remains an important measure of our success. Top leaders will see a 5 percent reduction in their short-term bonus payouts in the event of an employee, contractor or subcontractor fatality in 2006. We plan to complete the Duke Energy North America exit and pursue strategic portfolio opportunities. With the merger complete, our focus moves to the question of whether to separate our gas and power businesses and to new opportunities for electric utility consolidation. As with the Cinergy merger, our litmus test for all decisions will continue to be the degree to which they create value for investors and other stakeholders. 7 DUKE ENERGY 2005 SUMMARY ANNUAL REPORT
  • 10. Finally, we will continue to build credibility through leadership on key policy issues, transparent communications and excellent customer service. Our aggressive position on global climate change ruffled more than a few feathers in 2005. Last year, Cinergy devoted nearly its entire annual report to this issue, so be assured that Jim Rogers shares my commitment to facing facts about its potential effect on our industry. We share a philosophy that it is better to help shape the future with solutions, than to ignore reality and hope the tough problems just go away. Jim and I also share a strong belief in straightforward communication with our shareholders and all of our constituents, and in providing superior service to customers, the lifeblood of our company. You will read more about Jim’s plans as your new CEO in his letter, which follows. I heartily welcome Jim and our new leaders from Cinergy to Duke Energy’s management team. I will continue in my leadership role as chairman of the board. Let me take this opportunity to also welcome our new board members — Bill Barnet and Jim Hance, who joined the board in 2005, and five new board members from Cinergy — Michael Browning, Phil Cox, Mary Schapiro, Dudley Taft and of course Jim Rogers. Our outgoing board members, Max Lennon and Jim Martin, deserve special thanks for their years of dedicated service during a turbulent period in our company’s history. As I settle into my role as chairman, I thank you for your support during my time as CEO. When I accepted that position in November 2003, my objective was to restore our credibility and financial health, and meet the needs of our stakeholders. Thanks to your support and the contributions of thousands of employees, we have largely achieved those goals. I now feel comfortable handing over the CEO role to Jim Rogers, who shares my strong belief in the future of Duke Energy and its people. It is a good feeling to know that I am leaving in his capable hands a company that is financially strong, has a bright future and is positioned to be an industry leader. Sincerely, Paul M. Anderson Chairman of the Board April 3, 2006 8
  • 11.
  • 12. How will we know our merger is successful? We have developed a scorecard to track key measures, including savings, customer and employee satisfaction, reliability, safety and sustainability. And we will share our progress with our stakeholders on a regular basis. Read more about what success will look like at the new Duke Energy … 10
  • 13. James E. Rogers President and Chief Executive Officer Dear fellow investors, customers, employees and others who have a vested interest in our success — our policymakers, regulators, suppliers, partners and communities: The best way to celebrate the traditions and the people of two strong companies is by building an even stronger company on the combined foundations of each. Cinergy and Duke Energy each have a long and proud history with many successes. Of course, we have each had some missteps, as is true with all companies. However, as a combined company, we will honor our past achievements and the people who came before us by building on their accomplishments. As we plan for the future, we will remember the lessons learned from both our past successes and mistakes. Combined, we are a very large company. But I am mindful that bigger doesn’t necessarily mean better. To me, being better means having a relentless focus on what we do well. It means listening to our stakeholders and then working to balance their sometimes competing needs. It’s knowing that we must earn the right to serve all of our stakeholders each and every day. As the CEO of the new Duke Energy, my number one objective is to create an effective team of dedicated employees who come to work every day with the purpose of earning the right to serve you. Our team must be unrelenting and uncompromising in its drive to deliver on our promises. A team, simply put, that is accountable to be good stewards. MEETING OUR FUTURE CHALLENGES In his preceding letter, Paul Anderson gave you a good overview of Duke Energy as a whole. My focus here is primarily on the outlook for our combined franchised electric and gas utilities, competitive Midwest generation, and wholesale marketing and trading businesses. Our merger greatly increases the value of these businesses. We believe they can be significant contributors to our future earnings growth. 11 DUKE ENERGY 2005 SUMMARY ANNUAL REPORT
  • 14. As Paul notes in his letter, our industry is stalled between regulation and deregulation. Efforts by states to provide retail customers with energy choices have essentially come to a halt. As federal regulators continue to regionalize our nation’s power grid, wholesale competition is taking incremental but uneven steps forward. Successful companies will be those who can operate comfortably in both regulated and competitive markets and create customer value in each. The new Duke Energy will be one of those companies. Here’s why: We have combined two premier, franchised electric utility businesses with long histories of reliably supplying energy at costs below the national average. Each company is known for its ability to consistently provide superior customer satisfaction. We view low rates and attentive customer service as essential investments in our future growth. One result of low rates and top-tier customer service is increased credibility in the regulatory arena. Our diverse customer base will benefit from our aspiration to rank among the top performers in our industry for safety, efficiency, low costs, and reliable generation and distribution performance. Also, our fuel diversity — nuclear, coal, gas and hydro — will reduce our sensitivity to volatility caused by changes in commodity costs, weather and economic conditions. Our combined commercial generation assets straddle the seam between the Midwest ISO and PJM Interconnection regional transmission organizations, two of the most developed and dynamic power markets in the United States. These assets represent a diverse mix of baseload, midmerit and peaking generation that give us the flexibility to meet diverse customer needs in still-evolving competitive supply markets. Our energy marketing and trading organization is positioned to continue to take advantage of opportunities in competitive gas and electric markets in a low-risk manner. We believe we’ve created the right size platform with the right level of risk tolerance to be able to contribute steady, incremental earnings to the overall portfolio. A NEW VALUE PROPOSITION Over the past decade, we’ve seen dramatic shifts in how investors view the power industry. Not long ago, the market favored merchant players with greater earnings growth potential but also higher levels of volatility. As the commodity cycle bottomed out, investors exited the merchant sector and returned to traditional regulated utilities. This “back to basics” approach has taken utility stock valuations to record levels for many companies. As a result, our industry has significantly out-performed the S&P 500 in both 2004 and 2005. Of course, history shows that it is rare for any one industry sector to beat the broader market for three consecutive years. Since interest rates have risen, the utility sector’s opportunity to do so for a third consecutive year will be significantly challenged. I hope that 2006 proves history wrong. But however the industry fares, in my view, our business model allows us to out-perform comparable companies in our industry. We have the ability to deliver stable, predictable earnings from low-cost, regulated operations, and we can also manage low-risk growth in competitive wholesale markets. As such, we believe our combined company will have the earnings diversity and financial flexibility to weather changes in the regulatory landscape and investor sentiment. 12
  • 15. With these perspectives as background, and based on the 2006 Charter objectives Paul introduced in his letter, here are our priorities for the rest of this year and beyond: • Build an effective management team committed to one company, one stock and one team. Our team will create a high-performance culture focused on safety, diversity and inclusion, employee development, leadership and results. • Harvest the savings from our merger. We expect to realize approximately $650 million in aggregate net savings during the initial five years after the merger closes. These savings will help drive our earnings growth for shareholders and — through equitable sharing mechanisms with customers and shareholders — our aspiration to be a low-cost supplier for our customers. • Comply with more stringent environmental rules. We intend to reduce sulfur dioxide (SO2), nitrogen oxides (NOx) and mercury emissions from our coal-fired generation plants with the installation of new pollution control equipment on our largest units. We are also preparing for a future in which we believe new environmental laws and regulations will regulate the emissions of greenhouse gases. • Continue planning for new power plant construction to meet longer-term customer demand. Given the long lead times to build new baseload plants and the increased complexities of environmental compliance, we must place a strong emphasis on developing long-range plans to ensure that we maintain adequate generation reserves in all of our jurisdictions. As we carefully assess estimates of future supply and demand, we will evaluate all types of generation — coal, nuclear, coal gasification, hydroelectric, natural gas and renewable energy. We will continue to find cost-effective ways to lessen our exposure to the economic and environmental risks associated with any one fuel. For example, we intend to relicense our hydroelectric fleet and modernize our most economic coal units. • Minimize the impact of volatile fuel prices on customers. Generation fuel expense is one of the primary drivers of electricity prices. We intend to take advantage of our fuel diversity, purchasing power and efficient fuel delivery systems to minimize the impact of fuel price swings on our customers. • Renew our focus on energy conservation and efficiency. We will pursue policies promoting conservation, efficiency and wise energy use. In the past, our customers benefited from these programs, which help them use less energy without compromising their quality of life. In collaboration with our state utility regulatory commissions and consumer advocates, there is so much more we can and will do. • Modernize and expand our aging transmission and distribution systems. We expect to invest approximately $2.3 billion in our regulated operations over the next three years to improve the reliability of our regulated gas and electric delivery systems. • Maintain low risk in our energy marketing and trading businesses. We will continue to have a conservative, low-risk focus in our marketing and trading businesses with narrow risk parameters for products offered and committed capital. We will focus strictly on near-term, credit-advantaged opportunities. • Support the economic well-being of our communities. The average organic growth rate of our regulated franchises (demand in kilowatt-hours) is expected to be approximately 1.5 percent over the 13 DUKE ENERGY 2005 SUMMARY ANNUAL REPORT
  • 16. next three years. We will work with community and political leaders to focus on local economic development, which should increase this rate over time. In all, you can expect us to work on these priorities to achieve predictable earnings and dividend growth. CINERGY — A HISTORY OF SUCCESS I would like to review my experience at Cinergy both for former Cinergy shareholders who are new to Duke Energy, as well as for those shareholders who owned Duke Energy prior to the merger. I am proud of the people of Cinergy because they bring a rich heritage of accomplishments to this merger. As the new CEO of Duke Energy, I am grounded in this history and inspired to build on these successes. Because we chose not to issue a final Cinergy annual report, I will briefly highlight our accomplishments during Cinergy’s nearly 12 years of existence. Total Return Focus: Since the merger of PSI Energy and Cincinnati Gas & Electric to create Cinergy in 1994, we provided our investors with an average annual total shareholder return of 11.9 percent through 2005. During that time, we beat the S&P 500, the S&P 500 Electric Utility and the Philadelphia Stock Exchange Utility indexes, and we returned approximately $3.5 billion in cash dividends to shareholders. Governance Leadership: Institutional Shareholder Services has consistently ranked Cinergy as one of the top 10 companies in the S&P 500 for its governance. I believe this recognition reflects the Cinergy board’s consistent focus on what constitutes good corporate governance. The board created one of the first corporate governance committees in the United States in 1994, shortly after the company was formed. Customer Focused: Our customers enjoy some of the lowest electric and natural gas rates in Ohio and Kentucky. In 2005, our Indiana electric rates were the same as they were in 1988 when I became CEO of PSI Energy, while our investors have earned a fair return. Across the board, our rates are significantly below the national average, and keeping our rates competitive has been a commitment to our customers. For many years, we’ve ranked in the top quartile of Midwest utilities for customer satisfaction. For two consecutive years — 2005 and 2006 — our call centers have been certified for providing “An Outstanding Customer Service Experience” by J.D. Power and Associates. We were the first energy company in the United States to earn this prestigious certification. Emergency Response: I’m proud of the way our employees have responded to emergencies in our communities and elsewhere. Last year, we sent crews to the Gulf States following Hurricanes Katrina and Rita. After a severe ice storm in December, Cinergy crews worked alongside their Duke Power counterparts to restore service to 700,000 customers in the Carolinas. For the last two years, the Edison Electric Institute, our industry’s leading trade organization, has recognized our emergency assistance to other utilities. Employer of Choice: We earned the U.S. secretary of labor’s top diversity award for our efforts to recognize the talents and respect the differences of our employees. Also, for nine consecutive years — 1997–2006 — Cinergy was named one of the 100 best companies for working mothers by Working 14
  • 17. Mother magazine, and for many of those years we were the only utility listed. Last year, AARP recognized Cinergy as a top employer for employees over age 50. No Surprises for Regulators and Policymakers: Our relationships with federal, state and local regulators and policymakers have been consistently based on a powerful but simple premise: “No surprises.” Our efforts to balance the needs of our investors and customers resulted in many regulatory wins for both, including most recently, our rate stabilization plan in Ohio and our environmental compliance settlement in Indiana. Industry Leadership on Public Policy: We worked to mold and shape national energy policy. Along with Duke Energy and other energy companies, we helped to secure passage last year of the Energy Policy Act, probably the most significant energy legislation to be enacted since the 1970s. And we will continue to push for passage of comprehensive multipollutant legislation at the federal level. Environmental Leadership: As one of the largest users of coal to generate power, we have been a leader on the issue of reducing coal-fired emissions. At the first Cinergy board meeting in 1994, we adopted an environmental leadership pledge — one of the first in our industry. Our pledge illustrated a key operating principle: Accountability starts at the board level. Cinergy has been one of a handful of utilities with experience in coal gasification. We are using this knowledge to obtain public and private support to build one of the first commercial cleaner-burning coal gasification plants to replace one of our older coal plants. We earned national recognition for our partnerships on numerous environmental projects. Most recently, the U.S. Department of Energy and the U.S. Environmental Protection Agency recognized Cinergy and BP with its Energy Star award for the operational and environmental efficiency of Cinergy Solutions’ cogeneration plant at the BP refinery near Houston. Over the past 15 years, Cinergy reduced its SO2 and NOx emission rates by 50 percent and 45 percent, respectively. Also, we were one of the few utilities that voluntarily committed to reduce our greenhouse gas emissions. In late 2004, we issued our “Air Issues Report to Stakeholders,” and last year we devoted our annual report to climate change. We did this to jump-start a debate on what must be done to prepare our stakeholders for the inevitability of a carbon-constrained world. We owe it to our children and grandchildren to start dealing now with the climate change issue. Committed to Communities: Our people are involved in virtually every major nonprofit organization in each community we serve. They volunteer their time and talents whenever the need arises. And Cinergy Foundation has given back $45 million to improve education, community development, health care, social services and culture. Cinergy has been an industry leader in economic development. We continued to support our communities, even as states such as Ohio were deregulated. We’ve always considered economic development to be the heart of our organic growth. Sustainability Leader: Lots of companies talk about sustainability. Many don’t think about what it really means. To us, it has meant reducing our environmental footprint in a world where our grandchildren may not be able to take the basics, such as clean air, plentiful water and affordable energy, for granted. 15 DUKE ENERGY 2005 SUMMARY ANNUAL REPORT
  • 18. Viewing our business as a whole, we’ve always known that responsible actions based on balancing the needs of our stakeholders lead to long-term success. That is how we have defined sustainability. In 2005, we were again recognized for sustainability leadership. For the third consecutive year, Cinergy was named to the Dow Jones Sustainability Indexes. We were one of only two utilities in the United States and eight in the world to be so named. As a further commitment to sustainability, we encourage you to enroll in electronic delivery of our financial information and proxy statements. Besides preserving our natural resources by reducing paper, electronic delivery also significantly reduces the costs of printing and mailing. In 2007, for every shareholder who selects electronic delivery rather than a printed copy of their 2006 Duke Energy annual report, we will donate $1 to The Nature Conservancy, with whom we’ve worked on numerous environmental initiatives. (See page 41 for more information.) EARN THE RIGHT EVERY DAY As a combined company, I have no doubt that we will achieve even greater successes in the future. I believe success is about people who want to create a better future. I have confidence that together, this new team of Duke Energy and former Cinergy employees will carry on our best traditions and start new ones. I thank the employees of Cinergy who have traveled with me on this journey. You never wavered from our vision of “people making history by making a difference.” You made a real difference. We would not be where we are today were it not for your hard work and dedication. I want to thank the past and present officers who helped grow Cinergy into a great company and a great merger partner. And my thanks to the Cinergy board of directors, especially George Juilfs, Tom Petry, Jack Schiff and Phil Sharp, who are departing. Your insights and thoughtful debate helped us to maintain our focus on growth and on serving our stakeholders. I’m both humbled and excited about being the CEO of Duke Energy. I know it is a company where each of us will strive every day to earn the right to serve you, our stakeholders. James E. Rogers President and Chief Executive Officer April 3, 2006 16
  • 19. What does the new Duke Energy look like? The merger of Duke Energy and Cinergy creates a premier energy company serving 3.8 million electric customers in five states, and 1.7 million gas customers. Our six major lines of business form a strong platform for future growth, and give Duke Energy the ability to succeed in both regulated and nonregulated markets. On the pages that follow, you will learn more about how the new Duke Energy is structured for future growth, highlights of our combined companies’ 2005 accomplishments, and a strategic look ahead. You will also see the benefits of the merger from the perspective of our shareholders, our customers, our employees and our communities. Read on… 17 DUKE ENERGY 2005 SUMMARY ANNUAL REPORT
  • 20. As an investor, what can I expect from this merger? We expect the financial strength of the new Duke Energy to deliver steady earnings-per-share (EPS) growth. Our targeted earnings will be $2 per ongoing diluted share in 2007, our first full year as a combined company, and 4 to 6 percent ongoing annual EPS growth thereafter. Our diverse portfolio of assets and operations, both regulated and nonregulated, will enable us to sustain that growth. With the merger complete, we are resuming our stock buyback program and will consider increasing the dividend, based on our target payout ratio of 70 percent. Farmer, conservationist and Duke Energy shareholder Ernie Averett. The Averett family has owned and operated Flatwood Farms in Oxford, N.C., for seven generations. Averett began investing in Duke Energy more than 10 years ago to smooth out his seasonal income with reliable dividends. 18
  • 21. DUKE ENERGY + CINERGY = THE NEW DUKE ENERGY With this merger, our newly combined power business Combined North American Assets joins our natural gas businesses to rank among the largest in North America. While the merger benefits our entire company and all of its stakeholders, the key advantages are largely related to our electric business: • The combined strength and diversity of our franchised Calgary electric utilities put us in a better position for Vancouver sustained growth, and our greater size and scope give us a stronger platform for participation in the consolidation of the electric power industry. Chatham • We will continue to grow our earnings by investing Plainfield Denver in the expansion and reliability of our operations — Cincinnati focusing on new generating capacity, environmental Charlotte controls and the modernization of our power delivery system. Houston • In our competitive supply markets, we will reap the benefits of fuel, asset and geographic diversity. • Approximately $650 million in net cost savings aggregated over the Corporate Headquarters Major Office Location first five years will be shared equitably with customers and shareholders. Natural Gas Storage DEGT–Natural Gas Processing Plant Natural Gas Transmission Pipeline • Our public voice on energy and environmental policy issues will be stronger Natural Gas Liquids (NGL) Pipeline and heard more broadly. Union Gas Distribution Service Area Franchised Electric Service Area DEFS–Processing Plant • We can better maintain our commitments to support our communities and Natural Gas Gathering Pipeline Propane Terminal to be the “employer of choice.” Wholesale Generation Plant • Most importantly, this merger reinforces our focus on understanding and balancing the needs of all of our stakeholders, which is fundamental to continued leadership as a sustainable business. With the merger, some of our business names have changed. What has not changed is their commitment to our shared purpose: to create value for our investors, customers, communities and employees. Our U.S. franchised electric and gas utilities — formerly Duke Power in the Carolinas, Cincinnati Gas & Electric in Ohio, Union Light, Heat and Power in Kentucky and PSI Energy in Indiana — are now known simply as Duke Energy. Cinergy Solutions is now Duke Energy Generation Services. Duke Energy Americas, Duke Energy International, Duke Energy Gas Transmission, Duke Energy Field Services, Crescent Resources and Union Gas, our local distribu- tion company in Canada, retain their names. President and CEO Jim Rogers (left) The following summaries recap the primary is responsible for the company's accomplishments of our major businesses day-to-day operations and business in 2005 and their main areas of focus decisions, while Chairman Paul going forward. Anderson's role focuses on high- level strategy development and management succession. 19
  • 22. As customers, what can we expect from this merger? We know that the energy and related services we supply to millions of customers are essential to their way of life. We are committed to keeping our electric and gas utility rates, which in 2005 were below the U.S. national average, as competitive and stable as possible, while earning a fair return for our investors. We will continue to strive for the highest standards in customer service and satisfaction. We will work diligently to maintain outstanding system reliability and safety, and to help our customers find the energy solutions they need. Heather Hallenberg, Frank Satogata and their son Sean, at their home in Cincinnati’s Mount Washington neighborhood. The Satogatas have been Cincinnati Gas & Electric customers for nearly 20 years. Active in the Greater Cincinnati arts community, Frank is a graphic designer and painter, Heather is arts services director of Cincinnati’s Fine Arts Fund, and Sean is a freshman in high school. 20
  • 23. U.S. FRANCHISED ELECTRIC AND GAS Duke Energy’s franchised electric and gas operations deliver safe, reliable and U.S. Franchised Electric and Gas Service Area and Major Offices competitively priced electricity to more than 3.8 million electric customers in North Carolina, South Carolina, Ohio, Indiana and Kentucky. A diverse fuel mix of IN nuclear, coal-fired, hydroelectric and combustion-turbine generation provides OH approximately 28,000 megawatts of total generating capability. These operations also serve more than 500,000 natural gas customers in Ohio and Kentucky. Plainfield Cincinnati WV VA Our regulated utilities are focused on revenue growth, operational KY performance and continued partnerships with customers and communities. For the first time in 20 years, future demand is projected TN NC Charlotte to outpace generation capacity — in the Carolinas alone, we foresee a Midwest Regulated need for 20 percent more capacity, about 4,000 megawatts, by 2015, SC Generation and we are pursuing options to build both coal and nuclear generation Coal 6,103 MW GA Gas 1,752 MW plants. In Indiana, we are evaluating the construction of a state-of-the-art Oil 259 MW coal gasification project to replace a more than 50-year-old coal-fired Hydro 45 MW plant. New generation will support our already diverse portfolio of Midwest Retail Gas low-cost coal and nuclear baseload generation, supplemented by hydro- Operations Southeast Regulated 6,350 miles of Generation electric, combustion-turbine and purchased power for peak periods. distribution pipelines Nuclear 6,996 MW Coal 7,699 MW The successful integration of our franchised electric businesses will achieve Gas 2,424 MW Hydro 2,800 MW cost savings and enhance customer service and reliability across all service territories. Ongoing segment earnings before interest and taxes (EBIT) for U.S. Franchised Electric and Gas in 2006 is expected to be approximately $1.95 billion. 2005 Highlights Duke Power Duke Power contributed approximately $1.5 billion in segment EBIT in 2005, slightly higher than 2004 segment EBIT of $1.47 billion due to favorable weather, strong bulk power sales and the impact of continued economic development efforts — partially offset by a charge for December ice storm expenses and by higher operating and maintenance expenses. Population growth — and demand for Duke Power’s attractive electric rates — continue in the Piedmont Carolinas. New high-tech indus- tries such as biotechnology and automotive research moved to the region, replacing lost business and jobs in the textile sector. These leaders are responsible for providing franchised electric and gas customers with efficient and reliable operations (from left): Patty Walker, group vice president, Ohio and Kentucky gas operations; Brew Barron, group vice president, nuclear generation and chief nuclear officer; Bill McCollum, group vice president, regulated fossil/hydro generation; Theopolis Holeman, group vice president, power delivery; and Todd Arnold, group vice president, customer service.
  • 24. What can my community expect from this merger? We are committed to maintaining a local presence with “go to” people who live in and are actively involved in the communities we serve. We will continue to support local economic development efforts — in many communities, we’re already a catalyst for those efforts. We will help provide energy assistance to our low-income customers through flexible billing and assistance programs. We pledge that our corporate foundation giving in support of community health, education and cultural enrichment will continue. And we will provide leadership in environmental responsibility and sustainability — a corporate priority. Charlotte Otto, Global External Relations Officer for The Procter & Gamble Co. Active in her community’s business and cultural life, Otto currently chairs the Cincinnati USA Regional Chamber and Downtown Cincinnati Inc., and serves on the board of Cincinnati Playhouse in the Park. 22
  • 25. Regional growth continued to add to Duke Power’s total customer base, which grew by 43,000 customers — about a 2 percent net increase — in 2005. In July, the company set a new peak demand record of 18,687 megawatts. To meet growing demand, Duke Power focused on new generation plans — and on operating its current generation and delivery systems as efficiently as possible. In 2005, the company’s fossil/hydro fleet set a new all-time generation record, beating the previous record by more than 2 million megawatt-hours. Duke Power’s two largest steam stations, Marshall and Belews Creek, were ranked second and third in efficiency among U.S. coal-fired stations by Electric Light & Power magazine. And our nuclear fleet achieved its second highest capacity factor ever — 93.68 percent, up from 2004’s 90.23 percent. (Capacity factor measures how much electricity the system produces as a percent of its total capability.) In October, Duke Power confirmed it is proceeding with the federal application process for a combined construction and operating license for two Westinghouse AP1000 nuclear reactors. A potential site in South Carolina has been selected for a joint project with Southern Company. Cinergy Cinergy’s regulated businesses contributed approximately $645 million in adjusted EBIT in 2005, compared to approximately $586 million in 2004, while advancements in reliability and customer service were recognized by regulatory authorities and earned national recognition. Ohio regulators approved a $51.5 million electric distribution rate increase, the first in a decade, for Cincinnati Gas & Electric Co. (CG&E). Effective in 2006, the increase recognized CG&E’s reliability improvements over the past 12 years. Kentucky regulators approved an These leaders are the face of Duke Energy in their business $8.1 million natural gas distribution rate increase for Union Light, Heat communities (from left): Bill Easter, president and CEO, and Power (ULH&P) for continued improvement of its gas distribution Duke Energy Field Services; Martha Wyrsch, president, system. PSI Energy (PSI) reached a settlement to recover approximately Duke Energy Gas Transmission; Art Fields, president $1 billion to comply with new federal clean air and mercury rules. The and CEO, Crescent Resources; Ellen Ruff, president, five-year plan will result in further significant reductions in the emissions Duke Energy Carolinas; Sandra Meyer, president, of sulfur dioxide and nitrogen oxides as well as mercury emissions. Duke Energy Ohio and Kentucky; Kay Pashos, president, Duke Energy Indiana; and Richard McGee, president, Duke Energy International. 23
  • 26. As an employee, what can I expect from this merger? We recognize that employees are the foundation of our company. They create value for our stakeholders, day in and day out. We believe our larger scale and scope will help us maintain competitive pay and benefits, and provide more opportunities for employees to grow and develop in their careers. We will continue to recognize employees for their work and to foster a diverse, inclusive, performance-based culture where they feel valued and can reach their full potential. Above all, we are committed to our employees’ health and safety, both on and off the job. James W. Bowden, General Manager of Power Delivery Operations for Duke Power’s Northern Region. Bowden oversees the operation, modification and maintenance of Duke Power’s transmission system in a region serving 830,000 customers. His family history with Duke Power goes back more than 100 years -— his grandfather joined the company in 1905 and his father also worked for Duke Power. 24
  • 27. And state and federal regulators also agreed to the transfer of approximately 1,100 megawatts of generation assets from CG&E to ULH&P to meet future customer demand. In January 2006, the CG&E and PSI customer call centers in Ohio and Indiana were recertified by J.D. Power and Associates. Last year, Cinergy was the first energy company in the United States to be certified for providing “An Outstanding Customer Service Experience.” (Duke Power was the second.) And, for the second year in a row, Cinergy received the Edison Electric Institute’s emergency assistance award, this time for the help it gave Gulf Coast utilities in the wake of Hurricanes Katrina and Rita last fall. In December after a severe ice storm, Cinergy crews worked alongside their Duke Power counterparts in the Carolinas to restore service to 700,000 customers. DUKE ENERGY GAS TRANSMISSION Duke Energy Gas Transmission has more than 17,500 miles of transmission pipelines; 250 billion cubic feet of natural gas storage; gathering and processing assets; a natural gas liquids processing operation; and a local distribution company serving more than 1.2 million customers in Canada. DEGT is well positioned to connect new and existing natural gas supplies to growing markets, with timely pipeline expansions and the development of highly flexible natural gas storage capacity. Duke Energy Gas Transmission (DEGT) continues to make a consistent contribution to cash flow and earnings by providing natural gas transmission and storage, gathering and processing, and local distribution services to premium markets in North America. Going forward, DEGT is expected to deliver ongoing segment EBIT of approximately $1.39 billion, which is essentially flat with 2005. Ongoing earnings for this business are anticipated to grow by 3 to 5 percent annually — driven by opportunities for continued pipeline development, optimization of existing transmission, distribution, gathering and processing systems, storage development and control of costs. Demand for natural gas is expected to grow 2 to 3 percent in DEGT’s key markets. 2005 Highlights DEGT contributed approximately $1.39 billion in segment EBIT, compared to approximately $1.33 billion in 2004 — an increase driven by improved operations, U.S. system expansions, newly acquired Canadian assets and a favorable currency exchange rate. The geographic strength of DEGT’s system was evident following last year’s devastating hurricanes. Although the company’s Gulf Coast-area assets were temporarily affected, not a single contracted customer in our Northeast market area missed a natural gas delivery during that trying time. Other key 2005 successes included: • An agreement with CenterPoint Energy on a proposed pipeline to connect supply from East Texas basins to growing eastern U.S. markets • Acquisition from AGL Resources of the remaining 50 percent interest in Saltville Gas Storage, strengthening DEGT’s storage position in the Mid-Atlantic • A high rate of long-term contract renewals • Successful regulatory settlements which reduced volatility and created a stable rate environment for customers • In Canada, acquisition of the Empress liquids processing system, the transfer of Duke Energy Field Services’ gas processing operations to DEGT and the establishment of the Duke Energy Income Fund investment vehicle 25 DUKE ENERGY 2005 SUMMARY ANNUAL REPORT
  • 28. • Agreements to expand Union Gas’ Natural Gas Operations Dawn–Trafalgar transportation system to reach markets in Ontario, Quebec and the U.S. Northeast • Precedent agreements to expand the Maritimes & Northeast pipeline to transport Calgary Vancouver natural gas to U.S. and Canadian markets from proposed liquefied natural gas import terminals Halifax in Atlantic Canada. Boston Chatham DUKE ENERGY FIELD SERVICES Denver Duke Energy Field Services gathers, treats, compresses, Nashville Tulsa Charlotte processes, transports, markets and stores natural gas; Midland and produces, fractionates, transports, trades and markets Houston natural gas liquids (NGL). DEFS is one of the largest natural gas gatherers in the United States, the largest NGL producer and one of the largest NGL marketers. DEFS owns or operates 54 plants and 56,000 miles of pipeline. It is a 50-50 joint venture between Corporate Headquarters Duke Energy and ConocoPhillips. Major Office Location DEGT–Natural Gas Storage DEGT–Natural Gas Processing Plant DEGT–Wholesale Generation Plant Duke Energy Field Services (DEFS) is moving from a period of rapid growth to focus DEGT–Natural Gas Transmission Pipeline DEGT–Natural Gas Liquids (NGL) Pipeline on selective growth and performance excellence — rigorously driving improvement DEGT–Union Gas Distribution Service Area DEFS–Processing Plant in operations and in commercial and support activities. DEFS’ new master limited DEFS–Natural Gas Gathering Pipeline partnership, DCP Midstream Partners, will be an important growth vehicle, allowing DEFS–Propane Terminal for capital-efficient growth and solid cash flow. DEFS’ solid financial position provides options for deploying cash through reinvestment, debt repayment and dividends to its parent companies, Duke Energy and ConocoPhillips. For 2006, ongoing equity earnings to Duke Energy are anticipated to be approximately $500 million, assuming an average crude oil price of $61 per barrel. 2005 Highlights Strong commodity prices as well as operational and commercial improvements more than offset disruptions from the Gulf Coast hurricanes to net record earnings for DEFS, which contributed $291 million in ongoing segment EBIT for the first six months of 2005. For the second half of the year, DEFS contributed $214 million in ongoing equity earnings as a result of a change in ownership with ConocoPhillips. It was a year to position DEFS for future success. In a restructuring move, Duke Energy sold nearly 20 percent of its ownership interest to DEFS partner ConocoPhillips, forming a 50/50 joint venture. DEFS’ natural gas gathering and processing assets in western Canada moved to Duke Energy Gas Transmission. DEFS also sold the general partner of TEPPCO to Enterprise GP Holdings L.P. for more than $1.1 billion, and created a new master limited partnership (MLP), DCP Midstream Partners LP. DEFS owns the general partner of the new MLP and operates its assets in Texas and Louisiana. 26
  • 29. DUKE ENERGY AMERICAS Duke Energy Americas includes the company’s major wholesale energy operations and commercial businesses. With approximately 7,000 megawatts and 4,000 megawatts, respectively, in the United States and internationally, Duke Energy Americas has a diverse mix of power generation facilities, and is engaged in the sale and marketing of electric power, natural gas and generation services. Duke Energy International Duke Energy International (DEI) will continue to pursue organic growth opportunities for our existing generation assets in Latin America and improve operational efficiency to increase the returns on those assets. For 2006, DEI is expected to deliver ongoing segment EBIT of approximately $275 million. 2005 Highlights DEI exceeded expectations with segment EBIT of $314 million, compared to $222 million in 2004. Those results were largely driven by improved Latin American operations (due primarily to favorable pricing and weather conditions in Peru and Argentina), favorable currency exchange impacts in Brazil and record earnings from National Methanol Co. due to higher commodity prices. The improved results achieved by DEI in total, as well as on its portfolio of Latin American generation assets, continued a positive earnings trend that began in 2003. DEI’s operations continued to generate strong cash flow. During 2005, DEI took advantage of a one- time opportunity to repatriate more than $500 million in foreign earnings to Duke Energy Corp. at a lower tax rate. North American Nonregulated Generation and Marketing The merger with Cinergy gives our nonregulated generation and trading and marketing businesses a fresh start. CG&E’s coal-fired merchant generation portfolio gains fuel diversity and reliability with the addition of DENA’s Midwest fleet of new and efficient natural gas-fired plants. Now that the exit from DENA’s legacy trading business is nearly complete, we are moving to Cinergy’s commercial business model which focuses on transactions with contract terms of less than one year — a stronger platform for growth. Ongoing segment EBIT for North American Nonregulated Generation and Marketing in 2006 is expected to be approximately $325 million. 2005 Highlights Cinergy Cinergy’s commercial businesses contributed approximately $443 million in adjusted EBIT in 2005, compared to approximately $345 million in 2004. Power Operations, the group responsible for oper- ating and maintaining Cinergy’s nonregulated power generation assets, set records for generation, productivity and safety last year. The 26,608,001 megawatt-hours (MWH) of generation and an average 40,503 MWH generated per employee beat previous Cinergy records set in 2000. Power Operations employees and contractors also achieved their best-ever safety incident rate and logged the lowest number of recordable incidents in company history. 27 DUKE ENERGY 2005 SUMMARY ANNUAL REPORT
  • 30. The Power Trading and Portfolio Optimization groups each benefited from market conditions to deliver a solid year. Power Trading gross margins were up $46 million from the prior year. Portfolio Optimization sold emission allowances no longer needed to meet future non-retail commitments, which increased emission allowance gross margins by $121 million. Cinergy’s commercial businesses also realized a $37 million increase in retail margins, primarily resulting from implementation of our rate stabilization plan in Ohio. Cinergy Solutions implemented new efficiency measures for Procter & Gamble manufacturing plants, and was engaged to design, build, own and operate a new steam generating plant for Dow Chemical’s Union Carbide subsidiary. Duke Energy North America Duke Energy put most of Duke Energy North America’s (DENA) assets up for sale in September 2005, and announced in November the transfer of virtually all of DENA’s trading book of outstanding gas and power derivative contracts to Barclays Bank. That move essentially eliminated all credit, collateral, market and legal risk associated with DENA’s derivative trading positions. In January 2006, Duke Energy announced an agreement to sell DENA’s 6,200 megawatts of power generation in the western and northeastern United States to LS Power Equity Partners for approxi- mately $1.5 billion. DENA’s remaining 3,600 megawatts of generation in the Midwest are being combined with Cinergy’s commercial operations. (Note: For 2005, approximately $120 million of ongoing EBIT losses for DENA’s continuing operations were included in Other, and its discontinued results are reported in Discontinued Operations.) CRESCENT RESOURCES Crescent Resources manages land holdings and develops high-quality commercial, residential and multi-family real estate projects in nine states. Crescent Resources has received numerous awards for its environmentally sensitive property development strategies and partnerships with environmental and wildlife groups. Crescent Resources continues to focus on real estate development in growth markets, primarily in the southeastern and southwestern United States. The company will invest in commercial and residential opportunities based on earnings potential and geographic market demand. Crescent Resources is expected to deliver ongoing segment EBIT of approximately $250 million in 2006. 2005 Highlights Crescent Resources continued to benefit from robust commercial and residential real estate markets, to end 2005 with segment EBIT of $314 million, compared to $240 million in 2004 — generating more earnings than anticipated for the second consecutive year. Crescent actively managed its real estate holdings to achieve gains on the sale of a site in Nashville, Tenn., to Nissan for its North American corporate headquarters, a legacy land tract in South Carolina, its interest in a portfolio of office buildings in Georgia and Florida, and 2,483 residential lots in the Carolinas, Georgia, Florida, Texas and Arizona. The book value of Crescent’s portfolio was $1.3 billion at year-end 2005, compared with $1.1 billion at the end of 2004. 28
  • 31. C O N S O L I D AT E D S TAT E M E N T S O F O P E R AT I O N S Years Ended December 31 (In millions, except per-share amounts) 2005 2004 2003 Operating Revenues Nonregulated electric, natural gas, natural gas liquids, and other $ 7,661 $ 12,232 $ 10,088 Regulated electric 5,406 5,041 4,851 Regulated natural gas and natural gas liquids 3,679 3,276 3,082 Total operating revenues 16,746 20,549 18,021 Operating Expenses Natural gas and petroleum products purchased 6,279 10,156 8,479 Operation, maintenance and other 3,553 3,317 3,496 Fuel used in electric generation and purchased power 1,584 1,576 1,465 Depreciation and amortization 1,728 1,750 1,675 Property and other taxes 571 513 499 Impairments and other charges 140 64 1,219 Impairment of goodwill — — 254 Total operating expenses 13,855 17,376 17,087 Gains on Sales of Investments in Commercial and Multi-Family Real Estate 191 192 84 Gains (Losses) on Sales of Other Assets, net 534 (404) (199) Operating Income 3,616 2,961 819 Other Income and Expenses Equity in earnings of unconsolidated affiliates 479 161 123 Gains (Losses) on sales and impairments of equity method investments 1,225 (4) 279 Other income and expenses, net 96 148 148 Total other income and expenses 1,800 305 550 Interest Expense 1,062 1,281 1,330 Minority Interest Expense 538 200 62 Earnings (Loss) from Continuing Operations Before Income Taxes 3,816 1,785 (23) Income Tax Expense (Benefit) from Continuing Operations 1,283 533 (94) Income from Continuing Operations 2,533 1,252 71 (Loss) Income from Discontinued Operations, net of tax (705) 238 (1,232) Income (Loss) Before Cumulative Effect of Change in Accounting Principle 1,828 1,490 (1,161) Cumulative Effect of Change in Accounting Principle, net of tax and minority interest (4) — (162) Net Income (Loss) 1,824 1,490 (1,323) Dividends and Premiums on Redemption of Preferred and Preference Stock 12 9 15 Earnings (Loss) Available for Common Stockholders $ 1,812 $ 1,481 $ (1,338) Common Stock Data Weighted-average shares outstanding Basic 934 931 903 Diluted 970 966 904 Earnings per share (from continuing operations) Basic $ 2.69 $1.33 $ 0.06 Diluted $ 2.61 $1.29 $ 0.06 (Loss) Earnings per share (from discontinued operations) Basic $(0.75) $0.26 $(1.36) Diluted $(0.73) $0.25 $(1.36) Earnings (Loss) per share (before cumulative effect of change in accounting principle) Basic $ 1.94 $1.59 $(1.30) Diluted $ 1.88 $1.54 $(1.30) Earnings (Loss) per share Basic $ 1.94 $1.59 $(1.48) Diluted $ 1.88 $1.54 $(1.48) Dividends per share $ 1.17 $1.10 $ 1.10 See Notes to Consolidated Financial Statements in Duke Energy’s 2005 Form 10-K. 29 DUKE ENERGY 2005 SUMMARY ANNUAL REPORT
  • 32. C O N S O L I D AT E D B A L A N C E S H E E T S December 31 (In millions) 2005 2004 ASSETS Current Assets Cash and cash equivalents $ 511 $ 533 Short-term investments 632 1,319 Receivables (net of allowance for doubtful accounts of $127 at December 31, 2005 and $135 at December 31, 2004) 2,580 3,184 Inventory 863 942 Assets held for sale 1,528 40 Unrealized gains on mark-to-market and hedging transactions 87 962 Other 1,756 938 Total current assets 7,957 7,918 Investments and Other Assets Investments in unconsolidated affiliates 1,933 1,292 Nuclear decommissioning trust funds 1,504 1,374 Goodwill 3,775 4,148 Notes receivable 138 232 Unrealized gains on mark-to-market and hedging transactions 62 1,379 Assets held for sale 3,597 84 Investments in residential, commercial and multi-family real estate (net of accumulated depreciation of $17 at December 31, 2005, and $15 at December 31, 2004) 1,281 1,128 Other 2,743 1,949 Total investments and other assets 15,033 11,586 Property, Plant and Equipment Cost 40,574 46,806 Less accumulated depreciation and amortization 11,374 13,000 Net property, plant and equipment 29,200 33,806 Regulatory Assets and Deferred Debits Deferred debt expense 269 297 Regulatory assets related to income taxes 1,338 1,269 Other 926 894 Total regulatory assets and deferred debits 2,533 2,460 Total Assets $ 54,723 $ 55,770 See Notes to Consolidated Financial Statements in Duke Energy’s 2005 Form 10-K. 30
  • 33. December 31 (In millions) 2005 2004 LIABILITIES AND COMMON STOCKHOLDERS’ EQUITY Current Liabilities Accounts payable $ 2,431 $ 2,414 Notes payable and commercial paper 83 68 Taxes accrued 327 273 Interest accrued 230 287 Liabilities associated with assets held for sale 1,488 30 Current maturities of long-term debt 1,400 1,832 Unrealized losses on mark-to-market and hedging transactions 204 819 Other 2,255 1,779 Total current liabilities 8,418 7,502 Long-term Debt 14,547 16,932 Deferred Credits and Other Liabilities Deferred income taxes 5,253 5,228 Investment tax credit 144 154 Unrealized losses on mark-to-market and hedging transactions 10 971 Liabilities associated with assets held for sale 2,085 14 Asset retirement obligations 2,058 1,926 Other 5,020 4,982 Total deferred credits and other liabilities 14,570 13,275 Commitments and Contingencies Minority Interests 749 1,486 Preferred and Preference Stock without Sinking Fund Requirements — 134 Common Stockholders’ Equity Common stock, no par, 2 billion shares authorized; 928 million and 957 million shares outstanding at December 31, 2005, and December 31, 2004, respectively 10,388 11,252 Retained earnings 5,335 4,539 Accumulated other comprehensive income 716 650 Total common stockholders’ equity 16,439 16,441 Total Liabilities and Common Stockholders’ Equity $ 54,723 $ 55,770 See Notes to Consolidated Financial Statements in Duke Energy’s 2005 Form 10-K. 31 DUKE ENERGY 2005 SUMMARY ANNUAL REPORT