
Recommandé
Recommandé
Contenu connexe
Tendances
Tendances (17)
En vedette
En vedette (20)
Similaire à PPG Industries Q3 2007 Financial Results
Similaire à PPG Industries Q3 2007 Financial Results (20)
Plus de finance22
Plus de finance22 (20)
Dernier
Dernier (20)
PPG Industries Q3 2007 Financial Results
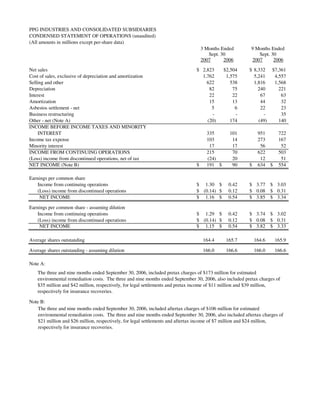
- 1. PPG INDUSTRIES AND CONSOLIDATED SUBSIDIARIES CONDENSED STATEMENT OF OPERATIONS (unaudited) (All amounts in millions except per-share data) 3 Months Ended 9 Months Ended Sept. 30 Sept. 30 2007 2006 2007 2006 Net sales $ 2,823 $2,504 $ 8,332 $7,361 Cost of sales, exclusive of depreciation and amortization 1,762 1,575 5,241 4,557 Selling and other 622 538 1,816 1,568 Depreciation 82 75 240 221 Interest 22 22 67 63 Amortization 15 13 44 32 Asbestos settlement - net 5 6 22 23 Business restructuring - - - 35 Other - net (Note A) (20) 174 (49) 140 INCOME BEFORE INCOME TAXES AND MINORITY INTEREST 335 101 951 722 Income tax expense 103 14 273 167 Minority interest 17 17 56 52 INCOME FROM CONTINUING OPERATIONS 215 70 622 503 (Loss) income from discontinued operations, net of tax (24) 20 12 51 NET INCOME (Note B) $ 191 $ 90 $ 634 $ 554 Earnings per common share Income from continuing operations $ 1.30 $ 0.42 $ 3.77 $ 3.03 (Loss) income from discontinued operations $ (0.14) $ 0.12 $ 0.08 $ 0.31 NET INCOME $ 1.16 $ 0.54 $ 3.85 $ 3.34 Earnings per common share - assuming dilution Income from continuing operations $ 1.29 $ 0.42 $ 3.74 $ 3.02 (Loss) income from discontinued operations $ (0.14) $ 0.12 $ 0.08 $ 0.31 NET INCOME $ 1.15 $ 0.54 $ 3.82 $ 3.33 Average shares outstanding 164.4 165.7 164.6 165.9 Average shares outstanding - assuming dilution 166.0 166.6 166.0 166.6 Note A: The three and nine months ended September 30, 2006, included pretax charges of $173 million for estimated environmental remediation costs. The three and nine months ended September 30, 2006, also included pretax charges of $35 million and $42 million, respectively, for legal settlements and pretax income of $11 million and $39 million, respectively for insurance recoveries. Note B: The three and nine months ended September 30, 2006, included aftertax charges of $106 million for estimated environmental remediation costs. The three and nine months ended September 30, 2006, also included aftertax charges of $21 million and $26 million, respectively, for legal settlements and aftertax income of $7 million and $24 million, respectively for insurance recoveries.
- 2. BALANCE SHEET HIGHLIGHTS (unaudited) Sept. 30 Sept. 30 2007 2006 (millions) Current assets: Cash and cash equivalents $ 227 $ 309 Receivables - net 2,497 2,056 Inventories 1,385 1,184 Other 692 607 Assets held for sale 615 660 Total current assets $ 5,416 $ 4,816 Current liabilities: Short-term debt and current portion of long-term debt $ 178 $ 118 Asbestos settlement 601 561 Accounts payable and accrued liabilities 2,111 1,967 Liabilities of businesses held for sale 142 137 Total current liabilities $ 3,032 $ 2,783 Long-term debt $ 1,181 $ 1,195
- 3. BUSINESS SEGMENT INFORMATION (unaudited) 3 Months Ended 9 Months Ended Sept. 30 Sept. 30 2007 2006 2007 2006 (millions) Net sales Performance and Applied Coatings $ 963 $ 800 $ 2,792 $ 2,252 Industrial Coatings 901 811 2,713 2,389 Optical and Specialty Materials 257 230 786 690 Commodity Chemicals 400 371 1,151 1,144 Glass 302 292 890 886 TOTAL $ 2,823 $ 2,504 $ 8,332 $ 7,361 Segment income Performance and Applied Coatings $ 140 $ 131 $ 420 $ 380 Industrial Coatings 89 83 293 278 Optical and Specialty Materials 55 53 189 173 Commodity Chemicals 89 77 190 250 Glass 28 25 62 79 TOTAL 401 369 1,154 1,160 Legacy costs (Note A) (10) (203) (34) (220) Acquistion related costs (Note B) (6) - (6) - Asbestos settlement - net (5) (6) (22) (23) Interest - net (19) (18) (58) (53) Restructuring - - - (35) Unallocated stock based compensation (Note C) (13) (10) (31) (28) Other unallocated corporate expense (13) (31) (52) (79) INCOME BEFORE INCOME TAXES AND MINORITY INTEREST $ 335 $ 101 $ 951 $ 722 Note A: Legacy costs include current costs related to former operations of the Company, including certain environmental remediation, pension and other postretirement benefit costs and certain charges which are considered to be unusual or non- recurring. For the three and nine months ended September 30, 2006, these costs included a pretax charge of $165 million for environmental remediation and a charge for the settlement of a legal matter of $23 million. Legacy costs for the nine months ended September 30, 2006, also included pretax earnings of $33 million for insurance recoveries. Note B: Represents the flow through costs of sales of the step up to fair value of the inventory acquired in the Barloworld Coatings Australia transaction. Note C: Unallocated stock based compensation includes the cost of stock options, restricted stock units and contingent share grants which are not allocated to the operating segments.
- 4. PRIOR PERIOD INFORMATION (unaudited) The financial information below presents the sales and earnings of PPG Industries, Inc. and consolidated subsidiaries for the periods indicated after adjustment to reclassify the results of operations of the automotive glass businesses and fine chemicals business to discontinued operations. 3 Months Ended 3 Months Ended 6 Months Ended March 31 June 30 June 30 2007 2007 2007 (millions, except per share data) Net sales Performance and Applied Coatings $ 855 $ 974 $ 1,829 Industrial Coatings 869 943 1,812 Optical and Specialty Materials 251 278 529 Commodity Chemicals 371 380 751 Glass 286 302 588 TOTAL $ 2,632 $ 2,877 $ 5,509 Segment income Performance and Applied Coatings $ 121 $ 159 $ 280 Industrial Coatings 95 109 204 Optical and Specialty Materials 63 71 134 Commodity Chemicals 44 57 101 Glass 6 28 34 TOTAL 329 424 753 Legacy costs (Note A) (11) (13) (24) Asbestos settlement - net (9) (8) (17) Interest - net (19) (20) (39) Unallocated stock based compensation (Note B) (9) (9) (18) Other unallocated corporate expense (30) (9) (39) INCOME BEFORE INCOME TAXES AND MINORITY INTEREST 251 365 616 Income tax expense 57 113 170 Minority interest 18 21 39 INCOME FROM CONTINUING OPERATIONS 176 231 407 Income from discontinued operations, net of tax 18 18 36 NET INCOME $ 194 $ 249 $ 443 Earnings per common share Income from continuing operations $ 1.07 $ 1.40 $ 2.47 Income from discontinued operations $ 0.11 $ 0.11 $ 0.22 NET INCOME $ 1.18 $ 1.51 $ 2.69 Earnings per common share - assuming dilution Income from continuing operations $ 1.06 $ 1.39 $ 2.45 Income from discontinued operations $ 0.11 $ 0.11 $ 0.22 NET INCOME $ 1.17 $ 1.50 $ 2.67 Note A: Legacy costs include current costs related to former operations of the Company, including certain environmental remediation, pension and other postretirement benefit costs and certain charges which are considered to be unusual or non-recurring. Note B: Unallocated stock based compensation includes the cost of stock options, restricted stock units and contingent share grants which are not allocated to the operating segments.