- Baxter International reported financial results for Q3 2006 and year-to-date 2006 compared to the same periods in 2005.
- Net sales increased 7% to $2.56 billion in Q3 2006 and 3% to $7.62 billion for the first nine months of 2006.
- Operating income increased 29% to $504 million in Q3 2006 and 9% to $1.32 billion for the first nine months of 2006.
- Net income increased 222% to $374 million in Q3 2006 and 45% to $965 million for the first nine months of 2006, helped by lower tax expenses.
1. BAXTER -- PAGE 7
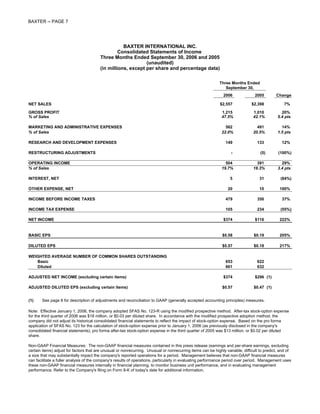
BAXTER INTERNATIONAL INC.
Consolidated Statements of Income
Three Months Ended September 30, 2006 and 2005
(unaudited)
(in millions, except per share and percentage data)
Three Months Ended
September 30,
2006 2005 Change
NET SALES $2,557 $2,398 7%
GROSS PROFIT 1,215 1,010 20%
% of Sales 47.5% 42.1% 5.4 pts
MARKETING AND ADMINISTRATIVE EXPENSES 562 491 14%
% of Sales 22.0% 20.5% 1.5 pts
RESEARCH AND DEVELOPMENT EXPENSES 149 133 12%
RESTRUCTURING ADJUSTMENTS - (5) (100%)
OPERATING INCOME 504 391 29%
% of Sales 19.7% 16.3% 3.4 pts
INTEREST, NET 5 31 (84%)
OTHER EXPENSE, NET 20 10 100%
INCOME BEFORE INCOME TAXES 479 350 37%
INCOME TAX EXPENSE 105 234 (55%)
NET INCOME $374 $116 222%
BASIC EPS $0.58 $0.19 205%
DILUTED EPS $0.57 $0.18 217%
WEIGHTED AVERAGE NUMBER OF COMMON SHARES OUTSTANDING
Basic 653 622
Diluted 661 632
ADJUSTED NET INCOME (excluding certain items) $374 $296 (1)
ADJUSTED DILUTED EPS (excluding certain items) $0.57 $0.47 (1)
(1) See page 8 for description of adjustments and reconciliation to GAAP (generally accepted accounting principles) measures.
Note: Effective January 1, 2006, the company adopted SFAS No. 123-R using the modified prospective method. After-tax stock-option expense
for the third quarter of 2006 was $18 million, or $0.03 per diluted share. In accordance with the modified prospective adoption method, the
company did not adjust its historical consolidated financial statements to reflect the impact of stock-option expense. Based on the pro forma
application of SFAS No. 123 for the calculation of stock-option expense prior to January 1, 2006 (as previously disclosed in the company's
consolidated financial statements), pro forma after-tax stock-option expense in the third quarter of 2005 was $13 million, or $0.02 per diluted
share.
Non-GAAP Financial Measures: The non-GAAP financial measures contained in this press release (earnings and per-share earnings, excluding
certain items) adjust for factors that are unusual or nonrecurring. Unusual or nonrecurring items can be highly variable, difficult to predict, and of
a size that may substantially impact the company's reported operations for a period. Management believes that non-GAAP financial measures
can facilitate a fuller analysis of the company's results of operations, particularly in evaluating performance period over period. Management uses
these non-GAAP financial measures internally in financial planning, to monitor business unit performance, and in evaluating management
performance. Refer to the Company's filing on Form 8-K of today's date for additional information.
2. BAXTER -- PAGE 8
BAXTER INTERNATIONAL, INC.
Consolidated Statements of Income
Three Months Ended September 30, 2005
Description of Adjustments and Reconciliation of GAAP to Non-GAAP
(unaudited)
(in millions, except per share and percentage data)
The Company's GAAP results for the three months ended September 30, 2005 included charges relating to the exit of
hemodialysis instrument manufacturing, taxes on the repatriation of foreign earnings, and a credit related to restructuring
adjustments, which impacted the GAAP results as follows:
Income
Operating Tax
Income Expense Net Income Diluted EPS
GAAP $391 $234 $116 $0.18
Hemodialysis instruments charge (A) 28 8 20 0.03
Restructuring adjustments (B) (5) (2) (3) -
Tax expense on repatriation of foreign earnings - (163) 163 0.26
Excluding specified items $414 $77 $296 $0.47
Adjusted operating income % 17.3%
(A) Included in the Gross Profit line in the accompanying consolidated statement of income. Excluding this item,
adjusted gross profit is $1.04 billion and the adjusted gross profit percentage is 43.2%.
(B) Included in the Restructuring Adjustments line in the accompanying consolidated statement of income.
3. BAXTER -- PAGE 9
BAXTER INTERNATIONAL INC.
Consolidated Statements of Income
Nine Months Ended September 30, 2006 and 2005
(unaudited)
(in millions, except per share and percentage data)
Nine Months Ended
September 30,
2006 2005 Change
NET SALES $7,615 $7,358 3%
GROSS PROFIT 3,422 3,015 13%
% of Sales 44.9% 41.0% 3.9 pts
MARKETING AND ADMINISTRATIVE EXPENSES 1,670 1,511 11%
% of Sales 21.9% 20.5% 1.4 pts
RESEARCH AND DEVELOPMENT EXPENSES 433 399 9%
RESTRUCTURING ADJUSTMENTS - (109) (100%)
OPERATING INCOME 1,319 1,214 9%
% of Sales 17.3% 16.5% 0.8 pts
INTEREST, NET 33 95 (65%)
OTHER EXPENSE, NET 55 59 (7%)
INCOME BEFORE INCOME TAXES 1,231 1,060 16%
INCOME TAX EXPENSE 266 396 (33%)
NET INCOME $965 $664 45%
BASIC EPS $1.49 $1.07 39%
DILUTED EPS $1.47 $1.06 39%
WEIGHTED AVERAGE NUMBER OF COMMON SHARES OUTSTANDING
Basic 650 621
Diluted 656 627
ADJUSTED NET INCOME (excluding certain items) $1,029 (1) $829 (1)
ADJUSTED DILUTED EPS (excluding certain items) $1.57 (1) $1.32 (1)
(1) See page 10 for description of adjustments and reconciliation to GAAP measures.
Note: Effective January 1, 2006, the company adopted SFAS No. 123-R using the modified prospective method. After-tax stock-option expense
for the nine months ended September 30, 2006 was $38 million, or $0.06 per diluted share. In accordance with the modified prospective
adoption method, the company did not adjust its historical consolidated financial statements to reflect the impact of stock-option expense. Based
on the pro forma application of SFAS No. 123 for the calculation of stock-option expense prior to January 1, 2006 (as previously disclosed in the
company's consolidated financial statements), pro forma after-tax stock-option expense for the nine months ended September 30, 2005 was $41
million, or $0.07 per diluted share.
Non-GAAP Financial Measures: The non-GAAP financial measures contained in this press release (earnings and per-share earnings, excluding
certain items) adjust for factors that are unusual or nonrecurring. Unusual or nonrecurring items can be highly variable, difficult to predict, and of
a size that may substantially impact the company's reported operations for a period. Management believes that non-GAAP financial measures
can facilitate a fuller analysis of the company's results of operations, particularly in evaluating performance period over period. Management
uses these non-GAAP financial measures internally in financial planning, to monitor business unit performance, and in evaluating management
performance. Refer to the Company's filing on Form 8-K of today's date for additional information.
4. BAXTER -- PAGE 10
BAXTER INTERNATIONAL, INC.
Consolidated Statements of Income
Nine Months Ended September 30, 2006 and 2005
Description of Adjustments and Reconciliation of GAAP to Non-GAAP
(unaudited)
(in millions, except per share and percentage data)
2006 description of adjustments and reconciliation of GAAP to Non-GAAP
The Company's GAAP results for the nine months ended September 30, 2006 included a charge related to COLLEAGUE
infusion pumps, which impacted the GAAP results as follows:
Income
Operating Tax
Income Expense Net Income Diluted EPS
GAAP $1,319 $266 $965 $1.47
COLLEAGUE infusion pump charge 76 12 64 0.10
(A)
Excluding specified items $1,395 $278 $1,029 $1.57
Adjusted operating income % 18.3%
(A) Included in the Gross Profit line in the accompanying consolidated statement of income. Excluding this item,
adjusted gross profit is $3.50 billion and the adjusted gross profit percentage is 45.9%.
2005 description of adjustments and reconciliation of GAAP to Non-GAAP
The Company's GAAP results for the nine months ended September 30, 2005 included charges relating to COLLEAGUE
infusion pumps, the exit of hemodialysis instrument manufacturing, taxes on the repatriation of foreign earnings, and a credit
related to restructuring adjustments, which impacted the GAAP results as follows:
Income
Operating Tax
Income Expense Net Income Diluted EPS
GAAP $1,214 $396 $664 $1.06
COLLEAGUE infusion pump charge (B) 77 12 65 0.10
Hemodialysis instruments charge (B) 28 8 20 0.03
Restructuring adjustments (C) (109) (26) (83) (0.13)
Tax expense on repatriation of foreign earnings - (163) 163 0.26
Excluding specified items $1,210 $227 $829 $1.32
Adjusted operating income % 16.4%
(B) Included in the Gross Profit line in the accompanying consolidated statement of income. Excluding these items,
adjusted gross profit is $3.12 billion and the adjusted gross profit percentage is 42.4%.
(C) Included in the Restructuring Adjustments line in the accompanying consolidated statement of income.
5. BAXTER -- PAGE 11
BAXTER INTERNATIONAL INC.
Condensed Consolidated Balance Sheets
(unaudited)
(in millions)
September 30, December 31,
2006 2005
ASSETS
Cash and equivalents $2,067 $841
Receivables 1,751 1,766
Inventories 2,089 1,925
Other current assets 512 584
Total current assets 6,419 5,116
Property, plant and equipment, net 4,095 4,144
Other long-term assets 3,417 3,467
Total assets $13,931 $12,727
LIABILITIES AND SHAREHOLDERS' EQUITY
Short-term debt $128 $924
Other current liabilities 2,841 3,241
Long-term debt 2,680 2,414
Other long-term liabilities 1,944 1,849
Shareholders' equity 6,338 4,299
Total liabilities and shareholders' equity $13,931 $12,727
6. BAXTER -- PAGE 12
BAXTER INTERNATIONAL INC.
Cash Flows from Operations and Changes in Net Debt
(unaudited)
($ in millions)
Cash Flows from Operations
(Brackets denote cash outflows) Three Months Ended Nine Months Ended
September 30, September 30,
2006 2005 2006 2005
Net income $374 $116 $965 $664
Adjustments
Depreciation and amortization 146 145 431 437
Deferred income taxes 58 80 76 198
Stock compensation 30 3 68 7
Infusion pump and hemodialysis instrument charges - 28 76 105
Restructuring adjustments - (5) - (109)
Other 7 20 29 46
Changes in balance sheet items
Receivables 18 98 33 133
Inventories (58) (22) (108) 68
Accounts payable and accrued liabilities (22) 54 (159) (287)
Restructuring payments (9) (22) (34) (95)
Other 29 41 44 147
Cash flows from operations $573 $536 $1,421 $1,314
Changes in Net Debt
Increase (decrease) Three Months Ended Nine Months Ended
September 30, September 30,
2006 2005 2006 2005
Net debt, beginning of period $1,298 $3,061 $2,497 $3,185
Cash flows from operations (573) (536) (1,421) (1,314)
Capital expenditures 138 116 336 279
Dividends - - 363 359
Acquisitions, net 1 14 3 14
Issuances of common stock - - (1,249) -
Purchases of treasury stock 87 - 479 -
Other, including the effect of exchange rate changes (210) (5) (267) 127
Decrease in net debt (557) (411) (1,756) (535)
Net debt, September 30 $741 $2,650 $741 $2,650
Key statistics, September 30:
Days sales outstanding 55.9 61.0 55.9 61.0
Inventory turns 2.4 2.7 2.4 2.7
Net-debt-to-capital ratio (A) 10.5% 25.3% 10.5% 25.3%
(A) The decrease in the debt-to-capital ratio from September 30, 2005 to September 30, 2006 primarily related to the settlement of the company's equity units. In February
2006, the purchase contracts included in the company's equity units matured, and the company issued approximately 35 million common shares in exchange for $1.25
billion. Management used a portion of the cash proceeds to pay down maturing debt. The net-debt-to-capital ratio at September 30, 2005 was calculated in accordance
with the company's primary credit agreements, which gave 70% equity credit to the company's $1.25 billion equity units debt outstanding on that date (the majority of
which was repurchased and retired in the fourth quarter of 2005). Refer to the company's Form 10-K for the year ended December 31, 2005 for additional information
regarding the equity units.
7. BAXTER -- PAGE 13
Baxter International Inc.
Net Sales from Continuing Operations
Period Ended September 30, 2006
(unaudited)
($ in millions)
% Growth @ % Growth @ % Growth @ % Growth @
Q3 Q3 YTD YTD
Actual Rates Constant Rates Actual Rates Constant Rates
2006 2005 2006 2005
BioScience
United States $528 $449 18% 18% $1,540 $1,285 20% 20%
International 560 501 12% 8% 1,669 1,557 7% 9%
Total $1,088 $950 15% 13% $3,209 $2,842 13% 14%
Medication Delivery
United States $489 $531 (8%) (8%) $1,532 $1,702 (10%) (10%)
International 461 426 8% 6% 1,346 1,316 2% 3%
Total $950 $957 (1%) (2%) $2,878 $3,018 (5%) (4%)
Renal
United States $95 $96 (1%) (1%) $286 $289 (1%) (1%)
International 424 395 7% 7% 1,242 1,209 3% 4%
Total $519 $491 6% 5% $1,528 $1,498 2% 3%
Baxter International Inc.
United States $1,112 $1,076 3% 3% $3,358 $3,276 3% 3%
International 1,445 1,322 9% 7% 4,257 4,082 4% 6%
Total $2,557 $2,398 7% 6% $7,615 $7,358 3% 4%
8. BAXTER -- PAGE 14
Baxter International Inc.
Key Product Line Sales
Period Ended September 30, 2006
(unaudited)
($ in millions)
% Growth @ % Growth @ % Growth @ % Growth @
Q3 Q3 YTD YTD
20051 20051
Actual Rates Constant Rates Actual Rates Constant Rates
2006 2006
BioScience
Recombinants $433 $392 10% 8% $1,244 $1,133 10% 11%
Plasma Proteins 2 214 176 22% 19% 619 516 20% 21%
Antibody Therapy 196 123 59% 57% 578 305 90% 90%
BioSurgery 3 72 63 14% 13% 220 199 11% 12%
Transfusion Therapies 121 134 (10%) (11%) 371 407 (9%) (8%)
Other 4 52 62 (16%) (16%) 177 282 (37%) (35%)
Total BioScience $1,088 $950 15% 13% $3,209 $2,842 13% 14%
Medication Delivery
IV Therapies 5 $317 $301 5% 4% $944 $909 4% 5%
Drug Delivery 205 192 7% 5% 613 622 (1%) (1%)
Infusion Systems 197 184 7% 7% 596 659 (10%) (9%)
Anesthesia and Injectable Drugs 221 259 (15%) (15%) 691 772 (10%) (10%)
Other 6 10 21 (52%) (48%) 34 56 (39%) (38%)
Total Medication Delivery $950 $957 (1%) (2%) $2,878 $3,018 (5%) (4%)
Renal
PD Therapy $409 $386 6% 6% $1,205 $1,153 5% 6%
HD Therapy 110 105 5% 5% 323 345 (6%) (6%)
Total Renal 7 $519 $491 6% 5% $1,528 $1,498 2% 3%
TOTAL BAXTER $2,557 $2,398 7% 6% $7,615 $7,358 3% 4%
1
Prior year sales data has been reclassified to reflect the changes that are described in notes 2, 3, 4 and 7 below.
2
Includes plasma-derived hemophilia (FVII, FVIII, FIX and FEIBA), albumin, and certain other plasma-based products. Sales of
Tisseel, sales of plasma to third parties, and contract manufacturing revenues were previously reported in Plasma Proteins,
and are now reported in other product lines, as detailed below.
3
Includes sales of Tisseel and FloSeal/CoSeal, which were previously reported in Plasma Proteins and Other, respectively.
4
Principally includes vaccines and sales of plasma to third parties. The sales of plasma to third parties were previously reported in Plasma
Proteins. The prior year sales include contract manufacturing revenues.
5
Principally includes intravenous solutions and nutritional products.
6
Principally includes other hospital-distributed products.
7
Sales of pharmaceutical and certain other products, which were previously reported in Other, are now reported in PD Therapy.
9. BAXTER -- PAGE 15
Baxter International Inc.
Key Product Line Sales -- US/International
Period Ended September 30, 2006
(unaudited)
($ in millions)
Q3 2005 1
Q3 2006 % Growth
US International Total US International Total US International Total
BioScience
Recombinants $182 $251 $433 $170 $222 $392 7% 13% 10%
Plasma Proteins 2 87 127 214 61 115 176 43% 10% 22%
Antibody Therapy 146 50 196 83 40 123 76% 25% 59%
BioSurgery 3 40 32 72 35 28 63 14% 14% 14%
Transfusion Therapies 60 61 121 66 68 134 (9%) (10%) (10%)
4
Other 13 39 52 34 28 62 (62%) 39% (16%)
Total BioScience $528 $560 $1,088 $449 $501 $950 18% 12% 15%
Medication Delivery
5
IV Therapies $103 $214 $317 $101 $200 $301 2% 7% 5%
Drug Delivery 128 77 205 120 72 192 7% 7% 7%
Infusion Systems 118 79 197 118 66 184 -% 20% 7%
Anesthesia and Injectable Drugs 135 86 221 184 75 259 (27%) 15% (15%)
Other 6 5 5 10 8 13 21 (38%) (62%) (52%)
Total Medication Delivery $489 $461 $950 $531 $426 $957 (8%) 8% (1%)
Renal
PD Therapy $67 $342 $409 $66 $320 $386 2% 7% 6%
HD Therapy 28 82 110 30 75 105 (7%) 9% 5%
Total Renal 7 $95 $424 $519 $96 $395 $491 (1%) 7% 6%
TOTAL BAXTER $1,112 $1,445 $2,557 $1,076 $1,322 $2,398 3% 9% 7%
1
Prior year sales data has been reclassified to reflect the changes that are described in notes 2, 3, 4 and 7 below.
2
Includes plasma-derived hemophilia (FVII, FVIII, FIX and FEIBA), albumin, and certain other plasma-based products. Sales of
Tisseel, sales of plasma to third parties, and contract manufacturing revenues were previously reported in Plasma Proteins,
and are now reported in other product lines, as detailed below.
3
Includes sales of Tisseel and FloSeal/CoSeal, which were previously reported in Plasma Proteins and Other, respectively.
4
Principally includes vaccines and sales of plasma to third parties. The sales of plasma to third parties were previously reported in Plasma
Proteins. The prior year sales include contract manufacturing revenues.
5
Principally includes intravenous solutions and nutritional products.
6
Principally includes other hospital-distributed products.
7
Sales of pharmaceutical and certain other products, which were previously reported in Other, are now reported in PD Therapy.