SlideShare une entreprise Scribd logo
1  sur  10
Télécharger pour lire hors ligne
UNISYS CORPORATION
                   CONSOLIDATED STATEMENTS OF INCOME
                   (Millions, except per share data)

                               Three Months             Year
                             Ended December 31     Ended December 31
                            ------------------    ------------------
                              2004      2003        2004      2003
                            -------- --------     -------- --------
Revenue
  Services                  $1,253.8   $1,297.2   $4,724.7    $4,691.9
  Technology                   270.2      340.4    1,096.0     1,219.3
                            --------   --------   --------    --------
                             1,524.0    1,637.6    5,820.7     5,911.2
Costs and expenses
  Cost of revenue:
    Services                 1,119.2      979.3    3,940.8     3,654.7
    Technology                 142.0      147.6      517.5       541.5
                            --------   --------   --------    --------
                             1,261.2    1,126.9    4,458.3     4,196.2
  Selling, general and
    administrative           265.1    270.1        1,102.9  1,007.2
  Research and development    76.2     81.4          294.3    280.1
                          -------- --------       -------- --------
                           1,602.5  1,478.4        5,855.5  5,483.5
                          -------- --------       -------- --------
Operating income (loss)      (78.5)   159.2          (34.8)   427.7

Interest expense               17.6       18.3         69.0      69.6
Other income
 (expense), net                  6.2       19.9       27.8        22.4
                            --------   --------   --------    --------
Income (loss) before
 income taxes                 (89.9)     160.8      (76.0)      380.5
Provision (benefit) for
 income taxes                  (55.0)    49.3       (114.6)   121.8
                            -------- --------     -------- --------
Net income (loss)             ($34.9)  $111.5        $38.6   $258.7
                            ======== ========     ======== ========
Earnings (loss) per share
Basic                      ($ .10)       $ .34      $ .12       $ .79
                          ========     ========   ========    ========
Diluted                    ($ .10)       $ .33      $ .11       $ .78
                          ========     ========   ========    ========
Shares used in the per share
  computations (thousands):
  Basic                    336,873      331,371    334,896     329,349
                          ========     ========   ========    ========
  Diluted                  336,873      337,842    338,217     332,948
                          ========     ========   ========    ========
UNISYS CORPORATION
                          SEGMENT RESULTS
                             (Millions)

                                   Elimi-
                        Total      nations     Services* Technology*
                       --------    --------    -------- ----------
Three Months Ended
December 31, 2004
------------------
Customer revenue       $1,524.0                $1,253.8      $270.2
Intersegment                         ($85.2)        3.6        81.6
                       --------    --------    --------    --------
Total revenue          $1,524.0      ($85.2)   $1,257.4      $351.8
                       ========    ========    ========    ========

Gross profit percent      17.2%                    6.2%       54.2%
                       ========                ========    ========
Operating profit
  (loss) percent          (5.2%)                  (9.4%)      12.0%
                       ========                ========    ========
Three Months Ended
December 31, 2003
------------------
Customer revenue       $1,637.6                $1,297.2      $340.4
Intersegment                         ($94.2)        6.7        87.5
                       --------    --------    --------    --------
Total revenue          $1,637.6      ($94.2)   $1,303.9      $427.9
                       ========    ========    ========    ========

Gross profit percent      31.2%                   22.1%       51.6%
                       ========                ========    ========
Operating profit
  percent                  9.7%                    7.2%       14.6%
                       ========                ========    ========

Year Ended
December 31, 2004
------------------
Customer revenue       $5,820.7                $4,724.7    $1,096.0
Intersegment                        ($251.8)       18.1       233.7
                       --------    --------    --------    --------
Total revenue          $5,820.7     ($251.8)   $4,742.8    $1,329.7
                       ========    ========    ========    ========

Gross profit percent      23.4%                   14.8%       51.7%
                       ========                ========    ========
Operating profit
  (loss) percent          (0.6%)                  (1.7%)      10.2%
                       ========                ========    ========
Year Ended
December 31, 2003
------------------
Customer revenue       $5,911.2                $4,691.9    $1,219.3
Intersegment                        ($319.8)       25.9       293.9
                       --------    --------    --------    --------
Total revenue          $5,911.2     ($319.8)   $4,717.8    $1,513.2
                       ========    ========    ========    ========

Gross profit percent      29.0%                   20.2%       50.4%
                       ========                ========    ========
Operating profit
  percent                  7.2%                    5.0%       12.7%
                       ========                ========    ========

* 2004 results exclude charges for cost reductions
and related actions as announced on October 6, 2004
UNISYS CORPORATION
                  CONSOLIDATED BALANCE SHEETS
                           (Millions)
                                       December 31, December 31,
                                          2004         2003
                                       ----------   ----------
Assets
Current assets
 Cash and cash equivalents                 $660.5        $635.9
 Accounts and notes receivable, net       1,136.8       1,027.8
 Inventories
   Parts and finished equipment              93.7         121.7
   Work in process and materials            122.4         116.9
 Deferred income taxes                      291.8         270.0
 Prepaid expense and other
   current assets                            112.4          85.7
                                        ----------    ----------
Total                                      2,417.6       2,258.0
                                        ----------    ----------
Properties                                 1,305.5       1,352.7
 Less accumulated depreciation
   and amortization                          881.4         928.5
                                        ----------    ----------
Properties, net                              424.1         424.2
                                        ----------    ----------
Outsourcing assets, net                      431.9         477.5
Marketable software, net                     336.8         332.2
Investments at equity                        197.1         153.3
Prepaid pension cost                          52.5          55.5
Deferred income taxes                      1,394.6       1,384.6
Goodwill                                     189.9         177.5
Other long-term assets                       176.4         206.8
                                        ----------    ----------
Total                                     $5,620.9      $5,469.6
                                        ==========    ==========
Liabilities and stockholders' equity
Current liabilities
 Notes payable                                $1.0         $17.7
 Current maturities of long-term debt        151.7           2.2
 Accounts payable                            487.4         513.8
 Other accrued liabilities                 1,316.1       1,305.7
 Income taxes payable                         66.6         214.1
                                        ----------    ----------
Total                                      2,022.8       2,053.5
                                        ----------    ----------
Long-term debt                               898.4       1,048.3
Accrued pension liabilities                  537.9         433.6
Other long-term liabilities                  655.3         539.0
Stockholders' equity
 Common stock                                  3.4           3.3
 Accumulated deficit                        (376.2)       (414.8)
 Other capital                             3,883.8       3,818.6
 Accumulated other comprehensive loss     (2,004.5)     (2,011.9)
                                        ----------    ----------
Stockholders' equity                       1,506.5       1,395.2
                                        ----------    ----------
Total                                     $5,620.9      $5,469.6
                                        ==========    ==========
UNISYS CORPORATION
              CONSOLIDATED STATEMENT OF CASH FLOWS
                           (Millions)

                                                Year Ended
                                                December 31
                                            ------------------
                                              2004       2003
                                            -------    -------
Cash flows from operating activities
Net income                                    $38.6      $258.7
Add (deduct) items to reconcile
 net income to net cash provided
 by operating activities:
Equity (income)                               (16.1)      (18.2)
Depreciation of properties                    136.5       144.4
Depreciation and amortization of
 outsourcing assets                           123.3        82.3
Amortization of marketable software           134.2       123.6
Impairment charge                             125.6
(Increase) decrease in deferred income
 taxes, net                                   (41.2)       57.2
Increase in receivables, net                  (61.8)      (67.7)
Decrease in inventories                        23.0        54.1
(Decrease) increase in accounts payable
 and other accrued liabilities                 (1.6)       25.6
Decrease in income taxes payable             (120.5)       (4.8)
Increase (decrease) in other liabilities      111.3       (70.9)
Increase in other assets                      (16.2)       (6.0)
Other                                          34.7        (7.5)
                                            -------     -------

Net cash provided by operating activities     469.8       570.8
                                            -------     -------
Cash flows from investing activities
 Proceeds from investments                   6,026.5     5,054.0
 Purchases of investments                   (6,054.3)   (5,122.1)
 Investment in marketable software            (119.6)     (144.1)
 Capital additions of properties              (137.0)     (116.7)
 Capital additions of outsourcing assets      (177.5)     (176.2)
 Purchases of businesses                       (19.4)       (5.3)
 Proceeds from sales of businesses               1.7
                                             -------    -------
Net cash used for investing activities        (479.6)    (510.4)
                                             -------    -------
Cash flows from financing activities
 Net reduction in short-term borrowings       (20.0)      (64.5)
 Proceeds from employee stock plans            38.8        31.5
 Payments of long-term debt                    (3.5)       (4.8)
 Proceeds from issuance of long-term debt                 293.3
                                            -------     -------

Net cash provided by financing activities      15.3       255.5
                                            -------     -------
Effect of exchange rate changes on cash
 and cash equivalents                          19.1        18.2
                                            -------     -------
Increase in cash and cash equivalents          24.6       334.1
Cash and cash equivalents, beginning of
 period                                       635.9       301.8
                                            -------     -------
Cash and cash equivalents, end of period     $660.5      $635.9
                                            =======     =======
Reconciliation of GAAP to Non-GAAP
Financial Information

The preceding release presents information with and
without pension expense or income. Unisys believes
that this information will enhance an overall
understanding of its financial performance due to the
significant change in pension expense or income from
period to period and the non-operational nature of
pension expense or income. The presentation of
non-GAAP information is not meant to be considered in
isolation or as a substitute for results prepared in
accordance with accounting principles generally
accepted in the United States.
UNISYS CORPORATION
               RECONCILIATION OF GAAP TO NON-GAAP
               CONSOLIDATED STATEMENTS OF INCOME
               (Millions, except per share data)

                                      Three Months Ended
                                      December 31, 2004
                                 ----------------------------
                                 US GAAP     Less    Without
                                    as     Pension   Pension
                                 Reported Expense    Expense
                                 -------- -------- --------
Revenue                          $1,524.0            $1,524.0

Costs and expenses
  Cost of revenue                 1,261.2     ($16.8)    1,244.4
  Selling, general and
    administrative                  265.1     (4.2)   260.9
  Research and development           76.2     (2.1)    74.1
                                 -------- -------- --------
                                  1,602.5    (23.1) 1,579.4
                                 -------- -------- --------
Operating income (loss)             (78.5)    23.1    (55.4)

Interest expense                     17.6                   17.6
Other income
 (expense), net                       6.2                     6.2
                                 --------    --------    --------
Income (loss) before
 income taxes                       (89.9)      23.1       (66.8)
Provision (benefit) for
 income taxes                       (55.0)     7.4          (47.6)
                                 -------- --------       --------
Net income (loss)                  ($34.9)   $15.7         ($19.2)
                                 ======== ========       ========
Earnings (loss) per share         ($ .10)   $ .05         ($ .05)
                                 ======== ========       ========

                                      Three Months Ended
                                      December 31, 2003
                                ----------------------------
                                 US GAAP     Less    Without
                                    as     Pension   Pension
                                 Reported   Income    Income
                                 -------- -------- --------
Revenue                          $1,637.6            $1,637.6

Costs and expenses
  Cost of revenue                 1,126.9      ($5.7)    1,121.2
  Selling, general and
    administrative                  270.1         2.1    272.2
  Research and development           81.4         3.4     84.8
                                 --------    -------- --------
                                  1,478.4        (0.2) 1,478.2
                                 --------    -------- --------
Operating income                    159.2         0.2    159.4

Interest expense                     18.3                   18.3
Other income
 (expense), net                      19.9                    19.9
                                 --------    --------    --------
Income before income taxes          160.8         0.2       161.0
Provision for income taxes           49.3         0.3        49.6
                                 --------    --------    --------
Net income                         $111.5       ($0.1)     $111.4
                                 ========    ========    ========
Earnings per share                 $ .33       $ .00       $ .33
                                 ========    ========    ========
UNISYS CORPORATION
               RECONCILIATION OF GAAP TO NON-GAAP
               CONSOLIDATED STATEMENTS OF INCOME
               (Millions, except per share data)

                                         Year Ended
                                      December 31, 2004
                                 ----------------------------
                                 US GAAP     Less    Without
                                    as     Pension   Pension
                                 Reported Expense    Expense
                                 -------- -------- --------
Revenue                          $5,820.7            $5,820.7

Costs and expenses
  Cost of revenue                 4,458.3     ($67.2)    4,391.1
  Selling, general and
    administrative                1,102.9    (18.3) 1,084.6
  Research and development          294.3     (8.1)   286.2
                                 -------- -------- --------
                                  5,855.5    (93.6) 5,761.9
                                 -------- -------- --------
Operating income                    (34.8)    93.6     58.8

Interest expense                     69.0                   69.0
Other income
 (expense), net                      27.8                    27.8
                                 --------    --------    --------
Income (loss) before
 income taxes                       (76.0)      93.6        17.6
Provision (benefit) for
 income taxes                      (114.6)    30.0          (84.6)
                                 -------- --------       --------
Net income                          $38.6    $63.6         $102.2
                                 ======== ========       ========
Earnings per share                 $ .11    $ .19          $ .30
                                 ======== ========       ========

                                         Year Ended
                                      December 31, 2003
                                ----------------------------
                                 US GAAP     Less    Without
                                    as     Pension   Pension
                                 Reported   Income    Income
                                 -------- -------- --------
Revenue                          $5,911.2            $5,911.2

Costs and expenses
  Cost of revenue                 4,196.2      ($1.3)    4,194.9
  Selling, general and
    administrative                1,007.2         9.7  1,016.9
  Research and development          280.1        14.2    294.3
                                 --------    -------- --------
                                  5,483.5        22.6  5,506.1
                                 --------    -------- --------
Operating income                    427.7       (22.6)   405.1

Interest expense                     69.6                   69.6
Other income
 (expense), net                      22.4                    22.4
                                 --------    --------    --------
Income before income taxes          380.5       (22.6)      357.9
Provision for income taxes          121.8        (7.2)      114.6
                                 --------    --------    --------
Net income                         $258.7      ($15.4)     $243.3
                                 ========    ========    ========
Earnings per share                 $ .78      ($ .05)      $ .73
                                 ========    ========    ========
UNISYS CORPORATION
                RECONCILIATION OF GAAP TO NON-GAAP
                  SEGMENT RESULTS OF OPERATIONS
                           (Millions)

                                Three Months Ended
                                December 31, 2004
                            ---------------------------
                                       Less    Without
                               As     Pension Pension
                            Reported Expense Expense
                            -------- -------- --------
Services Segment
  Total revenue             $1,257.4           $1,257.4
  Gross profit                  78.2    ($16.4)    94.6
   % of revenue                  6.2%               7.5%
  Operating income (loss)     (118.0)   (20.1)    (97.9)
   % of revenue                 -9.4%              -7.8%

Technology Segment
  Total revenue                351.8                 351.8
  Gross profit                 190.6     (0.4)       191.0
   % of revenue                 54.2%                 54.3%
  Operating income              42.0     (3.0)        45.0
   % of revenue                 12.0%                 12.8%

Total Company
  Total revenue              1,524.0              1,524.0
  Gross profit                 262.8    (16.8)      279.6
   % of revenue                 17.2%                18.3%
  Operating income (loss)      (78.5)   (23.1)      (55.4)
   % of revenue                 -5.2%                -3.6%

                                 Three Months Ended
                                 December 31, 2003
                            ----------------------------
                                        Less    Without
                                As     Pension Pension
                             Reported Expense Expense
                             -------- -------- --------
Services Segment
  Total revenue             $1,303.9           $1,303.9
  Gross profit                 288.4    ($6.4)    294.8
   % of revenue                 22.1%              22.6%
  Operating income              93.9     (4.4)     98.3
   % of revenue                  7.2%               7.5%

Technology Segment
  Total revenue                427.9                 427.9
  Gross profit                 220.8      0.7        220.1
   % of revenue                 51.6%                 51.4%
  Operating income              62.3      4.2         58.1
   % of revenue                 14.6%                 13.6%

Total Company
  Total revenue              1,637.6              1,637.6
  Gross profit                 510.7     (5.7)      516.4
   % of revenue                 31.2%                31.5%
  Operating income             159.2     (0.2)      159.4
   % of revenue                  9.7%                 9.7%
UNISYS CORPORATION
                RECONCILIATION OF GAAP TO NON-GAAP
                  SEGMENT RESULTS OF OPERATIONS
                           (Millions)
                                     Year Ended
                                  December 31, 2004
                             ----------------------------
                                         Less     Without
                                As     Pension    Pension
                             Reported Expense     Expense
                             -------- -------- --------
Services Segment *
  Total revenue              $4,742.8              $4,742.8
  Gross profit                  702.2    ($65.7)      767.9
   % of revenue                  14.8%                 16.2%
  Operating income (loss)       (82.8)   (81.1)        (1.7)
   % of revenue                  -1.7%                  0.0%

Technology Segment *
  Total revenue               1,329.7              1,329.7
  Gross profit                  686.8     (1.5)      688.3
   % of revenue                  51.7%                51.8%
  Operating income              136.0    (12.5)      148.5
   % of revenue                  10.2%                11.2%

Total Company
  Total revenue               5,820.7              5,820.7
  Gross profit                1,362.4    (67.2)    1,429.6
   % of revenue                  23.4%                24.6%
  Operating income (loss)       (34.8)   (93.6)       58.8
   % of revenue                  -0.6%                 1.0%
                                     Year Ended
                                  December 31, 2003
                             ----------------------------
                                         Less     Without
                                As     Pension    Pension
                             Reported   Income    Income
                             -------- -------- --------
Services Segment
  Total revenue              $4,717.8              $4,717.8
  Gross profit                  955.3    ($4.7)       960.0
   % of revenue                  20.2%                 20.3%
  Operating income              236.2      4.6        231.6
   % of revenue                   5.0%                  4.9%

Technology Segment
  Total revenue               1,513.2              1,513.2
  Gross profit                  763.4      3.4       760.0
   % of revenue                  50.4%                50.2%
  Operating income              192.1     18.0       174.1
   % of revenue                  12.7%                11.5%

Total Company
  Total revenue               5,911.2              5,911.2
  Gross profit                1,715.0     (1.3)    1,716.3
   % of revenue                  29.0%                29.0%
  Operating income              427.7     22.6       405.1
   % of revenue                   7.2%                 6.9%

* 2004 results exclude charges for cost reductions
and related actions as announced on October 6, 2004
UNISYS CORPORATION
               RECONCILATION OF GAAP TO NON-GAAP
       FORWARD-LOOKING ESTIMATED EARNINGS (LOSS) PER SHARE


                                        Three
                                        Months      Year
                                        Ending     Ending
                                       3/31/2005 12/31/2005
                                      ---------- ----------

Earnings (loss) per share-
   on a GAAP basis                    (.12)-(.09)    .13-.23

Add back estimated pension expense,
   net of tax                              .09            .37
                                      ---------     ---------
Earnings (loss) per share-
   on a NON-GAAP basis
   (excluding pension expense)         (.03)-0        .50-.60
                                      =========     =========

NOTE: See section in press release entitled
quot;Forward-Looking Statementsquot;.

Contenu connexe

Tendances

unisys 1Q06_SPR
unisys 1Q06_SPRunisys 1Q06_SPR
unisys 1Q06_SPR
finance36
 
unisys 2Q04_SPR
unisys 2Q04_SPRunisys 2Q04_SPR
unisys 2Q04_SPR
finance36
 
unisys 3Q08_SPR
unisys 3Q08_SPRunisys 3Q08_SPR
unisys 3Q08_SPR
finance36
 
unisys 3Q04_SPR
unisys 3Q04_SPRunisys 3Q04_SPR
unisys 3Q04_SPR
finance36
 
unisys 1Q05_SPR
unisys 1Q05_SPRunisys 1Q05_SPR
unisys 1Q05_SPR
finance36
 
unisys 2Q07_SPR
unisys 2Q07_SPRunisys 2Q07_SPR
unisys 2Q07_SPR
finance36
 
unisys 3Q06_SPR
unisys 3Q06_SPRunisys 3Q06_SPR
unisys 3Q06_SPR
finance36
 
unisys 3Q05_SPR
unisys 3Q05_SPRunisys 3Q05_SPR
unisys 3Q05_SPR
finance36
 
unisys 2Q08_SPR
unisys 2Q08_SPRunisys 2Q08_SPR
unisys 2Q08_SPR
finance36
 
unisys 1Q08_SPR
unisys 1Q08_SPRunisys 1Q08_SPR
unisys 1Q08_SPR
finance36
 
unisys 2001_1Q_10Q
unisys 2001_1Q_10Qunisys 2001_1Q_10Q
unisys 2001_1Q_10Q
finance36
 
unisys 2001_2Q_10Q
unisys 2001_2Q_10Qunisys 2001_2Q_10Q
unisys 2001_2Q_10Q
finance36
 
unisys 2002_3Q_10Q
unisys 2002_3Q_10Qunisys 2002_3Q_10Q
unisys 2002_3Q_10Q
finance36
 
unisys 2005_2Q_10Q
unisys 2005_2Q_10Qunisys 2005_2Q_10Q
unisys 2005_2Q_10Q
finance36
 
MHK-ar1999_financial
MHK-ar1999_financialMHK-ar1999_financial
MHK-ar1999_financial
finance30
 
unisys 2Q04_10Q
unisys 2Q04_10Qunisys 2Q04_10Q
unisys 2Q04_10Q
finance36
 
Big_Lots_AR2002FSO
Big_Lots_AR2002FSOBig_Lots_AR2002FSO
Big_Lots_AR2002FSO
finance50
 
aetna table 2005 3rd
aetna table 2005 3rdaetna table 2005 3rd
aetna table 2005 3rd
finance9
 

Tendances (18)

unisys 1Q06_SPR
unisys 1Q06_SPRunisys 1Q06_SPR
unisys 1Q06_SPR
 
unisys 2Q04_SPR
unisys 2Q04_SPRunisys 2Q04_SPR
unisys 2Q04_SPR
 
unisys 3Q08_SPR
unisys 3Q08_SPRunisys 3Q08_SPR
unisys 3Q08_SPR
 
unisys 3Q04_SPR
unisys 3Q04_SPRunisys 3Q04_SPR
unisys 3Q04_SPR
 
unisys 1Q05_SPR
unisys 1Q05_SPRunisys 1Q05_SPR
unisys 1Q05_SPR
 
unisys 2Q07_SPR
unisys 2Q07_SPRunisys 2Q07_SPR
unisys 2Q07_SPR
 
unisys 3Q06_SPR
unisys 3Q06_SPRunisys 3Q06_SPR
unisys 3Q06_SPR
 
unisys 3Q05_SPR
unisys 3Q05_SPRunisys 3Q05_SPR
unisys 3Q05_SPR
 
unisys 2Q08_SPR
unisys 2Q08_SPRunisys 2Q08_SPR
unisys 2Q08_SPR
 
unisys 1Q08_SPR
unisys 1Q08_SPRunisys 1Q08_SPR
unisys 1Q08_SPR
 
unisys 2001_1Q_10Q
unisys 2001_1Q_10Qunisys 2001_1Q_10Q
unisys 2001_1Q_10Q
 
unisys 2001_2Q_10Q
unisys 2001_2Q_10Qunisys 2001_2Q_10Q
unisys 2001_2Q_10Q
 
unisys 2002_3Q_10Q
unisys 2002_3Q_10Qunisys 2002_3Q_10Q
unisys 2002_3Q_10Q
 
unisys 2005_2Q_10Q
unisys 2005_2Q_10Qunisys 2005_2Q_10Q
unisys 2005_2Q_10Q
 
MHK-ar1999_financial
MHK-ar1999_financialMHK-ar1999_financial
MHK-ar1999_financial
 
unisys 2Q04_10Q
unisys 2Q04_10Qunisys 2Q04_10Q
unisys 2Q04_10Q
 
Big_Lots_AR2002FSO
Big_Lots_AR2002FSOBig_Lots_AR2002FSO
Big_Lots_AR2002FSO
 
aetna table 2005 3rd
aetna table 2005 3rdaetna table 2005 3rd
aetna table 2005 3rd
 

En vedette

micron technollogy 10Q_Q106
micron technollogy 10Q_Q106micron technollogy 10Q_Q106
micron technollogy 10Q_Q106
finance36
 
unisys 2005_4Q_10K
unisys 2005_4Q_10Kunisys 2005_4Q_10K
unisys 2005_4Q_10K
finance36
 
micron technollogy 8-K_062305_results
micron technollogy 8-K_062305_resultsmicron technollogy 8-K_062305_results
micron technollogy 8-K_062305_results
finance36
 
micron technollogy 2007_8_K_amendments_to_articles_of_incorporation
micron technollogy 2007_8_K_amendments_to_articles_of_incorporationmicron technollogy 2007_8_K_amendments_to_articles_of_incorporation
micron technollogy 2007_8_K_amendments_to_articles_of_incorporation
finance36
 
micron technollogy 8-K_122204_results
micron technollogy 8-K_122204_resultsmicron technollogy 8-K_122204_results
micron technollogy 8-K_122204_results
finance36
 
shaw group 8C04E297-E3DD-4F1E-8BB2-56C5BB51CEDA_SGR_AnnualShareholdersMeeting...
shaw group 8C04E297-E3DD-4F1E-8BB2-56C5BB51CEDA_SGR_AnnualShareholdersMeeting...shaw group 8C04E297-E3DD-4F1E-8BB2-56C5BB51CEDA_SGR_AnnualShareholdersMeeting...
shaw group 8C04E297-E3DD-4F1E-8BB2-56C5BB51CEDA_SGR_AnnualShareholdersMeeting...
finance36
 
unisys 2005_3Q_10Q
unisys 2005_3Q_10Qunisys 2005_3Q_10Q
unisys 2005_3Q_10Q
finance36
 
Micron Q2-08EarningsCall
Micron Q2-08EarningsCallMicron Q2-08EarningsCall
Micron Q2-08EarningsCall
finance36
 
micron technollogy 8K_093098_TIacquisition
micron technollogy 8K_093098_TIacquisitionmicron technollogy 8K_093098_TIacquisition
micron technollogy 8K_093098_TIacquisition
finance36
 
micron technollogy 2005_Q3_10Q
micron technollogy 2005_Q3_10Qmicron technollogy 2005_Q3_10Q
micron technollogy 2005_Q3_10Q
finance36
 
unisys 04258770
unisys 04258770unisys 04258770
unisys 04258770
finance36
 
micron technollogy 2006_8-k_disclosure_results_operations_financial_condition
micron technollogy 2006_8-k_disclosure_results_operations_financial_conditionmicron technollogy 2006_8-k_disclosure_results_operations_financial_condition
micron technollogy 2006_8-k_disclosure_results_operations_financial_condition
finance36
 
unisys 1Q04_10Q
unisys 1Q04_10Qunisys 1Q04_10Q
unisys 1Q04_10Q
finance36
 
unisys 2007_3Q_10Q
unisys 2007_3Q_10Qunisys 2007_3Q_10Q
unisys 2007_3Q_10Q
finance36
 
shaw group 103108_SHAWGROUPINC10K
shaw group 103108_SHAWGROUPINC10Kshaw group 103108_SHAWGROUPINC10K
shaw group 103108_SHAWGROUPINC10K
finance36
 

En vedette (15)

micron technollogy 10Q_Q106
micron technollogy 10Q_Q106micron technollogy 10Q_Q106
micron technollogy 10Q_Q106
 
unisys 2005_4Q_10K
unisys 2005_4Q_10Kunisys 2005_4Q_10K
unisys 2005_4Q_10K
 
micron technollogy 8-K_062305_results
micron technollogy 8-K_062305_resultsmicron technollogy 8-K_062305_results
micron technollogy 8-K_062305_results
 
micron technollogy 2007_8_K_amendments_to_articles_of_incorporation
micron technollogy 2007_8_K_amendments_to_articles_of_incorporationmicron technollogy 2007_8_K_amendments_to_articles_of_incorporation
micron technollogy 2007_8_K_amendments_to_articles_of_incorporation
 
micron technollogy 8-K_122204_results
micron technollogy 8-K_122204_resultsmicron technollogy 8-K_122204_results
micron technollogy 8-K_122204_results
 
shaw group 8C04E297-E3DD-4F1E-8BB2-56C5BB51CEDA_SGR_AnnualShareholdersMeeting...
shaw group 8C04E297-E3DD-4F1E-8BB2-56C5BB51CEDA_SGR_AnnualShareholdersMeeting...shaw group 8C04E297-E3DD-4F1E-8BB2-56C5BB51CEDA_SGR_AnnualShareholdersMeeting...
shaw group 8C04E297-E3DD-4F1E-8BB2-56C5BB51CEDA_SGR_AnnualShareholdersMeeting...
 
unisys 2005_3Q_10Q
unisys 2005_3Q_10Qunisys 2005_3Q_10Q
unisys 2005_3Q_10Q
 
Micron Q2-08EarningsCall
Micron Q2-08EarningsCallMicron Q2-08EarningsCall
Micron Q2-08EarningsCall
 
micron technollogy 8K_093098_TIacquisition
micron technollogy 8K_093098_TIacquisitionmicron technollogy 8K_093098_TIacquisition
micron technollogy 8K_093098_TIacquisition
 
micron technollogy 2005_Q3_10Q
micron technollogy 2005_Q3_10Qmicron technollogy 2005_Q3_10Q
micron technollogy 2005_Q3_10Q
 
unisys 04258770
unisys 04258770unisys 04258770
unisys 04258770
 
micron technollogy 2006_8-k_disclosure_results_operations_financial_condition
micron technollogy 2006_8-k_disclosure_results_operations_financial_conditionmicron technollogy 2006_8-k_disclosure_results_operations_financial_condition
micron technollogy 2006_8-k_disclosure_results_operations_financial_condition
 
unisys 1Q04_10Q
unisys 1Q04_10Qunisys 1Q04_10Q
unisys 1Q04_10Q
 
unisys 2007_3Q_10Q
unisys 2007_3Q_10Qunisys 2007_3Q_10Q
unisys 2007_3Q_10Q
 
shaw group 103108_SHAWGROUPINC10K
shaw group 103108_SHAWGROUPINC10Kshaw group 103108_SHAWGROUPINC10K
shaw group 103108_SHAWGROUPINC10K
 

Similaire à unisys 4Q04_SPR

unisys 2Q04_SPR
unisys 2Q04_SPRunisys 2Q04_SPR
unisys 2Q04_SPR
finance36
 
unisys 2Q04_SPR
unisys 2Q04_SPRunisys 2Q04_SPR
unisys 2Q04_SPR
finance36
 
unisys 2001_3Q_10Q
unisys 2001_3Q_10Qunisys 2001_3Q_10Q
unisys 2001_3Q_10Q
finance36
 
unisys 2003_1Q_10Q
unisys 2003_1Q_10Qunisys 2003_1Q_10Q
unisys 2003_1Q_10Q
finance36
 
unisys 2002_2Q_10Q
unisys 2002_2Q_10Qunisys 2002_2Q_10Q
unisys 2002_2Q_10Q
finance36
 
qwest communications Q_3Q07_Historical_v2
qwest communications Q_3Q07_Historical_v2qwest communications Q_3Q07_Historical_v2
qwest communications Q_3Q07_Historical_v2
finance19
 
Verizon Reports Sustained Revenue Growth and Continued Strong Cash Flows fo...
 	Verizon Reports Sustained Revenue Growth and Continued Strong Cash Flows fo... 	Verizon Reports Sustained Revenue Growth and Continued Strong Cash Flows fo...
Verizon Reports Sustained Revenue Growth and Continued Strong Cash Flows fo...
finance2
 
unisys 2005_1Q_10Q
unisys 2005_1Q_10Qunisys 2005_1Q_10Q
unisys 2005_1Q_10Q
finance36
 
qwest communications Q_4Q07_profile
qwest communications Q_4Q07_profileqwest communications Q_4Q07_profile
qwest communications Q_4Q07_profile
finance19
 
qwest communications Historical Quarterly Results1Q 06_2Q08
qwest communications Historical Quarterly Results1Q 06_2Q08qwest communications Historical Quarterly Results1Q 06_2Q08
qwest communications Historical Quarterly Results1Q 06_2Q08
finance19
 
SLM CorpSupplementalEarnDiscQ406
SLM CorpSupplementalEarnDiscQ406SLM CorpSupplementalEarnDiscQ406
SLM CorpSupplementalEarnDiscQ406
finance42
 

Similaire à unisys 4Q04_SPR (14)

unisys 2Q04_SPR
unisys 2Q04_SPRunisys 2Q04_SPR
unisys 2Q04_SPR
 
unisys 2Q04_SPR
unisys 2Q04_SPRunisys 2Q04_SPR
unisys 2Q04_SPR
 
unisys 2001_3Q_10Q
unisys 2001_3Q_10Qunisys 2001_3Q_10Q
unisys 2001_3Q_10Q
 
Maxim 2Q FISCAL 2009 RESULTS
Maxim 2Q FISCAL 2009 RESULTSMaxim 2Q FISCAL 2009 RESULTS
Maxim 2Q FISCAL 2009 RESULTS
 
unisys 2003_1Q_10Q
unisys 2003_1Q_10Qunisys 2003_1Q_10Q
unisys 2003_1Q_10Q
 
unisys 2002_2Q_10Q
unisys 2002_2Q_10Qunisys 2002_2Q_10Q
unisys 2002_2Q_10Q
 
qwest communications Q_3Q07_Historical_v2
qwest communications Q_3Q07_Historical_v2qwest communications Q_3Q07_Historical_v2
qwest communications Q_3Q07_Historical_v2
 
Verizon Reports Sustained Revenue Growth and Continued Strong Cash Flows fo...
 	Verizon Reports Sustained Revenue Growth and Continued Strong Cash Flows fo... 	Verizon Reports Sustained Revenue Growth and Continued Strong Cash Flows fo...
Verizon Reports Sustained Revenue Growth and Continued Strong Cash Flows fo...
 
Q1 2009 Earning Report of Sussex Bancorp
Q1 2009 Earning Report of Sussex BancorpQ1 2009 Earning Report of Sussex Bancorp
Q1 2009 Earning Report of Sussex Bancorp
 
unisys 2005_1Q_10Q
unisys 2005_1Q_10Qunisys 2005_1Q_10Q
unisys 2005_1Q_10Q
 
qwest communications Q_4Q07_profile
qwest communications Q_4Q07_profileqwest communications Q_4Q07_profile
qwest communications Q_4Q07_profile
 
Mc Donald Financial Analysis Project
Mc Donald Financial Analysis Project Mc Donald Financial Analysis Project
Mc Donald Financial Analysis Project
 
qwest communications Historical Quarterly Results1Q 06_2Q08
qwest communications Historical Quarterly Results1Q 06_2Q08qwest communications Historical Quarterly Results1Q 06_2Q08
qwest communications Historical Quarterly Results1Q 06_2Q08
 
SLM CorpSupplementalEarnDiscQ406
SLM CorpSupplementalEarnDiscQ406SLM CorpSupplementalEarnDiscQ406
SLM CorpSupplementalEarnDiscQ406
 

Plus de finance36

unisys 2001_10K
unisys 2001_10Kunisys 2001_10K
unisys 2001_10K
finance36
 
unisys 2002_1Q_10Q
unisys 2002_1Q_10Qunisys 2002_1Q_10Q
unisys 2002_1Q_10Q
finance36
 
unisys 2002_10K
unisys 2002_10Kunisys 2002_10K
unisys 2002_10K
finance36
 
unisys 2003_2Q_10Q
unisys 2003_2Q_10Qunisys 2003_2Q_10Q
unisys 2003_2Q_10Q
finance36
 
unisys 2003_3Q_10Q
unisys 2003_3Q_10Qunisys 2003_3Q_10Q
unisys 2003_3Q_10Q
finance36
 
unisys 2003_4Q_10K
unisys 2003_4Q_10Kunisys 2003_4Q_10K
unisys 2003_4Q_10K
finance36
 
unisys 3Q04_10Q
unisys 3Q04_10Qunisys 3Q04_10Q
unisys 3Q04_10Q
finance36
 
unisys 2004_4Q_10K
unisys 2004_4Q_10Kunisys 2004_4Q_10K
unisys 2004_4Q_10K
finance36
 
unisys 2006_1Q_10Q
unisys 2006_1Q_10Qunisys 2006_1Q_10Q
unisys 2006_1Q_10Q
finance36
 

Plus de finance36 (9)

unisys 2001_10K
unisys 2001_10Kunisys 2001_10K
unisys 2001_10K
 
unisys 2002_1Q_10Q
unisys 2002_1Q_10Qunisys 2002_1Q_10Q
unisys 2002_1Q_10Q
 
unisys 2002_10K
unisys 2002_10Kunisys 2002_10K
unisys 2002_10K
 
unisys 2003_2Q_10Q
unisys 2003_2Q_10Qunisys 2003_2Q_10Q
unisys 2003_2Q_10Q
 
unisys 2003_3Q_10Q
unisys 2003_3Q_10Qunisys 2003_3Q_10Q
unisys 2003_3Q_10Q
 
unisys 2003_4Q_10K
unisys 2003_4Q_10Kunisys 2003_4Q_10K
unisys 2003_4Q_10K
 
unisys 3Q04_10Q
unisys 3Q04_10Qunisys 3Q04_10Q
unisys 3Q04_10Q
 
unisys 2004_4Q_10K
unisys 2004_4Q_10Kunisys 2004_4Q_10K
unisys 2004_4Q_10K
 
unisys 2006_1Q_10Q
unisys 2006_1Q_10Qunisys 2006_1Q_10Q
unisys 2006_1Q_10Q
 

Dernier

VIP Call Girl in Mira Road 💧 9920725232 ( Call Me ) Get A New Crush Everyday ...
VIP Call Girl in Mira Road 💧 9920725232 ( Call Me ) Get A New Crush Everyday ...VIP Call Girl in Mira Road 💧 9920725232 ( Call Me ) Get A New Crush Everyday ...
VIP Call Girl in Mira Road 💧 9920725232 ( Call Me ) Get A New Crush Everyday ...
dipikadinghjn ( Why You Choose Us? ) Escorts
 
( Jasmin ) Top VIP Escorts Service Dindigul 💧 7737669865 💧 by Dindigul Call G...
( Jasmin ) Top VIP Escorts Service Dindigul 💧 7737669865 💧 by Dindigul Call G...( Jasmin ) Top VIP Escorts Service Dindigul 💧 7737669865 💧 by Dindigul Call G...
( Jasmin ) Top VIP Escorts Service Dindigul 💧 7737669865 💧 by Dindigul Call G...
dipikadinghjn ( Why You Choose Us? ) Escorts
 
VIP Independent Call Girls in Andheri 🌹 9920725232 ( Call Me ) Mumbai Escorts...
VIP Independent Call Girls in Andheri 🌹 9920725232 ( Call Me ) Mumbai Escorts...VIP Independent Call Girls in Andheri 🌹 9920725232 ( Call Me ) Mumbai Escorts...
VIP Independent Call Girls in Andheri 🌹 9920725232 ( Call Me ) Mumbai Escorts...
dipikadinghjn ( Why You Choose Us? ) Escorts
 
VIP Call Girl Service Andheri West ⚡ 9920725232 What It Takes To Be The Best ...
VIP Call Girl Service Andheri West ⚡ 9920725232 What It Takes To Be The Best ...VIP Call Girl Service Andheri West ⚡ 9920725232 What It Takes To Be The Best ...
VIP Call Girl Service Andheri West ⚡ 9920725232 What It Takes To Be The Best ...
dipikadinghjn ( Why You Choose Us? ) Escorts
 
From Luxury Escort Service Kamathipura : 9352852248 Make on-demand Arrangemen...
From Luxury Escort Service Kamathipura : 9352852248 Make on-demand Arrangemen...From Luxury Escort Service Kamathipura : 9352852248 Make on-demand Arrangemen...
From Luxury Escort Service Kamathipura : 9352852248 Make on-demand Arrangemen...
From Luxury Escort : 9352852248 Make on-demand Arrangements Near yOU
 
Call Girls in New Ashok Nagar, (delhi) call me [9953056974] escort service 24X7
Call Girls in New Ashok Nagar, (delhi) call me [9953056974] escort service 24X7Call Girls in New Ashok Nagar, (delhi) call me [9953056974] escort service 24X7
Call Girls in New Ashok Nagar, (delhi) call me [9953056974] escort service 24X7
9953056974 Low Rate Call Girls In Saket, Delhi NCR
 
VIP Independent Call Girls in Taloja 🌹 9920725232 ( Call Me ) Mumbai Escorts ...
VIP Independent Call Girls in Taloja 🌹 9920725232 ( Call Me ) Mumbai Escorts ...VIP Independent Call Girls in Taloja 🌹 9920725232 ( Call Me ) Mumbai Escorts ...
VIP Independent Call Girls in Taloja 🌹 9920725232 ( Call Me ) Mumbai Escorts ...
dipikadinghjn ( Why You Choose Us? ) Escorts
 
VIP Independent Call Girls in Bandra West 🌹 9920725232 ( Call Me ) Mumbai Esc...
VIP Independent Call Girls in Bandra West 🌹 9920725232 ( Call Me ) Mumbai Esc...VIP Independent Call Girls in Bandra West 🌹 9920725232 ( Call Me ) Mumbai Esc...
VIP Independent Call Girls in Bandra West 🌹 9920725232 ( Call Me ) Mumbai Esc...
dipikadinghjn ( Why You Choose Us? ) Escorts
 
VIP Independent Call Girls in Mira Bhayandar 🌹 9920725232 ( Call Me ) Mumbai ...
VIP Independent Call Girls in Mira Bhayandar 🌹 9920725232 ( Call Me ) Mumbai ...VIP Independent Call Girls in Mira Bhayandar 🌹 9920725232 ( Call Me ) Mumbai ...
VIP Independent Call Girls in Mira Bhayandar 🌹 9920725232 ( Call Me ) Mumbai ...
dipikadinghjn ( Why You Choose Us? ) Escorts
 

Dernier (20)

VIP Call Girl in Mira Road 💧 9920725232 ( Call Me ) Get A New Crush Everyday ...
VIP Call Girl in Mira Road 💧 9920725232 ( Call Me ) Get A New Crush Everyday ...VIP Call Girl in Mira Road 💧 9920725232 ( Call Me ) Get A New Crush Everyday ...
VIP Call Girl in Mira Road 💧 9920725232 ( Call Me ) Get A New Crush Everyday ...
 
8377087607, Door Step Call Girls In Kalkaji (Locanto) 24/7 Available
8377087607, Door Step Call Girls In Kalkaji (Locanto) 24/7 Available8377087607, Door Step Call Girls In Kalkaji (Locanto) 24/7 Available
8377087607, Door Step Call Girls In Kalkaji (Locanto) 24/7 Available
 
( Jasmin ) Top VIP Escorts Service Dindigul 💧 7737669865 💧 by Dindigul Call G...
( Jasmin ) Top VIP Escorts Service Dindigul 💧 7737669865 💧 by Dindigul Call G...( Jasmin ) Top VIP Escorts Service Dindigul 💧 7737669865 💧 by Dindigul Call G...
( Jasmin ) Top VIP Escorts Service Dindigul 💧 7737669865 💧 by Dindigul Call G...
 
VIP Independent Call Girls in Andheri 🌹 9920725232 ( Call Me ) Mumbai Escorts...
VIP Independent Call Girls in Andheri 🌹 9920725232 ( Call Me ) Mumbai Escorts...VIP Independent Call Girls in Andheri 🌹 9920725232 ( Call Me ) Mumbai Escorts...
VIP Independent Call Girls in Andheri 🌹 9920725232 ( Call Me ) Mumbai Escorts...
 
(Sexy Sheela) Call Girl Mumbai Call Now 👉9920725232👈 Mumbai Escorts 24x7
(Sexy Sheela) Call Girl Mumbai Call Now 👉9920725232👈 Mumbai Escorts 24x7(Sexy Sheela) Call Girl Mumbai Call Now 👉9920725232👈 Mumbai Escorts 24x7
(Sexy Sheela) Call Girl Mumbai Call Now 👉9920725232👈 Mumbai Escorts 24x7
 
(INDIRA) Call Girl Mumbai Call Now 8250077686 Mumbai Escorts 24x7
(INDIRA) Call Girl Mumbai Call Now 8250077686 Mumbai Escorts 24x7(INDIRA) Call Girl Mumbai Call Now 8250077686 Mumbai Escorts 24x7
(INDIRA) Call Girl Mumbai Call Now 8250077686 Mumbai Escorts 24x7
 
VIP Call Girl Service Andheri West ⚡ 9920725232 What It Takes To Be The Best ...
VIP Call Girl Service Andheri West ⚡ 9920725232 What It Takes To Be The Best ...VIP Call Girl Service Andheri West ⚡ 9920725232 What It Takes To Be The Best ...
VIP Call Girl Service Andheri West ⚡ 9920725232 What It Takes To Be The Best ...
 
From Luxury Escort Service Kamathipura : 9352852248 Make on-demand Arrangemen...
From Luxury Escort Service Kamathipura : 9352852248 Make on-demand Arrangemen...From Luxury Escort Service Kamathipura : 9352852248 Make on-demand Arrangemen...
From Luxury Escort Service Kamathipura : 9352852248 Make on-demand Arrangemen...
 
W.D. Gann Theory Complete Information.pdf
W.D. Gann Theory Complete Information.pdfW.D. Gann Theory Complete Information.pdf
W.D. Gann Theory Complete Information.pdf
 
Call Girls in New Ashok Nagar, (delhi) call me [9953056974] escort service 24X7
Call Girls in New Ashok Nagar, (delhi) call me [9953056974] escort service 24X7Call Girls in New Ashok Nagar, (delhi) call me [9953056974] escort service 24X7
Call Girls in New Ashok Nagar, (delhi) call me [9953056974] escort service 24X7
 
VIP Independent Call Girls in Taloja 🌹 9920725232 ( Call Me ) Mumbai Escorts ...
VIP Independent Call Girls in Taloja 🌹 9920725232 ( Call Me ) Mumbai Escorts ...VIP Independent Call Girls in Taloja 🌹 9920725232 ( Call Me ) Mumbai Escorts ...
VIP Independent Call Girls in Taloja 🌹 9920725232 ( Call Me ) Mumbai Escorts ...
 
Mira Road Memorable Call Grls Number-9833754194-Bhayandar Speciallty Call Gir...
Mira Road Memorable Call Grls Number-9833754194-Bhayandar Speciallty Call Gir...Mira Road Memorable Call Grls Number-9833754194-Bhayandar Speciallty Call Gir...
Mira Road Memorable Call Grls Number-9833754194-Bhayandar Speciallty Call Gir...
 
Webinar on E-Invoicing for Fintech Belgium
Webinar on E-Invoicing for Fintech BelgiumWebinar on E-Invoicing for Fintech Belgium
Webinar on E-Invoicing for Fintech Belgium
 
Vasai-Virar Fantastic Call Girls-9833754194-Call Girls MUmbai
Vasai-Virar Fantastic Call Girls-9833754194-Call Girls MUmbaiVasai-Virar Fantastic Call Girls-9833754194-Call Girls MUmbai
Vasai-Virar Fantastic Call Girls-9833754194-Call Girls MUmbai
 
Call Girls Rajgurunagar Call Me 7737669865 Budget Friendly No Advance Booking
Call Girls Rajgurunagar Call Me 7737669865 Budget Friendly No Advance BookingCall Girls Rajgurunagar Call Me 7737669865 Budget Friendly No Advance Booking
Call Girls Rajgurunagar Call Me 7737669865 Budget Friendly No Advance Booking
 
VIP Independent Call Girls in Bandra West 🌹 9920725232 ( Call Me ) Mumbai Esc...
VIP Independent Call Girls in Bandra West 🌹 9920725232 ( Call Me ) Mumbai Esc...VIP Independent Call Girls in Bandra West 🌹 9920725232 ( Call Me ) Mumbai Esc...
VIP Independent Call Girls in Bandra West 🌹 9920725232 ( Call Me ) Mumbai Esc...
 
Top Rated Pune Call Girls Shikrapur ⟟ 6297143586 ⟟ Call Me For Genuine Sex S...
Top Rated  Pune Call Girls Shikrapur ⟟ 6297143586 ⟟ Call Me For Genuine Sex S...Top Rated  Pune Call Girls Shikrapur ⟟ 6297143586 ⟟ Call Me For Genuine Sex S...
Top Rated Pune Call Girls Shikrapur ⟟ 6297143586 ⟟ Call Me For Genuine Sex S...
 
Business Principles, Tools, and Techniques in Participating in Various Types...
Business Principles, Tools, and Techniques  in Participating in Various Types...Business Principles, Tools, and Techniques  in Participating in Various Types...
Business Principles, Tools, and Techniques in Participating in Various Types...
 
VIP Independent Call Girls in Mira Bhayandar 🌹 9920725232 ( Call Me ) Mumbai ...
VIP Independent Call Girls in Mira Bhayandar 🌹 9920725232 ( Call Me ) Mumbai ...VIP Independent Call Girls in Mira Bhayandar 🌹 9920725232 ( Call Me ) Mumbai ...
VIP Independent Call Girls in Mira Bhayandar 🌹 9920725232 ( Call Me ) Mumbai ...
 
Top Rated Pune Call Girls Sinhagad Road ⟟ 6297143586 ⟟ Call Me For Genuine S...
Top Rated  Pune Call Girls Sinhagad Road ⟟ 6297143586 ⟟ Call Me For Genuine S...Top Rated  Pune Call Girls Sinhagad Road ⟟ 6297143586 ⟟ Call Me For Genuine S...
Top Rated Pune Call Girls Sinhagad Road ⟟ 6297143586 ⟟ Call Me For Genuine S...
 

unisys 4Q04_SPR

  • 1. UNISYS CORPORATION CONSOLIDATED STATEMENTS OF INCOME (Millions, except per share data) Three Months Year Ended December 31 Ended December 31 ------------------ ------------------ 2004 2003 2004 2003 -------- -------- -------- -------- Revenue Services $1,253.8 $1,297.2 $4,724.7 $4,691.9 Technology 270.2 340.4 1,096.0 1,219.3 -------- -------- -------- -------- 1,524.0 1,637.6 5,820.7 5,911.2 Costs and expenses Cost of revenue: Services 1,119.2 979.3 3,940.8 3,654.7 Technology 142.0 147.6 517.5 541.5 -------- -------- -------- -------- 1,261.2 1,126.9 4,458.3 4,196.2 Selling, general and administrative 265.1 270.1 1,102.9 1,007.2 Research and development 76.2 81.4 294.3 280.1 -------- -------- -------- -------- 1,602.5 1,478.4 5,855.5 5,483.5 -------- -------- -------- -------- Operating income (loss) (78.5) 159.2 (34.8) 427.7 Interest expense 17.6 18.3 69.0 69.6 Other income (expense), net 6.2 19.9 27.8 22.4 -------- -------- -------- -------- Income (loss) before income taxes (89.9) 160.8 (76.0) 380.5 Provision (benefit) for income taxes (55.0) 49.3 (114.6) 121.8 -------- -------- -------- -------- Net income (loss) ($34.9) $111.5 $38.6 $258.7 ======== ======== ======== ======== Earnings (loss) per share Basic ($ .10) $ .34 $ .12 $ .79 ======== ======== ======== ======== Diluted ($ .10) $ .33 $ .11 $ .78 ======== ======== ======== ======== Shares used in the per share computations (thousands): Basic 336,873 331,371 334,896 329,349 ======== ======== ======== ======== Diluted 336,873 337,842 338,217 332,948 ======== ======== ======== ========
  • 2. UNISYS CORPORATION SEGMENT RESULTS (Millions) Elimi- Total nations Services* Technology* -------- -------- -------- ---------- Three Months Ended December 31, 2004 ------------------ Customer revenue $1,524.0 $1,253.8 $270.2 Intersegment ($85.2) 3.6 81.6 -------- -------- -------- -------- Total revenue $1,524.0 ($85.2) $1,257.4 $351.8 ======== ======== ======== ======== Gross profit percent 17.2% 6.2% 54.2% ======== ======== ======== Operating profit (loss) percent (5.2%) (9.4%) 12.0% ======== ======== ======== Three Months Ended December 31, 2003 ------------------ Customer revenue $1,637.6 $1,297.2 $340.4 Intersegment ($94.2) 6.7 87.5 -------- -------- -------- -------- Total revenue $1,637.6 ($94.2) $1,303.9 $427.9 ======== ======== ======== ======== Gross profit percent 31.2% 22.1% 51.6% ======== ======== ======== Operating profit percent 9.7% 7.2% 14.6% ======== ======== ======== Year Ended December 31, 2004 ------------------ Customer revenue $5,820.7 $4,724.7 $1,096.0 Intersegment ($251.8) 18.1 233.7 -------- -------- -------- -------- Total revenue $5,820.7 ($251.8) $4,742.8 $1,329.7 ======== ======== ======== ======== Gross profit percent 23.4% 14.8% 51.7% ======== ======== ======== Operating profit (loss) percent (0.6%) (1.7%) 10.2% ======== ======== ======== Year Ended December 31, 2003 ------------------ Customer revenue $5,911.2 $4,691.9 $1,219.3 Intersegment ($319.8) 25.9 293.9 -------- -------- -------- -------- Total revenue $5,911.2 ($319.8) $4,717.8 $1,513.2 ======== ======== ======== ======== Gross profit percent 29.0% 20.2% 50.4% ======== ======== ======== Operating profit percent 7.2% 5.0% 12.7% ======== ======== ======== * 2004 results exclude charges for cost reductions and related actions as announced on October 6, 2004
  • 3. UNISYS CORPORATION CONSOLIDATED BALANCE SHEETS (Millions) December 31, December 31, 2004 2003 ---------- ---------- Assets Current assets Cash and cash equivalents $660.5 $635.9 Accounts and notes receivable, net 1,136.8 1,027.8 Inventories Parts and finished equipment 93.7 121.7 Work in process and materials 122.4 116.9 Deferred income taxes 291.8 270.0 Prepaid expense and other current assets 112.4 85.7 ---------- ---------- Total 2,417.6 2,258.0 ---------- ---------- Properties 1,305.5 1,352.7 Less accumulated depreciation and amortization 881.4 928.5 ---------- ---------- Properties, net 424.1 424.2 ---------- ---------- Outsourcing assets, net 431.9 477.5 Marketable software, net 336.8 332.2 Investments at equity 197.1 153.3 Prepaid pension cost 52.5 55.5 Deferred income taxes 1,394.6 1,384.6 Goodwill 189.9 177.5 Other long-term assets 176.4 206.8 ---------- ---------- Total $5,620.9 $5,469.6 ========== ========== Liabilities and stockholders' equity Current liabilities Notes payable $1.0 $17.7 Current maturities of long-term debt 151.7 2.2 Accounts payable 487.4 513.8 Other accrued liabilities 1,316.1 1,305.7 Income taxes payable 66.6 214.1 ---------- ---------- Total 2,022.8 2,053.5 ---------- ---------- Long-term debt 898.4 1,048.3 Accrued pension liabilities 537.9 433.6 Other long-term liabilities 655.3 539.0 Stockholders' equity Common stock 3.4 3.3 Accumulated deficit (376.2) (414.8) Other capital 3,883.8 3,818.6 Accumulated other comprehensive loss (2,004.5) (2,011.9) ---------- ---------- Stockholders' equity 1,506.5 1,395.2 ---------- ---------- Total $5,620.9 $5,469.6 ========== ==========
  • 4. UNISYS CORPORATION CONSOLIDATED STATEMENT OF CASH FLOWS (Millions) Year Ended December 31 ------------------ 2004 2003 ------- ------- Cash flows from operating activities Net income $38.6 $258.7 Add (deduct) items to reconcile net income to net cash provided by operating activities: Equity (income) (16.1) (18.2) Depreciation of properties 136.5 144.4 Depreciation and amortization of outsourcing assets 123.3 82.3 Amortization of marketable software 134.2 123.6 Impairment charge 125.6 (Increase) decrease in deferred income taxes, net (41.2) 57.2 Increase in receivables, net (61.8) (67.7) Decrease in inventories 23.0 54.1 (Decrease) increase in accounts payable and other accrued liabilities (1.6) 25.6 Decrease in income taxes payable (120.5) (4.8) Increase (decrease) in other liabilities 111.3 (70.9) Increase in other assets (16.2) (6.0) Other 34.7 (7.5) ------- ------- Net cash provided by operating activities 469.8 570.8 ------- ------- Cash flows from investing activities Proceeds from investments 6,026.5 5,054.0 Purchases of investments (6,054.3) (5,122.1) Investment in marketable software (119.6) (144.1) Capital additions of properties (137.0) (116.7) Capital additions of outsourcing assets (177.5) (176.2) Purchases of businesses (19.4) (5.3) Proceeds from sales of businesses 1.7 ------- ------- Net cash used for investing activities (479.6) (510.4) ------- ------- Cash flows from financing activities Net reduction in short-term borrowings (20.0) (64.5) Proceeds from employee stock plans 38.8 31.5 Payments of long-term debt (3.5) (4.8) Proceeds from issuance of long-term debt 293.3 ------- ------- Net cash provided by financing activities 15.3 255.5 ------- ------- Effect of exchange rate changes on cash and cash equivalents 19.1 18.2 ------- ------- Increase in cash and cash equivalents 24.6 334.1 Cash and cash equivalents, beginning of period 635.9 301.8 ------- ------- Cash and cash equivalents, end of period $660.5 $635.9 ======= =======
  • 5. Reconciliation of GAAP to Non-GAAP Financial Information The preceding release presents information with and without pension expense or income. Unisys believes that this information will enhance an overall understanding of its financial performance due to the significant change in pension expense or income from period to period and the non-operational nature of pension expense or income. The presentation of non-GAAP information is not meant to be considered in isolation or as a substitute for results prepared in accordance with accounting principles generally accepted in the United States.
  • 6. UNISYS CORPORATION RECONCILIATION OF GAAP TO NON-GAAP CONSOLIDATED STATEMENTS OF INCOME (Millions, except per share data) Three Months Ended December 31, 2004 ---------------------------- US GAAP Less Without as Pension Pension Reported Expense Expense -------- -------- -------- Revenue $1,524.0 $1,524.0 Costs and expenses Cost of revenue 1,261.2 ($16.8) 1,244.4 Selling, general and administrative 265.1 (4.2) 260.9 Research and development 76.2 (2.1) 74.1 -------- -------- -------- 1,602.5 (23.1) 1,579.4 -------- -------- -------- Operating income (loss) (78.5) 23.1 (55.4) Interest expense 17.6 17.6 Other income (expense), net 6.2 6.2 -------- -------- -------- Income (loss) before income taxes (89.9) 23.1 (66.8) Provision (benefit) for income taxes (55.0) 7.4 (47.6) -------- -------- -------- Net income (loss) ($34.9) $15.7 ($19.2) ======== ======== ======== Earnings (loss) per share ($ .10) $ .05 ($ .05) ======== ======== ======== Three Months Ended December 31, 2003 ---------------------------- US GAAP Less Without as Pension Pension Reported Income Income -------- -------- -------- Revenue $1,637.6 $1,637.6 Costs and expenses Cost of revenue 1,126.9 ($5.7) 1,121.2 Selling, general and administrative 270.1 2.1 272.2 Research and development 81.4 3.4 84.8 -------- -------- -------- 1,478.4 (0.2) 1,478.2 -------- -------- -------- Operating income 159.2 0.2 159.4 Interest expense 18.3 18.3 Other income (expense), net 19.9 19.9 -------- -------- -------- Income before income taxes 160.8 0.2 161.0 Provision for income taxes 49.3 0.3 49.6 -------- -------- -------- Net income $111.5 ($0.1) $111.4 ======== ======== ======== Earnings per share $ .33 $ .00 $ .33 ======== ======== ========
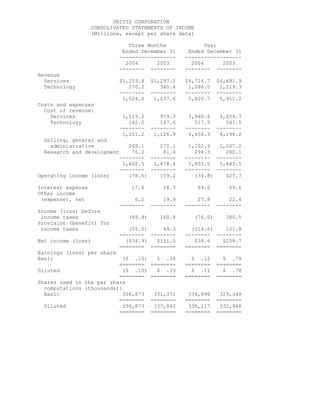
  • 7. UNISYS CORPORATION RECONCILIATION OF GAAP TO NON-GAAP CONSOLIDATED STATEMENTS OF INCOME (Millions, except per share data) Year Ended December 31, 2004 ---------------------------- US GAAP Less Without as Pension Pension Reported Expense Expense -------- -------- -------- Revenue $5,820.7 $5,820.7 Costs and expenses Cost of revenue 4,458.3 ($67.2) 4,391.1 Selling, general and administrative 1,102.9 (18.3) 1,084.6 Research and development 294.3 (8.1) 286.2 -------- -------- -------- 5,855.5 (93.6) 5,761.9 -------- -------- -------- Operating income (34.8) 93.6 58.8 Interest expense 69.0 69.0 Other income (expense), net 27.8 27.8 -------- -------- -------- Income (loss) before income taxes (76.0) 93.6 17.6 Provision (benefit) for income taxes (114.6) 30.0 (84.6) -------- -------- -------- Net income $38.6 $63.6 $102.2 ======== ======== ======== Earnings per share $ .11 $ .19 $ .30 ======== ======== ======== Year Ended December 31, 2003 ---------------------------- US GAAP Less Without as Pension Pension Reported Income Income -------- -------- -------- Revenue $5,911.2 $5,911.2 Costs and expenses Cost of revenue 4,196.2 ($1.3) 4,194.9 Selling, general and administrative 1,007.2 9.7 1,016.9 Research and development 280.1 14.2 294.3 -------- -------- -------- 5,483.5 22.6 5,506.1 -------- -------- -------- Operating income 427.7 (22.6) 405.1 Interest expense 69.6 69.6 Other income (expense), net 22.4 22.4 -------- -------- -------- Income before income taxes 380.5 (22.6) 357.9 Provision for income taxes 121.8 (7.2) 114.6 -------- -------- -------- Net income $258.7 ($15.4) $243.3 ======== ======== ======== Earnings per share $ .78 ($ .05) $ .73 ======== ======== ========
  • 8. UNISYS CORPORATION RECONCILIATION OF GAAP TO NON-GAAP SEGMENT RESULTS OF OPERATIONS (Millions) Three Months Ended December 31, 2004 --------------------------- Less Without As Pension Pension Reported Expense Expense -------- -------- -------- Services Segment Total revenue $1,257.4 $1,257.4 Gross profit 78.2 ($16.4) 94.6 % of revenue 6.2% 7.5% Operating income (loss) (118.0) (20.1) (97.9) % of revenue -9.4% -7.8% Technology Segment Total revenue 351.8 351.8 Gross profit 190.6 (0.4) 191.0 % of revenue 54.2% 54.3% Operating income 42.0 (3.0) 45.0 % of revenue 12.0% 12.8% Total Company Total revenue 1,524.0 1,524.0 Gross profit 262.8 (16.8) 279.6 % of revenue 17.2% 18.3% Operating income (loss) (78.5) (23.1) (55.4) % of revenue -5.2% -3.6% Three Months Ended December 31, 2003 ---------------------------- Less Without As Pension Pension Reported Expense Expense -------- -------- -------- Services Segment Total revenue $1,303.9 $1,303.9 Gross profit 288.4 ($6.4) 294.8 % of revenue 22.1% 22.6% Operating income 93.9 (4.4) 98.3 % of revenue 7.2% 7.5% Technology Segment Total revenue 427.9 427.9 Gross profit 220.8 0.7 220.1 % of revenue 51.6% 51.4% Operating income 62.3 4.2 58.1 % of revenue 14.6% 13.6% Total Company Total revenue 1,637.6 1,637.6 Gross profit 510.7 (5.7) 516.4 % of revenue 31.2% 31.5% Operating income 159.2 (0.2) 159.4 % of revenue 9.7% 9.7%
  • 9. UNISYS CORPORATION RECONCILIATION OF GAAP TO NON-GAAP SEGMENT RESULTS OF OPERATIONS (Millions) Year Ended December 31, 2004 ---------------------------- Less Without As Pension Pension Reported Expense Expense -------- -------- -------- Services Segment * Total revenue $4,742.8 $4,742.8 Gross profit 702.2 ($65.7) 767.9 % of revenue 14.8% 16.2% Operating income (loss) (82.8) (81.1) (1.7) % of revenue -1.7% 0.0% Technology Segment * Total revenue 1,329.7 1,329.7 Gross profit 686.8 (1.5) 688.3 % of revenue 51.7% 51.8% Operating income 136.0 (12.5) 148.5 % of revenue 10.2% 11.2% Total Company Total revenue 5,820.7 5,820.7 Gross profit 1,362.4 (67.2) 1,429.6 % of revenue 23.4% 24.6% Operating income (loss) (34.8) (93.6) 58.8 % of revenue -0.6% 1.0% Year Ended December 31, 2003 ---------------------------- Less Without As Pension Pension Reported Income Income -------- -------- -------- Services Segment Total revenue $4,717.8 $4,717.8 Gross profit 955.3 ($4.7) 960.0 % of revenue 20.2% 20.3% Operating income 236.2 4.6 231.6 % of revenue 5.0% 4.9% Technology Segment Total revenue 1,513.2 1,513.2 Gross profit 763.4 3.4 760.0 % of revenue 50.4% 50.2% Operating income 192.1 18.0 174.1 % of revenue 12.7% 11.5% Total Company Total revenue 5,911.2 5,911.2 Gross profit 1,715.0 (1.3) 1,716.3 % of revenue 29.0% 29.0% Operating income 427.7 22.6 405.1 % of revenue 7.2% 6.9% * 2004 results exclude charges for cost reductions and related actions as announced on October 6, 2004
  • 10. UNISYS CORPORATION RECONCILATION OF GAAP TO NON-GAAP FORWARD-LOOKING ESTIMATED EARNINGS (LOSS) PER SHARE Three Months Year Ending Ending 3/31/2005 12/31/2005 ---------- ---------- Earnings (loss) per share- on a GAAP basis (.12)-(.09) .13-.23 Add back estimated pension expense, net of tax .09 .37 --------- --------- Earnings (loss) per share- on a NON-GAAP basis (excluding pension expense) (.03)-0 .50-.60 ========= ========= NOTE: See section in press release entitled quot;Forward-Looking Statementsquot;.