(INDIRA) Call Girl Mumbai Call Now 8250077686 Mumbai Escorts 24x7
marathon oil 3rd Quarter 2005
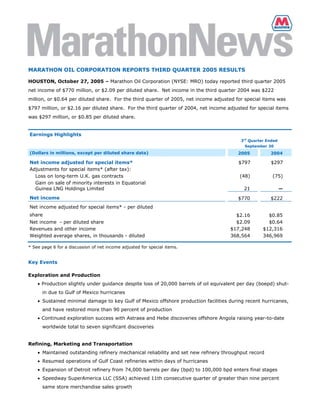
1. MARATHON OIL CORPORATION REPORTS THIRD QUARTER 2005 RESULTS
HOUSTON, October 27, 2005 – Marathon Oil Corporation (NYSE: MRO) today reported third quarter 2005
net income of $770 million, or $2.09 per diluted share. Net income in the third quarter 2004 was $222
million, or $0.64 per diluted share. For the third quarter of 2005, net income adjusted for special items was
$797 million, or $2.16 per diluted share. For the third quarter of 2004, net income adjusted for special items
was $297 million, or $0.85 per diluted share.
Earnings Highlights
3rd Quarter Ended
September 30
(Dollars in millions, except per diluted share data) 2005 2004
Net income adjusted for special items* $797 $297
Adjustments for special items* (after tax):
Loss on long-term U.K. gas contracts (48) (75)
Gain on sale of minority interests in Equatorial
Guinea LNG Holdings Limited 21 —
Net income $770 $222
Net income adjusted for special items* - per diluted
share $2.16 $0.85
Net income - per diluted share $2.09 $0.64
Revenues and other income $17,248 $12,316
Weighted average shares, in thousands - diluted 368,564 346,969
* See page 6 for a discussion of net income adjusted for special items.
Key Events
Exploration and Production
• Production slightly under guidance despite loss of 20,000 barrels of oil equivalent per day (boepd) shut-
in due to Gulf of Mexico hurricanes
• Sustained minimal damage to key Gulf of Mexico offshore production facilities during recent hurricanes,
and have restored more than 90 percent of production
• Continued exploration success with Astraea and Hebe discoveries offshore Angola raising year-to-date
worldwide total to seven significant discoveries
Refining, Marketing and Transportation
• Maintained outstanding refinery mechanical reliability and set new refinery throughput record
• Resumed operations of Gulf Coast refineries within days of hurricanes
• Expansion of Detroit refinery from 74,000 barrels per day (bpd) to 100,000 bpd enters final stages
• Speedway SuperAmerica LLC (SSA) achieved 11th consecutive quarter of greater than nine percent
same store merchandise sales growth
2. Integrated Gas
• Equatorial Guinea liquefied natural gas (LNG) Train 1 project remains on schedule having achieved 58
percent completion at the end of the third quarter
“In the third quarter we saw strong operational performance despite interruptions by two major Gulf of Mexico
hurricanes,” said Clarence P. Cazalot, Jr., Marathon president and CEO. “Our upstream and downstream
operations teams responded well to the challenges of the storms, resuming the majority of our oil and gas
production within weeks and all of our refining operations within days of the storms. This quick response
enabled Marathon to continue providing much needed crude oil, natural gas and refined products to the
markets we serve. Our operations outside of the Gulf Coast area continued to perform extremely well
throughout the quarter, and the company continues to make substantial capital investments in all business
segments with more than $2 billion spent through the first nine months of 2005.”
“While these historic storms continue to have a major impact on our industry, they have taken a much greater
toll on the lives of hundreds of thousands of people along the Gulf Coast. Members of the Marathon family
have responded during this crisis by providing humanitarian relief totaling more than $8 million. Thankfully,
all of our employees are accounted for and none were injured,” Cazalot added.
Segment Results
Total segment income was $1.435 billion in third quarter 2005, compared with $760 million in third quarter
2004.
3rd Quarter Ended
September 30
(Dollars in millions) 2005 2004
Segment Income (Loss)
Exploration and Production
United States $397 $244
230 107
International
E&P Segment Income 627 351
Refining, Marketing and Transportation 814 391
(6) 18
Integrated Gas
Segment Income** $1,435 $760
** See Preliminary Supplemental Statistics on page 9 for a reconciliation of segment income to income from operations as
reported under generally accepted accounting principles.
Exploration and Production (Upstream)
Upstream segment income totaled $627 million in third quarter 2005, compared to $351 million in third
quarter 2004. The increase was primarily due to higher liquid hydrocarbon and natural gas prices. Reported
sales volumes during the quarter averaged 291,500 boepd compared to production available for sale of
321,000 boepd. This difference is primarily due to timing of international crude oil liftings in the United
Kingdom and Equatorial Guinea.
United States upstream income was $397 million in third quarter 2005, compared to $244 million in third
quarter 2004. The increase was primarily due to higher liquid hydrocarbon and natural gas prices, partially
Marathon Oil Corporation Reports Third Quarter 2005 Results page 2
3. offset by lower sales volumes. These lower volumes resulted primarily from weather-related downtime in the
Gulf of Mexico and natural field declines in the Permian Basin.
International upstream income was $230 million in third quarter 2005, compared to $107 million in third
quarter 2004. The increase is primarily a result of higher product prices and liquid hydrocarbon sales
volumes, partially offset by higher production taxes in Russia, dry well expenses and lower natural gas
production. The lower gas volumes are primarily the result of reduced UK spot gas sales in the third quarter.
3rd Quarter Ended
September 30
2005 2004
Key Production Statistics
Net Sales
United States – Liquids (mbpd) 70.7 80.7
United States – Gas (mmcfd) 561.8 598.0
International – Liquids (mbpd)* 86.3 75.9
International – Gas (mmcfd) 245.0 303.2
Total Net Sales (mboepd) 291.5 306.8
* Reported volumes are based upon sales volumes which may vary from production available for sale primarily as a result of
the timing of liftings of certain of Marathon’s international liquid hydrocarbon volumes.
Marathon's third quarter production was slightly under guidance despite the loss of 20,000 boepd shut-in due
to the hurricanes in the Gulf of Mexico. Other parts of Marathon’s business continued to generate production
increases, particularly in Equatorial Guinea and Russia. In Equatorial Guinea, Marathon realized the benefits
of strong condensate production and the full ramp-up of the recently completed liquefied petroleum gas (LPG)
expansion project. During the third quarter, total liquids production available for sale in Equatorial Guinea
averaged 45,000 net bpd. In addition, the company continued development activities in the East Kamennoye
field in Russia where Marathon has an ongoing drilling program. These activities have driven total Russian
production available for sale from an average of 14,000 net bpd during third quarter 2004 to 28,000 net bpd
during third quarter 2005.
The cost of storm-related repairs in the Gulf of Mexico is not expected to be significant. Work continues to
restore the remaining operated and non-operated production. Current Gulf of Mexico production is more than
90 percent of pre-storm levels. The restart of remaining oil and gas production is primarily dependent upon
restoration of production from Marathon’s royalty interest at the Shell-operated Ursa platform. Despite the
negative effects of the hurricanes on third quarter production levels, Marathon estimates 2005 average daily
production available for sale to be 340,000 to 350,000 boepd, excluding the impact of any acquisitions or
dispositions.
Marathon continued its exploration success with the Astraea and Hebe discoveries on Block 31 offshore
Angola. Marathon has also participated in an appraisal well on the Gengibre discovery on Angola Block 32,
and results of this well will be released upon partner and government approvals. Marathon’s continued
success offshore Angola has underscored the significant resource potential of this region. Marathon holds a
non-operated 10 percent interest in Block 31 and a non-operated 30 percent interest in Block 32.
In other activity, Marathon is currently participating in an appraisal well on the Plutao discovery on Angola
Block 31, an exploration well on the Mostarda Prospect on Angola Block 32, a deep shelf exploration well on
Marathon Oil Corporation Reports Third Quarter 2005 Results page 3
4. the Aquarius prospect (South Pass 86 block) in the Gulf of Mexico, an exploration well on the Davan prospect
in the United Kingdom, and an appraisal well on the Gudrun discovery offshore Norway.
Refining, Marketing and Transportation (Downstream)
Downstream segment income was $814 million in third quarter 2005 compared to segment income of $391
million in third quarter 2004.
The increase was primarily due to a higher refining and wholesale marketing margin realized in the third
quarter due to the impact that Hurricanes Katrina and Rita had on refined product margins. The extraordinary
performance of employees allowed the Garyville, Louisiana, and Texas City, Texas, refineries to safely return
to operation with a minimum amount of downtime. These refineries sustained minimal damage during these
storms and were able to be brought back on-line within days after the hurricanes, thus allowing the company
to meet the demand for transportation fuels during this period of reduced supply.
While spot market gasoline and distillate prices peaked at all time highs during the third quarter, downstream
prices and realizations were constrained by competitive pricing at the wholesale and retail levels.
Refinery crude runs during the third quarter 2005 averaged 979,600 bpd, with total throughput averaging
1,194,800 bpd. This record throughput was achieved despite the loss of approximately 40,000 bpd of refinery
capacity due to the hurricanes. These rates are lower than what would have been achieved due to the
temporary complete shut-down of the Garyville, Louisiana, and Texas City, Texas, refineries in preparation for
Hurricanes Katrina and Rita, respectively. In addition, the company also experienced minor reductions in
throughputs at some of it’s Midwest refineries due to the temporary closure of crude oil pipelines originating in
the U.S. Gulf Coast after Hurricane Katrina. The repair cost associated with these hurricanes was not
significant.
During the quarter, SSA continued to achieve strong same store merchandise sales which increased
approximately 11 percent compared to the third quarter 2004. This was the 11th consecutive quarter of
greater than nine percent same store merchandise sales growth for SSA. In addition, SSA increased its same
store gasoline sales volume during the third quarter by approximately five percent compared to the same
quarter last year.
3rd Quarter Ended
September 30
2005 2004
Key Refining, Marketing and Transportation Statistics
Crude Oil Refined (mbpd) 979.6 977.1
215.2 146.3
Other Charge and Blend Stocks (mbpd)
Total Refinery Inputs (mbpd) 1,194.8 1,123.4
Refined Product Sales Volumes (mbpd) 1,466.8 1,436.2
Refining and Wholesale Marketing Margin ($/gallon) $0.1774 $0.0900
The company’s $300 million, 26,000 bpd Detroit refinery crude oil throughput expansion and Tier II low sulfur
fuels project is in the final stages of completion. The refinery was shut-down on September 29 to
accommodate the installation and integration of key project components and other related work. The refinery
is expected to restart in mid-November with a total crude processing capacity of 100,000 bpd. The expansion
Marathon Oil Corporation Reports Third Quarter 2005 Results page 4
5. will add much needed capacity to help meet market demand, particularly for transportation fuels, in the upper
Midwest. The expansion also will enable the Detroit refinery to produce the low sulfur gasoline and ultra-low
sulfur diesel fuel required by the U.S. Environmental Protection Agency in 2006.
Integrated Gas
The Integrated Gas segment incurred a loss of $6 million in the third quarter of 2005 compared to $18 million
income in the third quarter of 2004. The decrease was primarily the result of mark-to-market changes in the
fair value of derivatives used to support gas marketing activities.
During the third quarter, the AMPCO methanol plant in Equatorial Guinea realized solid earnings as a result of
a 100 percent on-stream factor and continued strong posted index prices for methanol.
The Equatorial Guinea LNG Train 1 project made continued progress during the quarter and remains on-track
to begin first shipments of LNG in 2007. As of the end of the third quarter, the Train 1 project was
approximately 58 percent complete on an engineering, procurement and construction (EPC) basis and gross
expenditures totaled approximately $1 billion of the total estimated project cost of $1.4 billion. Marathon
holds a 60 percent interest in Equatorial Guinea LNG Holdings Limited (EG Holdings). Also, the Equatorial
Guinea LNG project partners continue to explore the feasibility of adding a second LNG train in an effort to
create a regional gas hub that would commercialize stranded gas from various sources in the surrounding Gulf
of Guinea region.
Special Items
Marathon has two long-term gas sales contracts in the United Kingdom that are accounted for as derivative
instruments. Mark-to-market changes in the valuation of these contracts must be recognized in current
period income. During the third quarter 2005, the non-cash mark-to-market loss on these two long-term gas
sales contracts related to Marathon's Brae gas production totaled $82 million. Due to the volatility in the fair
value of these contracts, Marathon consistently excludes these non-cash gains and losses from “net income
adjusted for special items.”
During the third quarter, Marathon sold an interest in Equatorial Guinea LNG Holdings Limited for a pre-tax
gain of $23 million. Following the closing of the transaction on July 25, 2005, Marathon now holds a 60
percent interest in this company.
The company will conduct a conference call and webcast today, October 27, 2005, at 2 p.m. EDT during which
it will discuss third quarter 2005 results. The webcast will include synchronized slides. To listen to the
webcast of the conference call and view the slides, visit the Marathon Web site at www.marathon.com.
Replays of the webcast will be available through November 10, 2005. Quarterly financial and operational
information is also provided on Marathon’s Web site at
http://www.marathon.com/Investor_Center/Investor_Relations/ in the Quarterly Investor Packet.
- xxx -
Marathon Oil Corporation Reports Third Quarter 2005 Results page 5
6. In addition to net income determined in accordance with generally accepted accounting principles (GAAP),
Marathon has provided supplementally “net income adjusted for special items,” a non-GAAP financial measure
which facilitates comparisons to earnings forecasts prepared by stock analysts and other third parties. Such
forecasts generally exclude the effects of items that are difficult to predict or to measure in advance and are
not directly related to Marathon's ongoing operations. A reconciliation between GAAP net income and “net
income adjusted for special items” is provided in a table on page 1. “Net income adjusted for special items”
should not be considered a substitute for net income as reported in accordance with GAAP.
Management, as well as certain investors, uses “net income adjusted for special items” to evaluate Marathon's
financial performance between periods. Management also uses “net income adjusted for special items” to
compare Marathon's performance to certain competitors.
This release contains forward-looking statements with respect to the timing and levels of the company's
worldwide liquid hydrocarbon and natural gas and condensate production and sales, the possibility of
developing Blocks 31 and 32 offshore Angola, the Detroit refinery expansion project, an LNG project and
possible expansion thereof. Some factors that could potentially affect worldwide liquid hydrocarbon and
natural gas and condensate production and sales, and the possible development of Blocks 31 and 32 include
pricing, supply and demand for petroleum products, amount of capital available for exploration and
development, occurrence of acquisitions/dispositions of oil and gas properties, regulatory constraints, timing
of commencing production from new wells, drilling rig availability, unforeseen hazards such as weather
conditions, acts of war or terrorist acts and the governmental or military response thereto, and other
geological, operating and economic considerations. The possible development of Blocks 31 and 32 could
further be affected by presently known data concerning size and character of reservoirs, economic
recoverability, future drilling success and production experience. Factors that could affect the Detroit refinery
expansion project include availability of materials and labor, unforeseen hazards such as weather conditions,
and other risks customarily associated with construction projects. Factors that could affect the current LNG
project include unforeseen problems arising from construction, inability or delay in obtaining necessary
government and third party approvals, unanticipated changes in market demand or supply, environmental
issues, availability or construction of sufficient LNG vessels, and unforeseen hazards such as weather
conditions. In addition to these factors, other factors that could affect the possible expansion of the current
LNG project and the development of additional LNG capacity through additional projects include partner
approvals, access to sufficient gas volumes through exploration or commercial negotiations with other
resource owners and access to sufficient regasification capacity. The foregoing factors (among others) could
cause actual results to differ materially from those set forth in the forward-looking statements. In accordance
with the quot;safe harborquot; provisions of the Private Securities Litigation Reform Act of 1995, Marathon Oil
Corporation has included in its Annual Report on Form 10-K for the year ended December 31, 2004, and
subsequent Forms 10-Q and 8-K, cautionary language identifying other important factors, though not
necessarily all such factors, that could cause future outcomes to differ materially from those set forth in the
forward-looking statements.
Media Relations Contacts: Paul Weeditz 713-296-3910
Scott Scheffler 713-296-4102
Investor Relations Contacts: Ken Matheny 713-296-4114
Howard Thill 713-296-4140
Marathon Oil Corporation Reports Third Quarter 2005 Results page 6
7. Condensed Consolidated Statements of Income (unaudited)
3rd Quarter Ended Nine Months Ended
September 30
September 30
(Dollars in millions, except per share data) 2005 2004 2005 2004
Revenues and Other Income:
Sales and other operating revenues (including
consumer excise taxes) $13,345 $9,701 $35,271 $27,935
Revenues from matching buy/sell transactions 3,433 2,263 9,807 6,714
Sales to related parties 396 285 1,047 766
Income from equity method investments 69 38 154 108
Net gains on disposal of assets 12 17 46 25
Gain on ownership change in Marathon Petroleum
Company LLC - 1 - 2
Other income (loss), net (7) 11 34 51
Total revenues and other income 17,248 12,316 46,359 35,601
Costs and Expenses:
Cost of revenues (excluding items shown below) 10,833 7,699 27,790 21,676
Purchases related to matching buy/sell transactions 3,038 2,197 9,312 6,588
Purchases from related parties 44 58 163 152
Consumer excise taxes 1,217 1,137 3,511 3,327
Depreciation, depletion and amortization 331 296 993 896
Selling, general and administrative expenses 325 261 853 763
Other taxes 128 80 352 242
Exploration expenses 64 46 135 108
Total costs and expenses 15,980 11,774 43,109 33,752
Income from Operations 1,268 542 3,250 1,849
Net interest and other financing costs 32 40 99 129
Minority interests in income (loss) of:
Marathon Petroleum Company LLC - 148 384 385
Equatorial Guinea LNG Holdings Limited (3) (1) (4) (5)
Income from Continuing Operations before
Income Taxes 1,239 355 2,771 1,340
Provision for income taxes 469 133 1,004 512
Income from Continuing Operations 770 222 1,767 828
Discontinued Operations - - - 4
Net Income $770 $222 $1,767 $832
Income from Continuing Operations
Per share - basic $2.11 $0.64 $5.01 $2.48
Per share - diluted $2.09 $0.64 $4.97 $2.47
Net Income
Per share - basic $2.11 $0.64 $5.01 $2.49
Per share - diluted $2.09 $0.64 $4.97 $2.48
Dividends Paid Per Share $0.33 $0.25 $0.89 $0.75
Weighted Average Shares (in thousands)
Basic 365,137 345,037 352,807 333,456
Diluted 368,564 346,969 355,726 335,169
Marathon Oil Corporation Reports Third Quarter 2005 Results page 7
8. Selected Notes to Financial Statement (unaudited)
1. On June 30, 2005, Marathon acquired the 38 percent ownership interest in Marathon Ashland
Petroleum LLC (MAP) previously held by Ashland Inc. In addition, Marathon acquired a portion of
Ashland’s Valvoline Instant Oil Change business and its maleic anhydride business. As a result,
MAP is now wholly owned by Marathon. On September 1, 2005, subsequent to the acquisition,
Marathon Ashland Petroleum LLC changed its name to Marathon Petroleum Company LLC. In this
press release, references to Marathon Petroleum Company LLC (“MPC”) are references to the entity
formerly known as Marathon Ashland Petroleum LLC.
The acquisition was accounted for under the purchase method of accounting. The total
consideration, including debt assumed, is as follows:
(In millions)
______________________________________________________________________________________
Cash (a) $ 487
Receivables (a) 913
Common stock (b) 955
Assumption of debt (c) 1,920
Estimated additional consideration related to tax matters (d) 44
Transaction-related costs 10
______
Total consideration including debt assumption $4,329
______________________________________________________________________________________________________________
(a)
Includes $509 million of cash and receivables representing Ashland’s 38 percent of MPC’s estimated
distributable cash as of June 30, 2005
(b)
Ashland shareholders received 17.539 million shares valued at $54.45 per share
(c)
Assumed debt was repaid on July 1, 2005
(d)
Includes $9 million paid during the quarter ended September 30, 2005, for tax obligations of Ashland under
Internal Revenue Service Code Section 355(e)
Marathon Oil Corporation Reports Third Quarter 2005 Results page 8
9. Preliminary Supplemental Statistics (unaudited)
3rd Quarter Ended Nine Months Ended
September 30
September 30
(Dollars in millions, except as noted) 2005 2004 2005 2004
Income from Operations
Exploration and Production
United States $397 $244 $1,096 $835
International 230 107 862 418
E&P Segment Income 627 351 1,958 1,253
Refining, Marketing and Transportation(a) 814 391 1,847 1,017
Integrated Gas(b) (6) 18 12 25
Segment Income 1,435 760 3,817 2,295
Items not allocated to segments:
Administrative expenses (108) (90) (284) (238)
Loss on U.K. long-term gas contracts (82) (129) (306) (210)
Gain on ownership change - MPC - 1 - 2
Gain on sale of minority interests in EG Holdings 23 - 23 -
Income from Operations $1,268 $542 $3,250 $1,849
Capital Expenditures
Exploration and Production $385 $249 $998 $601
Refining, Marketing and Transportation(a) 203 146 500 419
Integrated Gas(b) 205 58 513 346
Corporate 1 5 4 11
Total $794 $458 $2,015 $1,377
Exploration Expense
United States $18 $15 $60 $47
International 46 31 75 61
Total $64 $46 $135 $108
Operating Statistics
Net Liquid Hydrocarbon Sales (mbpd)(c)
United States 70.7 80.7 75.9 86.6
Europe 11.3 31.4 30.4 39.1
West Africa 48.0 29.2 48.3 31.3
Other International 27.0 15.3 25.1 15.8
Total International 86.3 75.9 103.8 86.2
Worldwide 157.0 156.6 179.7 172.8
Net Natural Gas Sales (mmcfd)(c)(d)
United States 561.8 598.0 570.4 646.6
Europe 158.7 225.8 244.4 278.9
West Africa 86.3 77.4 92.7 74.9
Total International 245.0 303.2 337.1 353.8
Worldwide 806.8 901.2 907.5 1,000.4
Total Net Sales (mboepd) 291.5 306.8 331.0 339.5
Marathon Oil Corporation Reports Third Quarter 2005 Results page 9
10. Preliminary Supplemental Statistics (unaudited) (continued)
3rd Quarter Ended Nine Months Ended
September 30
September 30
(Dollars in millions, except as noted) 2005 2004 2005 2004
Operating Statistics (continued)
Average Sales Prices (excluding derivative gains and losses)
Liquid Hydrocarbons ($ per bbl)
United States $52.38 $35.56 $44.24 $32.23
Europe 61.44 41.37 49.73 35.12
West Africa 50.45 38.82 47.03 33.11
Other International 38.78 24.89 32.98 20.88
Total International 48.24 37.07 44.42 31.78
Worldwide $50.10 $36.29 $44.34 $32.00
Natural Gas ($ per mcf)
United States $6.56 $4.76 $5.76 $4.83
Europe 4.69 3.66 4.90 3.92
West Africa 0.25 0.25 0.25 0.25
Total International 3.12 2.79 3.62 3.15
Worldwide $5.52 $4.10 $4.96 $4.23
Average Sales Prices (including derivative gains and losses)
Liquid Hydrocarbons ($ per bbl)
United States $52.38 $28.58 $44.24 $28.58
Europe 61.44 35.37 49.73 32.31
West Africa 50.45 38.82 47.03 33.11
Other International 38.78 24.89 32.98 20.84
Total International 48.24 34.59 44.42 30.49
Worldwide $50.10 $31.49 $44.34 $29.53
Natural Gas ($ per mcf)
United States $6.37 $4.65 $5.68 $4.77
Europe(e) 4.69 3.66 4.90 3.92
West Africa 0.25 0.25 0.25 0.25
Total International 3.12 2.79 3.62 3.15
Worldwide $5.38 $4.02 $4.92 $4.19
Marathon Oil Corporation Reports Third Quarter 2005 Results page 10
11. Preliminary Supplemental Statistics (unaudited) (continued)
3rd Quarter Ended Nine Months Ended
September 30
September 30
(Dollars in millions, except as noted) 2005 2004 2005 2004
Operating Statistics (continued)
Refinery Runs (mbpd)
Crude Oil Refined 979.6 977.1 971.4 926.6
215.2 146.3 187.2 161.4
Other Charge and Blend Stocks
Total 1,194.8 1,123.4 1,158.6 1,088.0
Refined Product Yields (mbpd)
Gasoline 658.1 610.3 623.7 595.2
Distillates 325.4 311.7 314.9 290.0
Propane 22.3 22.6 21.6 21.7
Feedstocks and Special Products 88.8 88.6 100.8 97.3
Heavy Fuel Oil 21.0 19.3 24.4 22.1
90.2 85.5 86.6 75.8
Asphalt
Total 1,205.8 1,138.0 1,172.0 1,102.1
Refined Product Sales Volumes (mbpd)(f) 1,466.8 1,436.2 1,438.2 1,394.7
Matching buy/sell volumes included in refined
product sales volumes (mbpd) 66.4 83.5 77.8 79.1
(g)(h)
Refining and Wholesale Marketing Margin $0.1774 $0.0900 $0.1369 $0.0849
Speedway SuperAmerica LLC
Number of SSA Retail Outlets 1,638 1,685
SSA Gasoline and Distillate Sales(i) 825 794 2,392 2,358
SSA Gasoline and Distillate Gross Margin(g) $0.1232 $0.1185 $0.1170 $0.1175
SSA Merchandise Sales $689 $632 $1,894 $1,754
SSA Merchandise Gross Margin $162 $154 $468 $426
(a)
RM&T segment income includes Ashland’s 38 percent interest in MPC of $149 million in the third quarter of 2004, $390 million
and $389 million for the first nine months of 2005 and 2004, respectively.
(b)
Includes EG Holdings at 100 percent.
(c)
Amounts reflect sales after royalties, except for Ireland where amounts are before royalties.
(d)
Includes gas acquired for injection and subsequent resale of 58.9 and 14.4 mmcfd for the third quarter of 2005 and 2004 and
34.1 and 19.9 mmcfd for the first nine months of 2005 and 2004. Effective July 1, 2005, the methodology for allocating sales
volumes between gas produced from the Brae complex and third-party gas production was modified, resulting in an increase in
volumes representing gas acquired for injection and subsequent resale.
(e)
Excludes the effects of the U.K. long-term gas contracts that are accounted for as derivatives.
(f)
Total average daily volumes of all refined product sales to wholesale, branded and retail (SSA) customers.
(g)
Dollars per gallon.
(h)
Sales revenue less cost of refinery inputs, purchased products and manufacturing expenses, including depreciation.
(i)
Millions of gallons.
Marathon Oil Corporation Reports Third Quarter 2005 Results page 11