Booking open Available Pune Call Girls Wadgaon Sheri 6297143586 Call Hot Ind...
marathon oil 3rd Quarter 2006
1. MARATHON OIL CORPORATION REPORTS THIRD QUARTER 2006
FINANCIAL RESULTS
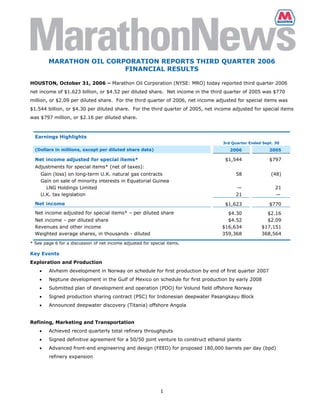
HOUSTON, October 31, 2006 – Marathon Oil Corporation (NYSE: MRO) today reported third quarter 2006
net income of $1.623 billion, or $4.52 per diluted share. Net income in the third quarter of 2005 was $770
million, or $2.09 per diluted share. For the third quarter of 2006, net income adjusted for special items was
$1.544 billion, or $4.30 per diluted share. For the third quarter of 2005, net income adjusted for special items
was $797 million, or $2.16 per diluted share.
Earnings Highlights
3rd Quarter Ended Sept. 30
(Dollars in millions, except per diluted share data) 2006 2005
Net income adjusted for special items* $1,544 $797
Adjustments for special items* (net of taxes):
Gain (loss) on long-term U.K. natural gas contracts 58 (48)
Gain on sale of minority interests in Equatorial Guinea
LNG Holdings Limited — 21
U.K. tax legislation 21 —
Net income $1,623 $770
Net income adjusted for special items* – per diluted share $4.30 $2.16
Net income – per diluted share $4.52 $2.09
Revenues and other income $16,634 $17,151
Weighted average shares, in thousands - diluted 359,368 368,564
* See page 6 for a discussion of net income adjusted for special items.
Key Events
Exploration and Production
• Alvheim development in Norway on schedule for first production by end of first quarter 2007
• Neptune development in the Gulf of Mexico on schedule for first production by early 2008
• Submitted plan of development and operation (PDO) for Volund field offshore Norway
• Signed production sharing contract (PSC) for Indonesian deepwater Pasangkayu Block
• Announced deepwater discovery (Titania) offshore Angola
Refining, Marketing and Transportation
• Achieved record quarterly total refinery throughputs
• Signed definitive agreement for a 50/50 joint venture to construct ethanol plants
• Advanced front-end engineering and design (FEED) for proposed 180,000 barrels per day (bpd)
refinery expansion
1
2. Integrated Gas
• Equatorial Guinea LNG Train 1 project 95 percent complete, first shipment expected in mid-2007
• Awarded FEED contract to evaluate possible second LNG train in Equatorial Guinea
Corporate
• Repurchased 14.4 million common shares at a cost of $1.146 billion, as of the third quarter 2006
• Achieved dramatic results from Bioko Island Malaria Control Project in Equatorial Guinea
“We had a very strong quarter operationally, as well as financially. Our upstream and downstream businesses
both performed exceptionally well with the downstream business turning in another record setting
performance in refinery throughputs while the upstream delivered a strong production performance,” said
Clarence P. Cazalot, Jr., Marathon president and CEO. “Additionally, we benefited from strong commodity
prices, particularly realized liquids prices in the upstream, and the refining and wholesale margin in the
refining business. This strong performance has allowed us to significantly reinvest in value-creating projects
around the world while maintaining a strong balance sheet. Marathon’s capital spending is up 38 percent
when compared to the same quarter last year and our major projects are progressing on schedule and will
start providing profitable growth in 2007. This illustrates our continued investment in growth opportunities
designed to meet the energy needs of our customers while creating long-term shareholder value.”
Segment Results
Effective January 1, 2006, Marathon revised its measure of segment income to reflect the effects of minority
interests and income taxes related to the segments. In addition, the results of activities primarily associated
with the marketing of the Company’s equity natural gas production, which had been presented as part of the
Integrated Gas segment prior to 2006, are now included in the Exploration and Production segment. Segment
information for all periods presented in this release reflects these changes.
Total segment income was $1.596 billion in the third quarter of 2006, compared with $868 million in the third
quarter 2005.
3rd Quarter Ended Sept. 30
(Dollars in millions) 2006 2005
Segment Income
Exploration & Production (E&P)
United States $218 $247
354 126
International
Total E&P 572 373
Refining, Marketing & Transportation 1,026 473
(2) 22
Integrated Gas
Segment Income ** $1,596 $868
** See Preliminary Supplemental Statistics on page 10 for a reconciliation of segment income to net income as reported
under generally accepted accounting principles.
2
3. Exploration and Production
Upstream segment income totaled $572 million in the third quarter of 2006, compared to $373 million in the
third quarter of 2005. The increase was primarily due to higher liquid hydrocarbon sales prices and volumes,
partially offset by higher income taxes.
Reported sales volumes during the quarter averaged 362,000 barrels of oil equivalent per day (boepd)
compared to production available for sale of 354,000 boepd. The largest sales volume increase for the period
was in Libya, where the first crude oil sales occurred in the first quarter of 2006 and where sales volumes
totaled 79,000 boepd for the third quarter of 2006. Included in these sales volumes for the quarter were 2.8
million barrels of oil, or 30,000 boepd, produced and sold during the quarter that had been owed to the
Company’s account upon its resumption of operations.
Marathon estimates 2006 average daily production available for sale to be 360,000 to 370,000 boepd, with
fourth quarter production available for sale estimated to be 350,000 to 370,000 boepd. These estimates
exclude the Company’s former Russian operations, which are reported as discontinued operations, and
exclude the impact of any future acquisitions or dispositions.
United States upstream income was $218 million in the third quarter of 2006, compared to $247 million in the
third quarter of 2005, primarily as a result of lower natural gas prices and sales volumes partially offset by
higher liquid hydrocarbon prices.
International upstream income was $354 million in the third quarter of 2006, compared to $126 million in the
third quarter of 2005. The increase was primarily a result of higher liquid hydrocarbon sales volumes due to
the resumption of production in Libya and higher hydrocarbon prices. This increase was partially offset by
higher international income taxes, higher operating costs, and increased depreciation, depletion and
amortization (DD&A) due to higher sales volumes in Libya, the United Kingdom and Equatorial Guinea.
3rd Quarter Ended Sept. 30
2006 2005
Key Production Statistics
Net Sales
United States – Liquids (mbpd) 72 71
United States – Gas (mmcfpd) 522 562
International – Liquids (mbpd) 170 59
International – Gas (mmcfpd) 197 245
Net Sales from Continuing Operations (mboepd) 362 264
– 27
Discontinued Operations (mboepd)
362 291
Total Net Sales (mboepd)
Throughout the third quarter of 2006, Marathon continued to advance its major projects including the Alvheim
development offshore Norway. At the end of the third quarter of 2006, the project was 73 percent complete
and on target to deliver first production by the end of the first quarter of 2007. All subsea equipment is in
place and hydrotesting has commenced. Module installations on the floating production, storage and
offloading (FPSO) vessel have been completed and work is progressing with the integration of the new
3
4. equipment with the existing hull systems. Marathon holds a 65 percent interest in Alvheim and serves as
operator.
Also in Norway, Marathon submitted the PDO for the Volund development during the third quarter of 2006.
Government approval is expected by the end of November 2006. Volund will consist of subsea completions
which will be tied-back to Alvheim. Marathon holds a 65 percent interest in Volund.
The Neptune development in the Gulf of Mexico was 55 percent complete at the end of the third quarter of
2006. Development drilling continued throughout the quarter and will continue through first oil. Marathon
holds a 30 percent interest in Neptune which remains on target to deliver first production by early 2008.
Marathon signed a PSC with the Government of Indonesia during the third quarter of 2006. The Company
was awarded a 70 percent interest and operatorship in the Pasangkayu Block offshore Indonesia as part of
Indonesia's 2005 Regular Tender. Current exploration plans call for collection of geophysical data in 2007,
followed by drilling in 2008 and 2009.
Marathon is currently participating in three deepwater wells in Angola. The Company recently announced the
Titania discovery in Angola Block 31. The Titania discovery is located in the central part of Block 31 and
reinforces the potential for multiple developments on this block. Two additional wells have reached total
depth in deepwater Angola and their results will be announced upon government and partner approvals.
Marathon holds a 10 percent interest in Angola Block 31 and a 30 percent interest in Angola Block 32. In the
Gulf of Mexico, Marathon is currently drilling the Blackwater prospect in Green Canyon Block 246 in which it
holds a 40 percent working interest and serves as operator.
Refining, Marketing and Transportation
Downstream segment income was $1.026 billion in the third quarter of 2006, compared to $473 million in the
third quarter of 2005.
The key driver of the increase in segment income was the Company’s refining and wholesale marketing gross
margin which averaged 32.71 cents per gallon in the third quarter of 2006 versus 17.74 cents in the
comparable 2005 quarter. While the average WTI 6-3-2-1 crack spreads declined in the Midwest (Chicago)
and Gulf Coast markets in the third quarter of 2006 compared to the third quarter of 2005, the Company’s
average refined product sales realizations achieved during the third quarter of 2006 increased more than the
refined product spot market prices when compared to the third quarter of 2005. In addition, the refining and
wholesale marketing gross margin was enhanced by favorable realizations in the Company’s ethanol blending
program. The Company’s refining and wholesale marketing gross margins included a pretax gain of $384
million in the third quarter of 2006 and a pretax loss of $271 million in the third quarter of 2005 related to
derivatives that are utilized primarily to manage price risk.
Crude oil refined during the third quarter of 2006 averaged 1,031,000 barrels per day (bpd), 51,000 bpd
higher than during the third quarter of 2005. In addition, total refinery throughputs averaged a record
1,249,000 bpd for the third quarter of 2006, 4.5 percent higher than the 1,195,000 bpd during the third
quarter of 2005. Marathon was able to achieve this throughput record primarily as a result of the expansion
of its Detroit refinery from 74,000 to 100,000 bpd that was completed during the fourth quarter of 2005.
4
5. Speedway SuperAmerica’s (SSA) gasoline and distillate gross margin averaged 14.10 cents per gallon during
the third quarter of 2006, up from the 12.32 cents per gallon realized in the third quarter of 2005. SSA’s
same store merchandise sales increased 6.7 percent during the same period.
3rd Quarter Ended Sept. 30
2006 2005
Key Refining, Marketing & Transportation Statistics
Crude Oil Refined (mbpd) 1,031 980
218 215
Other Charge and Blend Stocks (mbpd)
Total Refinery Inputs (mbpd) 1,249 1,195
Refined Product Sales Volumes (mbpd)*** 1,434 1,467
Refining and Wholesale Marketing Gross Margin
($/gallon)*** $0.3271 $0.1774
***On April 1, 2006, Marathon changed its accounting for matching buy/sell arrangements as a result of a new accounting
standard. This change resulted in lower refined product sales volumes and a higher refining and wholesale marketing gross
margin in subsequent periods of 2006 than would have been reported under the previous accounting practices. See
Selected Notes to Consolidated Financial Statements on page 9.
Marathon and its partner, The Andersons Inc., recently announced that the companies have signed a definitive
agreement forming a 50/50 joint venture, which will construct one or more ethanol plants. As a part of the
agreement, The Andersons Inc. will provide day-to-day management of the ethanol plants, as well as corn
origination, and distillers dried grain and ethanol marketing services. Marathon is one of the nation's leading
blenders of ethanol in gasoline and this venture will enable the Company to maintain the reliability of future
ethanol supplies. Site selection for the venture's initial plant is expected to be finalized soon and is contingent
upon several factors including access to adequate corn supply, proximity to ethanol and distillers dried grain
customers, infrastructure and transportation. Decisions related to the construction of any additional ethanol
plants will be dependent upon a variety of market conditions and other relevant factors.
Marathon continues to work on the FEED for the proposed 180,000 bpd expansion of its Garyville, La.,
refinery. The Company expects a final investment decision and permitting to be complete by year-end.
Marathon’s expenditure commitments for the Garyville expansion project in 2006 will total approximately
$170 million including both FEED costs and the procurement of certain long-lead time process unit
components.
Integrated Gas
The Integrated Gas segment reported a loss of $2 million in the third quarter of 2006, compared to income of
$22 million in the third quarter of 2005. Income from the Company’s equity method investment in Atlantic
Methanol Production Company LLC (AMPCO) was down partially due to a compressor repair which resulted in a
shut-down of the plant for part of the quarter.
The Equatorial Guinea LNG Train 1 project remains ahead of schedule with LNG shipments expected to start in
mid-2007. At the end of the third quarter of 2006, the project was approximately 95 percent complete.
Marathon holds a 60 percent interest in Equatorial Guinea LNG Holdings Limited.
Marathon and its partners have awarded a FEED contract to Bechtel for work related to a potential second LNG
train in Equatorial Guinea. The FEED work is expected to be completed by the end of the first quarter of 2007.
5
6. Corporate
In January 2006, Marathon announced a $2 billion share repurchase plan. During the first nine months of
2006, Marathon has repurchased approximately 14.4 million of its common shares at a cost of $1.146 billion.
Marathon currently anticipates repurchasing $1.5 billion of its common stock by December 31, 2006, with the
balance of the $2 billion authorized program to be completed in 2007. This program may be changed based
on the Company's financial condition or changes in market conditions and is subject to termination prior to
completion.
Marathon and its project partners have achieved dramatic results during the second year of the five-year,
approximately $13 million Bioko Island Malaria Control Project (BIMCP) in Equatorial Guinea. Year two results
include a 95 percent reduction in malaria transmitting mosquitoes and a 44 percent reduction in the presence
of malaria parasites in children. These results further demonstrate that the BIMCP is steadily eradicating the
transmission of a disease that poses the most significant health threat to the citizens of Equatorial Guinea.
Special Items
Marathon has two long-term natural gas sales contracts in the United Kingdom that are accounted for as
derivative instruments. Mark-to-market changes in the valuation of these contracts must be recognized in
current period income. During the third quarter of 2006, the non-cash after-tax mark-to-market gain on these
two long-term natural gas sales contracts related to Marathon's Brae natural gas production totaled $58
million. Due to the volatility in the fair value of these contracts, Marathon excludes these non-cash gains and
losses from “net income adjusted for special items.”
In July 2006, the U.K. supplemental corporation tax rate was increased from 10 percent to 20 percent
effective January 1, 2006. The $21 million impact of this tax rate change on the applicable net deferred tax
assets as of January 1, 2006 has been excluded from “net income adjusted for special items.”
The Company will conduct a conference call and webcast today, October 31, 2006, at 2 p.m. EST during which
it will discuss third quarter 2006 results. The webcast will include synchronized slides. To listen to the
webcast of the conference call and view the slides, visit the Marathon Web site at www.marathon.com.
Replays of the webcast will be available through November 14, 2006. Quarterly financial and operational
information is also provided on Marathon’s Web site at
http://www.marathon.com/Investor_Center/Investor_Relations/ in the Quarterly Investor Packet.
###
In addition to net income determined in accordance with generally accepted accounting principles, Marathon
has provided supplementally “net income adjusted for special items,” a non-GAAP financial measure which
facilitates comparisons to earnings forecasts prepared by stock analysts and other third parties. Such
forecasts generally exclude the effects of items that are considered non-recurring, are difficult to predict or to
measure in advance or that are not directly related to Marathon's ongoing operations. A reconciliation between
GAAP net income and “net income adjusted for special items” is provided in a table on page 1 of this release.
“Net income adjusted for special items” should not be considered a substitute for net income as reported in
accordance with GAAP. Management, as well as certain investors, uses “net income adjusted for special items”
to evaluate Marathon's financial performance between periods. Management also uses “net income adjusted
for special items” to compare Marathon's performance to certain competitors.
This release contains forward-looking statements with respect to the timing and levels of the Company's
worldwide liquid hydrocarbon and natural gas and condensate production and sales, the development of the
6
7. Alvheim and Volund fields, the Neptune development, potential developments in Angola, anticipated future
exploratory and development drilling activity, in Indonesia and other locations, a joint venture that would
construct and operate ethanol plants, the Garyville expansion project, an LNG project in Equatorial Guinea and
possible expansion thereof, and the common stock repurchase program. Some factors that could potentially
affect worldwide liquid hydrocarbon and natural gas and condensate production and sales, the development of
Alvheim, Volund and Neptune, potential developments in Angola, and anticipated future exploratory and
drilling activity include pricing, supply and demand for petroleum products, amount of capital available for
exploration and development, regulatory constraints, inability or delay in obtaining government and third-
party approvals and permits, timing of commencing production from new wells, drilling rig availability,
unforeseen hazards such as weather conditions, acts of war or terrorist acts and the governmental or military
response thereto, and other geological, operating and economic considerations. Worldwide production and
sales could also be affected by the occurrence of acquisitions or dispositions of oil and gas properties. Factors
that could affect ethanol plant construction, management and development, and the proposed Garyville
expansion project include transportation logistics, availability of materials and labor, unforeseen hazards such
as weather conditions, necessary government and third-party approvals, and other risks customarily
associated with construction projects. The proposed Garyville project may be further affected by crude oil
supply. Factors that could affect the LNG project include unforeseen problems arising from construction,
inability or delay in obtaining necessary government and third-party approvals, unanticipated changes in
market demand or supply, environmental issues, availability or construction of sufficient LNG vessels, and
unforeseen hazards such as weather conditions. In addition to these factors, other factors that could
potentially affect the possible expansion of the LNG project and the development of additional LNG capacity
through additional projects include partner approvals, access to sufficient natural gas volumes through
exploration or commercial negotiations with other resource owners and access to sufficient regasification
capacity. The common stock repurchase program could be affected by changes in prices of and demand for
crude oil, natural gas and refined products, actions of competitors, disruptions or interruptions of the
Company’s production or refining operations due to unforeseen hazards such as weather conditions or acts of
war or terrorist acts, and other operating and economic considerations. The foregoing factors (among others)
could cause actual results to differ materially from those set forth in the forward-looking statements. In
accordance with the quot;safe harborquot; provisions of the Private Securities Litigation Reform Act of 1995, Marathon
Oil Corporation has included in its Annual Report on Form 10-K for the year ended December 31, 2005, and
subsequent Forms 10-Q and 8-K, cautionary language identifying other important factors, though not
necessarily all such factors, that could cause future outcomes to differ materially from those set forth in the
forward-looking statements.
Media Relations Contacts: Paul Weeditz 713-296-3910
Scott Scheffler 713-296-4102
Investor Relations Contacts: Ken Matheny 713-296-4114
Howard Thill 713-296-4140
7
8. Condensed Consolidated Statements of Income (Unaudited)
3rd Quarter Ended Nine Months Ended
September 30 September 30
(Dollars in millions, except per share data) 2006 2005 2006 2005
Revenues and Other Income:
Sales and other operating revenues (including
$15,837 $13,248 $44,699 $35,044
consumer excise taxes)
Revenues from matching buy/sell transactions 237 3,433 5,249 9,807
Sales to related parties 418 396 1,141 1,047
Income from equity method investments 109 69 298 153
Net gains on disposal of assets 12 12 28 46
Other income (loss), net 21 (7) 48 33
Total revenues and other income 16,634 17,151 51,463 46,130
Costs and Expenses:
Cost of revenues (excludes items below) 11,260 10,825 32,647 27,761
Purchases related to matching buy/sell transactions 222 3,038 5,205 9,312
Purchases from related parties 61 44 159 163
Consumer excise taxes 1,297 1,217 3,739 3,511
Depreciation, depletion and amortization 361 319 1,130 950
Selling, general and administrative expenses 300 324 895 851
Other taxes 92 84 280 241
Exploration expenses 97 64 234 130
Total costs and expenses 13,690 15,915 44,289 42,919
Income from Operations 2,944 1,236 7,174 3,211
Net interest and other financing costs (income) (7) 31 7 99
Minority interests in income (loss) of:
Marathon Petroleum Company LLC — — — 384
Equatorial Guinea LNG Holdings Limited (2) (3) (7) (4)
Income from Continuing Operations before
Income Taxes 2,953 1,208 7,174 2,732
Provision for income taxes 1,330 458 3,296 991
Income from Continuing Operations 1,623 750 3,878 1,741
Discontinued operations — 20 277 26
Net Income $1,623 $770 $4,155 $1,767
Income from Continuing Operations
Per share - basic $4.55 $2.05 $10.75 $4.94
Per share – diluted $4.52 $2.03 $10.66 $4.90
Net Income
Per share - basic $4.55 $2.11 $11.52 $5.01
Per share – diluted $4.52 $2.09 $11.42 $4.97
Dividends paid per share $0.40 $0.33 $1.13 $0.89
Weighted average shares, in thousands
Basic 356,330 365,137 360,710 352,807
Diluted 359,368 368,564 363,938 355,726
8
9. Selected Notes to Financial Statements (Unaudited)
1. On April 1, 2006, Marathon changed its accounting for matching buy/sell arrangements that are entered
into or modified on or after April 1, 2006 as a result of a new accounting standard. In a typical matching
buy/sell transaction, Marathon enters into a contract to sell a particular grade of crude oil or refined
product at a specified location and date to a particular counterparty and simultaneously agrees to buy a
particular grade of the same commodity at a specified location on the same or another specified date from
the same counterparty. Prior to this change in accounting, Marathon recorded such matching buy/sell
transactions in both revenues and cost of revenues as separate sales and purchase transactions. Upon
adoption, these transactions are accounted for as exchanges of inventory. Transactions arising from
matching buy/sell arrangements entered into before April 1, 2006 will continue to be reported as separate
sales and purchase transactions.
This change in accounting will not have an effect on net income. However, the amount of revenues
recognized subsequent to adoption will be less than the amount that would have been recognized under
previous accounting practices. Cost of revenues will decrease by an amount equal to the decrease in
revenues.
9
10. Preliminary Supplemental Statistics (Unaudited)
3rd Quarter Ended Nine Months Ended
September 30 September 30
2006 2005
(Dollars in millions, except as noted) 2006 2005
Segment Income (Loss)
Exploration & Production
United States $218 $247 $706 $682
354 126 990 529
International
Total E&P 572 373 1,696 1,211
Refining, Marketing & Transportation 1,026 473 2,262 863
(2) 22 23 44
Integrated Gas
Segment Income 1,596 868 3,981 2,118
Items not allocated to segments, net of taxes:
Corporate and other unallocated items (52) (91) (217) (235)
Gain (loss) on long-term U.K. natural gas contracts 58 (48) 93 (178)
Gain on sale of minority interests in EG Holdings — 21 — 21
Ohio tax legislation — — — 15
U.K. tax legislation 21 — 21 —
— 20 277 26
Discontinued operations
Net Income $1,623 $770 $4,155 $1,767
Capital Expenditures
Exploration & Production $795 $361 $1,616 $927
Refining, Marketing & Transportation(a) 223 206 527 508
Integrated Gas(b) 72 205 236 513
Discontinued Operations — 26 45 73
7 1 26 4
Corporate
Total $1,097 $799 $2,450 $2,025
Exploration Expense
United States $40 $18 $109 $60
57 46 125 70
International
Total $97 $64 $234 $130
10
11. Preliminary Supplemental Statistics (Unaudited) (continued)
3rd Quarter Ended Nine Months Ended
September 30 September 30
2006 2005 2006 2005
Operating Statistics
Net Liquid Hydrocarbon Sales (mbpd)(c)
United States 72 71 77 76
Europe 29 11 35 31
141 48 116 48
Africa
170 59 151 79
Total International
242 130 228 155
Worldwide Continuing Operations
– 27 16 25
Discontinued operations
242 157 244 180
Worldwide
Net Natural Gas Sales (mmcfd)(c)(d)
United States 522 562 536 570
Europe 141 159 237 244
56 86 65 93
Africa
197 245 302 337
Total International
719 807 838 907
Worldwide
Net Sales from Continuing Operations (mboepd) 362 264 368 306
– 27 16 25
Net Sales from Discontinued Operations (mboepd)
362 291 384 331
Total Net Sales (mboepd)
Average Realizations (e)
Liquid Hydrocarbons ($ per net bbl)
United States $60.37 $52.38 $56.38 $44.24
Europe 66.19 61.44 65.64 49.73
Africa 63.64 50.45 61.71 47.03
Total International 64.07 52.53 62.63 48.07
Worldwide Continuing Operations 62.96 52.45 60.51 46.19
Discontinued operations – 38.78 38.38 32.98
Worldwide $62.96 $50.10 $59.02 $44.34
Natural Gas ($ per net mcf)
United States $5.62 $6.56 $5.89 $5.76
Europe 5.65 4.69 6.83 4.90
Africa 0.24 0.25 0.25 0.25
Total International 4.10 3.12 5.41 3.62
Worldwide $5.21 $5.52 $5.72 $4.96
11
12. Preliminary Supplemental Statistics (Unaudited) (continued)
3rd Quarter Ended Nine Months Ended
September 30 September 30
(Dollars in millions, except as noted) 2006 2005 2006 2005
Refinery Runs (mbpd)
Crude Oil Refined 1,031 980 989 972
218 215 225 187
Other Charge and Blend Stocks
Total 1,249 1,195 1,214 1,159
Refined Product Yields (mbpd)
Gasoline 655 658 655 624
Distillates 336 326 316 315
Propane 24 22 23 21
Feedstocks and Special Products 121 89 118 101
Heavy Fuel Oil 21 21 23 24
106 90 94 87
Asphalt
Total 1,263 1,206 1,229 1,172
(f)(g)
Refined Product Sales Volumes (mbpd) 1,434 1,467 1,437 1,438
Matching buy/sell volumes included in refined
product sales volumes (mbpd) (g) 2 66 32 78
Refining and Wholesale Marketing
Gross Margin ($/gallon)(h) $0.3271 $0.1774 $0.2478 $0.1369
Speedway SuperAmerica LLC
Number of SSA retail outlets 1,635 1,638 — —
SSA Gasoline and Distillate Sales(i) 867 825 2,459 2,392
SSA Gasoline and Distillate Gross
Margin ($/gallon) $0.1410 $0.1232 $0.1168 $0.1170
SSA Merchandise Sales $729 $689 $2,029 $1,894
SSA Merchandise Gross Margin $178 $162 $497 $468
(a)
Includes MPC at 100 percent.
(b)
Includes Equatorial Guinea LNG Holdings at 100 percent.
(c)
Amounts represent net sales after royalties, except for Ireland where amounts are before royalties.
(d)
Includes natural gas acquired for injection and subsequent resale of 36 mmcfd and 59 mmcfd in the third quarters of 2006 and
2005, and 45 mmcfd and 34 mmcfd for the first nine months of 2006 and 2005. Effective July 1, 2005, the methodology for
allocating sales volumes between natural gas produced from the Brae complex and third-party natural gas production was
modified, resulting in an increase in volumes representing natural gas acquired for injection and subsequent resale.
(e)
Excludes gains and losses on traditional derivative instruments and the unrealized effects of long-term U.K. natural gas contracts
that are accounted for as derivatives.
(f)
Total average daily volumes of all refined product sales to wholesale, branded and retail (SSA) customers.
(g)
As a result of the change in accounting for matching buy/sell arrangements on April 1, 2006, the reported sales volumes will be
lower than the volumes determined under the previous accounting practices. See Selected Notes to Consolidated Financial
Statements on page 9.
(h)
Sales revenue less cost of refinery inputs, purchased products and manufacturing expenses, including depreciation. As a result
of the change in accounting for matching buy/sell transactions on April 1, 2006, the resulting per gallon statistic will be higher
than the statistic that would have been calculated from amounts determined under previous accounting practices. See Selected
Notes to Consolidated Financial Statements on page 9.
(i)
Millions of gallons.
12