Mira Road Awesome 100% Independent Call Girls NUmber-9833754194-Dahisar Inter...
marathon oil 4th Quarter 2006
1. MARATHON OIL CORPORATION REPORTS FOURTH QUARTER
AND FULL-YEAR 2006 RESULTS
HOUSTON, February 1, 2007 – Marathon Oil Corporation (NYSE: MRO) today reported fourth quarter 2006
net income of $1.079 billion, or $3.06 per diluted share. Net income in the fourth quarter of 2005 was $1.265
billion, or $3.43 per diluted share. For the fourth quarter of 2006, net income adjusted for special items was
$838 million, or $2.38 per diluted share, compared to net income adjusted for special items of $1.329 billion,
or $3.61 per diluted share, for the fourth quarter of 2005.
Marathon reported 2006 net income of $5.234 billion, or $14.50 per diluted share. Net income in 2005 was
$3.032 billion, or $8.44 per diluted share. Marathon reported 2006 net income adjusted for special items of
$4.636 billion, or $12.84 per diluted share, compared to net income adjusted for special items of $3.238
billion, or $9.02 per diluted share, for 2005.
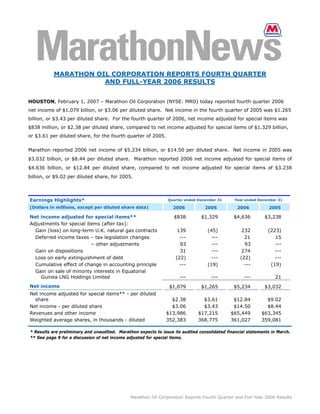
Earnings Highlights* Quarter ended December 31 Year ended December 31
(Dollars in millions, except per diluted share data) 2006 2005 2006 2005
Net income adjusted for special items** $838 $1,329 $4,636 $3,238
Adjustments for special items (after tax):
Gain (loss) on long-term U.K. natural gas contracts 139 (45) 232 (223)
Deferred income taxes – tax legislation changes --- --- 21 15
– other adjustments 93 --- 93 ---
Gain on dispositions 31 --- 274 ---
Loss on early extinguishment of debt (22) --- (22) ---
Cumulative effect of change in accounting principle --- (19) --- (19)
Gain on sale of minority interests in Equatorial
--- --- --- 21
Guinea LNG Holdings Limited
Net income $1,079 $1,265 $5,234 $3,032
Net income adjusted for special items** - per diluted
share $2.38 $3.61 $12.84 $9.02
Net income - per diluted share $3.06 $3.43 $14.50 $8.44
Revenues and other income $13,986 $17,215 $65,449 $63,345
Weighted average shares, in thousands - diluted 352,383 368,775 361,027 359,081
* Results are preliminary and unaudited. Marathon expects to issue its audited consolidated financial statements in March.
** See page 9 for a discussion of net income adjusted for special items.
Marathon Oil Corporation Reports Fourth Quarter and Full-Year 2006 Results
2. Key Highlights
Exploration and Production
• Increased 2006 sales volumes from continuing operations by 14 percent
• Announced seven exploration discoveries in Angola and Norway
• Realized 107 percent reserve replacement, exclusive of acquisitions and dispositions
• Established position in three key U.S. resource plays
• Progressed the Alvheim/Vilje development offshore Norway, first production expected second quarter
2007
• Received Norwegian Government approval of Volund field plan for development and operation (PDO)
• Progressed the Neptune deepwater Gulf of Mexico development, first production expected by early 2008
• Signed production sharing contract (PSC) for the Pasangkayu exploration block in Indonesia
• Realized substantial after-tax gain from sale of Russian businesses
Refining, Marketing and Transportation
• Reached final investment decision on Garyville, La., refinery expansion project
• Achieved record refinery crude oil and total throughput for the year
• Formed ethanol joint venture (JV) and began construction of JV’s first ethanol plant in Greenville, Ohio
• Awarded a front-end engineering and design (FEED) contract and launched a feasibility study for
potential heavy oil upgrading projects at the Detroit and Catlettsburg, Ky., refineries, respectively
• Completed all Tier II low sulfur fuel projects required as of June 1, 2006, on time and under budget
• Continued to strengthen midstream business through strategic marine and terminal asset acquisitions
• Increased Speedway SuperAmerica’s (SSA) same store gasoline and diesel sales volume 2.1 percent and
merchandise sales 7.8 percent in 2006
• Increased Marathon Brand gasoline and diesel sales volumes 5.8 percent in 2006
Integrated Gas
• Progressed Equatorial Guinea LNG Train 1 project, first shipment expected second quarter 2007
• Awarded FEED contract for possible second LNG train in Equatorial Guinea
Corporate
• Achieved 2006 top quartile total shareholder return of 55 percent
• Raised quarterly dividend rate 21 percent
• Repurchased approximately 21 million common shares at a cost of $1.7 billion in 2006
• Maintained financial flexibility and achieved a cash-adjusted debt to total capital ratio of approximately 6
percent as of year-end
• Issued request for proposals (RFP) for potential Canadian oil sands venture
• Achieved dramatic second year results in Bioko Island Malaria Control Project (BIMCP)
“Our vision, business model and strategy established five years ago have served as the foundation for
Marathon’s continued success throughout 2006,” said Clarence P. Cazalot, Jr., Marathon president and CEO.
“Marathon’s strong performance has been the result of dedicated employees throughout the Company who
performed their jobs in a manner consistent with our corporate values. Through these efforts during 2006, we
Marathon Oil Corporation Reports Fourth Quarter and Full-Year 2006 Financial Results page 2
3. grew our upstream production, realized continued exploration success, achieved record refinery throughputs
and continued to advance all of our major projects, including the significant Equatorial Guinea LNG Train 1
project.
“Marathon is poised to continue our success with a robust $4.2 billion capital, investment and exploration
budget for 2007. In addition to the major projects now under construction, this budget includes funds for the
180,000 barrel per day Garyville refinery expansion, a 110 million gallon per year ethanol facility in Greenville,
Ohio, a continued strong exploration program and the front-end engineering and design process for the
potential Equatorial Guinea LNG Train 2 facility. During the three year period 2005 through 2007, Marathon
will have invested over $15 billion, enabling us to meet the energy needs of our customers while also realizing
continued profitable growth across all our business segments.”
Segment Results
Effective January 1, 2006, Marathon revised its measure of segment income to reflect the effects of minority
interests and income taxes related to the segments. In addition, the results of activities primarily associated
with the marketing of the Company’s equity natural gas production, which had been presented as part of the
Integrated Gas segment prior to 2006, are now included in the Exploration and Production segment. Segment
information for all periods presented in this release reflects these changes.
Total segment income was $833 million in the fourth quarter of 2006 and $4.814 billion for the full-year 2006
compared with $1.452 billion and $3.570 billion in the same periods of 2005.
Quarter ended December 31 Year ended December 31
(Dollars in millions) 2006 2005 2006 2005
Segment Income (Loss)
Exploration and Production:
United States $167 $301 $873 $983
140 375 1,130 904
International
Total E&P 307 676 2,003 1,887
Refining, Marketing and Transportation 533 765 2,795 1,628
(7) 11 16 55
Integrated Gas
Segment Income*** $833 $1,452 $4,814 $3,570
*** See Preliminary Supplemental Statistics on page 13 for a reconciliation of segment income to net income as reported under generally
accepted accounting principles.
Exploration and Production
Upstream segment income totaled $307 million in the fourth quarter of 2006 compared to $676 million in the
same period of 2005. The decrease was primarily due to lower natural gas sales prices and volumes, and
higher exploration expenses and income taxes, partially offset by higher liquid hydrocarbon sales volumes and
prices.
For the year, upstream segment income totaled $2.003 billion compared to $1.887 billion for 2005. This
increase was primarily due to higher liquid hydrocarbon sales volumes and prices, partially offset by higher
income taxes, operating costs and exploration expenses and decreases in natural gas sales volumes.
Marathon Oil Corporation Reports Fourth Quarter and Full-Year 2006 Financial Results page 3
4. Reported sales volumes for the fourth quarter of 2006 averaged 357,000 barrels of oil equivalent per day
(boepd) and production available for sale averaged 363,000 boepd. The difference between the sales volume
and production available for sale was primarily a result of the Company producing, and injecting into storage,
natural gas contracted for future sale in Ireland. Reported sales volumes from continuing operations averaged
365,000 boepd for 2006, representing growth of 14 percent over 2005. Production available for sale from
continuing operations for 2006 also averaged 365,000 boepd. The largest sales volume increase in both
periods was in Libya, where first crude oil sales occurred in the first quarter of 2006.
United States upstream income was $167 million in the fourth quarter of 2006 compared to $301 million in
the same period of 2005. This decline was primarily a result of lower natural gas sales prices and volumes.
United States upstream income was $873 million for the year compared to $983 million in 2005. This decline
was primarily a result of lower natural gas sales prices and volumes, higher operating costs and exploration
expenses, partially offset by higher liquid hydrocarbon sales prices.
International upstream income was $140 million in the fourth quarter of 2006 compared to $375 million in the
same period of 2005. On a pre-tax basis, international upstream income increased $58 million as a result of
higher liquid hydrocarbon sales volumes and prices, primarily due to the resumption of production in Libya,
partially offset by lower natural gas sales volumes and prices and higher exploration expenses. Exploration
expenses for the fourth quarter of 2006 included $47 million for exiting the Cortland and Empire leases in
Nova Scotia. This increase in pre-tax income was more than offset by a $293 million increase in income taxes
for the quarter, primarily in Libya and the United Kingdom. International upstream income was $1.130 billion
for the year, compared to $904 million in 2005. This increase was primarily a result of higher liquid
hydrocarbon sales volumes due to the resumption of production in Libya and higher liquid hydrocarbon prices.
The increase for the year was substantially offset by higher income taxes and exploration expenses.
Quarter ended Year ended
December 31 December 31
2006 2005 2006 2005
Key Production Statistics
Net Sales:
United States – Liquids (mbpd) 74 78 76 76
United States – Gas (mmcfpd) 522 599 532 578
International – Liquids (mbpd) 138 116 147 88
International – Gas (mmcfpd) 352 406 315 354
Net Sales from Continuing Operations (mboepd) 357 362 365 319
Discontinued Operations (mboepd) — 30 12 27
Total Net Sales (mboepd) 357 392 377 346
In an effort to deliver profitable growth opportunities, Marathon continues to expand its resource base through
successful exploration as well as selective acquisitions. These efforts have created a well defined portfolio of
development opportunities which are expected to yield a compound average production growth rate of six to
nine percent through 2010. Production available for sale in 2007 is expected to range between 390,000 and
425,000 boepd. During 2006, the Company added net proved reserves of 143 million barrels of oil equivalent
(boe), excluding 45 million boe of dispositions and three million boe of acquisitions, while producing 134
Marathon Oil Corporation Reports Fourth Quarter and Full-Year 2006 Financial Results page 4
5. million boe during the year, resulting in a reserve replacement of 107 percent. Including acquisitions, reserve
replacement was 109 percent.
Key acreage acquisitions during 2006 include an extensive leasehold position in the Bakken Shale of North
Dakota and Montana, the Piceance Basin of Western Colorado and the Barnett Shale in North Central Texas.
These new U.S. resource plays expose Marathon to potential net resources of approximately 285 million boe.
Key among Marathon’s major upstream future production drivers are the Company’s Alvheim/Vilje
development on the Norwegian Continental Shelf, gas production from the Alba field offshore Equatorial
Guinea which will supply the Equatorial Guinea LNG Train 1 facility, and the Neptune development in the Gulf
of Mexico.
Construction on the Alvheim/Vilje project is nearly complete and commissioning has commenced. Lower
productivity in electrical and instrumentation activity delayed the start of commissioning by approximately one
month. First production from the Alvheim/Vilje development is now expected during the second quarter of
2007. Nevertheless, this project remains on an industry leading completion schedule, moving from discovery to
Four wells will be available at first production and drilling activities will continue
first production in four years.
into 2008. A peak net rate of approximately 75,000 boepd is expected in early 2008.
Approval was received from the Norwegian Ministry of Petroleum and Energy for the Volund plan for
development and operation (PDO). Volund, which is located near the Alvheim complex, will be tied back to
the Alvheim floating production, storage and offloading (FPSO) vessel. First production is expected in the
second quarter of 2009.
Development of Neptune continues to progress. The project is 63 percent complete and on target for first
production by early 2008.
Marathon’s production growth opportunities include seven discoveries announced during 2006 in Norway and
Angola. In the fourth quarter, Marathon participated in the Salsa discovery in deepwater Angola Block 32 and
the Terra discovery in deepwater Angola Block 31. Additional drilling is required to determine the
commerciality of these two discoveries. In addition, Marathon has participated in five wells that have reached
total depth in deepwater Angola. More details will be announced upon government and partner approvals.
In June 2006, Marathon was awarded a 70 percent interest and operatorship in the Pasangkayu Block offshore
Indonesia as part of that country's 2005 regular tender round. Current exploration plans call for the collection
of geophysical data during 2007, followed by drilling during 2008 and 2009.
In the fourth quarter, Marathon sold 90 percent of its interest in the Ash Shaer and Cherrife natural gas fields
in Syria for an after-tax gain of $31 million. The Company expects to sell the remaining 10 percent interest in
2007. Also in 2006, Marathon completed the sale of its Russian oil exploration and production businesses for
$787 million, plus preliminary working capital and other closing adjustments of approximately $56 million, for
a total transaction value of $843 million and an after-tax gain of $243 million.
Refining, Marketing and Transportation
Downstream segment income was $533 million in the fourth quarter of 2006 and $2.795 billion for the year
compared to segment income of $765 million and $1.628 billion in the comparable periods of 2005. Segment
Marathon Oil Corporation Reports Fourth Quarter and Full-Year 2006 Financial Results page 5
6. income for the full year of 2006 benefited from Marathon’s June 30, 2005, acquisition of the 38 percent
minority interest in the downstream operations.
The key driver of the changes in quarterly and full-year segment income was the Company’s refining and
wholesale marketing gross margin, which averaged 17.07 cents per gallon in the fourth quarter of 2006
compared to 21.84 cents in the same quarter of 2005 and averaged 22.88 cents per gallon for 2006 compared
to 15.82 cents per gallon in 2005. These gross margin changes were consistent with the changes in the
relevant market indicators (crack spreads) for the Midwest and Gulf Coast markets. Narrower sweet/sour
crude differentials in the fourth quarter of 2006 also contributed to declining margins in that period. The
increase in the refining and wholesale marketing gross margin for the year reflected wider crack spreads,
improved refined product sales realizations, the favorable effects of the Company’s ethanol blending program
and increased refinery throughputs.
While derivative effects in the fourth quarter of 2006 did not differ significantly from the same period in 2005,
the Company’s full-year refining and wholesale marketing gross margins included a pre-tax gain of $400
million in 2006 and a pre-tax loss of $238 million in 2005 related to derivatives utilized primarily to manage
price risk. These derivative gains and losses are largely offset by gains and losses on the physical commodity
transactions related to these derivative positions.
Crude oil refined during the fourth quarter of 2006 averaged 952,000 barrels per day (bpd), down slightly
from the record throughput achieved in the fourth quarter of 2005. This decrease was due to production
levels being maximized in late 2005 to replenish refined product supplies depleted by the effects of Hurricanes
Katrina and Rita. Crude oil refined for the year 2006 averaged a record 980,000 bpd, 7,000 bpd higher than
2005. Total refinery throughputs averaged a record 1,214,000 bpd for the year 2006, three percent higher
than the 1,178,000 bpd for 2005. This record throughput was primarily a result of the expansion of the
Detroit refinery from 74,000 to 100,000 bpd, which was completed during the fourth quarter of 2005.
SSA’s gasoline and distillate gross margin averaged 11.21 cents per gallon during the fourth quarter of 2006,
down from the 14.00 cents per gallon realized in the fourth quarter of 2005, and averaged 11.56 cents per
gallon for the full-year 2006, down from the 12.30 cents per gallon realized in 2005. SSA’s same store
merchandise sales increased 5.9 percent during the fourth quarter and 7.8 percent for the full-year 2006.
Quarter ended Year ended
December 31 December 31
2006 2005 2006 2005
Key Refining, Marketing and Transportation
Statistics
Crude Oil Refined (mbpd) 952 980 980 973
260 259 234 205
Other Charge and Blend Stocks (mbpd)
Total Refinery Inputs (mbpd) 1,212 1,239 1,214 1,178
Refined Product Sales Volumes (mbpd)**** 1,389 1,504 1,425 1,455
Refining and Wholesale Marketing Gross Margin
$0.1707 $0.2184 $0.2288 $0.1582
($/gallon) ****
****On April 1, 2006, Marathon changed its accounting for matching buy/sell arrangements as a result of a new accounting
standard. This change resulted in lower refined product sales volumes and a higher refining and wholesale marketing gross
Marathon Oil Corporation Reports Fourth Quarter and Full-Year 2006 Financial Results page 6
7. margin per gallon in subsequent periods of 2006 than would have been reported under the previous accounting practices.
See Selected Notes to Consolidated Financial Statements on page 12.
In the fourth quarter, Marathon reached a final investment decision for the projected $3.2 billion Garyville
refinery expansion project which will increase the refinery’s 245,000 bpd capacity by 180,000 bpd. In
addition, the Louisiana Department of Environmental Quality has recently approved the air permit for the
expansion project. When completed in late 2009, this expansion will enable the refinery to provide an
additional 7.5 million gallons of clean transportation fuels to the market each day.
Also in the fourth quarter, Marathon announced that it had awarded a FEED contract for a potential heavy oil
upgrading project at the Company’s 100,000 bpd Detroit refinery, and that it is undertaking a feasibility study
for a similar upgrading project at the Company’s 222,000 bpd Catlettsburg refinery.
In 2006, Marathon and its partner announced that the companies signed a definitive agreement forming a
50/50 joint venture, which will construct one or more ethanol plants. In the fourth quarter, the companies
selected the venture’s initial plant site, Greenville, Ohio, and groundbreaking and construction have
commenced on a 110 million gallon per year ethanol facility. The facility is expected to be operational as soon
as the first quarter of 2008.
To increase the Company’s marine transportation flexibility in supplying fuel, crude oil and other petroleum
products, Marathon acquired five towboats and 10 heater barges during the fourth quarter. Also in 2006, the
Company acquired refined products terminals in Hartford, Ill., and Clermont, Ind., to improve its ability to
serve these markets.
Integrated Gas
The Integrated Gas segment reported a loss of $7 million in the fourth quarter of 2006 and income of $16
million for the year 2006 compared to income of $11 million and $55 million in the comparable periods of
2005. In the fourth quarter of 2006, a $17 million pre-tax loss was recognized as a result of the renegotiation
of a technology agreement with Syntroleum Corporation. Also contributing to the full-year decline was a
reduction in income from the Company’s equity method investment in Atlantic Methanol Production Company
LLC (AMPCO) due to a planned turnaround and compressor repair.
The Equatorial Guinea LNG Train 1 project continued to progress during 2006. As of the end of the fourth
quarter, construction of the project was nearly complete and commissioning has commenced. First LNG
shipments are projected to begin in the second quarter of 2007. In 2006, Marathon and its project partners
awarded a FEED contract for initial work related to a potential second LNG train on Bioko Island, Equatorial
Guinea. The FEED work is expected to be completed by the end of the first quarter of 2007. The scope of the
FEED work for the potential 4.4 million metric tonnes per annum (mmtpa) Train 2 LNG project includes feed
gas metering, liquefaction, refrigeration, ethylene storage, boil off gas compression, product transfer to
storage and LNG product metering. A final investment decision is expected in early 2008.
Corporate/Other
In 2006, Marathon’s Board of Directors approved an increase in the Company’s quarterly dividend for the third
time in three years for a total increase of 74 percent. In January 2006, Marathon announced a $2 billion
Marathon Oil Corporation Reports Fourth Quarter and Full-Year 2006 Financial Results page 7
8. share repurchase program. As of December 31, 2006, the Company has repurchased approximately 21
million of its common shares, or six percent of outstanding shares at December 31, 2005, at a cost of $1.7
billion. Recently, the Company’s Board of Directors authorized a $500 million increase in the share
repurchase program. Marathon currently anticipates completing share repurchases under the initial $2 billion
program in February 2007, with the additional $500 million in share repurchases projected to be completed
during the first half of 2007. This program may be changed based on the Company’s financial condition or
changes in market conditions and is subject to termination prior to completion.
In the fourth quarter, Marathon issued a request for proposals (RFP) to engage interested parties in a process
that could lead to a Canadian oil sands venture. The RFP process is intended to explore various commercial
arrangements under which Marathon would provide heavy Canadian oil sands crude oil processing capacity in
exchange for an equity interest in a Canadian oil sands project through a joint venture, or other alternative
business arrangements.
Marathon and its project partners have achieved dramatic results during the second year of the five-year,
$12.8 million Bioko Island Malaria Control Project (BIMCP) in Equatorial Guinea. Year two results included a 95
percent reduction in malaria transmitting mosquitoes and a 44 percent reduction in the presence of malaria
parasites in children. These results further demonstrate that the BIMCP is steadily eradicating the
transmission of a disease that poses the most significant health threat to the citizens of Equatorial Guinea.
Special Items
Marathon has two long-term natural gas sales contracts in the United Kingdom that are accounted for as
derivative instruments. Mark-to-market changes in the valuation of these contracts must be recognized in
current period income. The non-cash after-tax mark-to-market gains on these two long-term natural gas
sales contracts related to Marathon’s Brae natural gas production totaled $139 million in the fourth quarter of
2006 and $232 million for the year. Due to the volatility in the fair value of these contracts, Marathon
excludes these non-cash gains and losses from “net income adjusted for special items.”
During the fourth quarter of 2006, Marathon recorded a deferred income tax benefit of $93 million related to
cumulative income tax basis differences associated with prior period transactions. This benefit was excluded
from “net income adjusted for special items.”
In the fourth quarter of 2006, Marathon sold 90 percent of its interest in natural gas fields in Syria. The $31
million after-tax gain on this disposition has been excluded from “net income adjusted for special items.”
Also in the fourth quarter of 2006, Marathon extinguished a portion of its outstanding debt at a premium, and
recognized a $22 million after-tax loss. This loss has been excluded from “net income adjusted for special
items.”
Other special items excluded from full-year 2006 “net income adjusted for special items” were the gain on the
disposition of the Company’s Russian oil exploration and production businesses and the impact of a U.K tax
legislation change. These special items were discussed in the quarters in which they occurred.
The Company will conduct a conference call and webcast today, February 1, 2007, at 3 p.m. EST during which
it will discuss fourth quarter and full-year 2006 results. The webcast will include synchronized slides. To listen
Marathon Oil Corporation Reports Fourth Quarter and Full-Year 2006 Financial Results page 8
9. to the webcast of the conference call and view the slides, visit the Marathon Web site at www.Marathon.com.
Replays of the webcast will be available through February 15, 2007. Quarterly financial and operational
information is also provided on Marathon’s Web site at
http://www.marathon.com/Investor_Center/Investor_Relations/in the Quarterly Investor Packet.
- xxx -
In addition to net income determined in accordance with generally accepted accounting principles, Marathon
has provided supplementally “net income adjusted for special items,” a non-GAAP financial measure which
facilitates comparisons to earnings forecasts prepared by stock analysts and other third parties. Such
forecasts generally exclude the effects of items that are considered non-recurring, are difficult to predict or to
measure in advance or that are not directly related to Marathon's ongoing operations. A reconciliation between
GAAP net income and “net income adjusted for special items” is provided in a table on page 1 of this release.
“Net income adjusted for special items” should not be considered a substitute for net income as reported in
accordance with GAAP. Management, as well as certain investors, uses “net income adjusted for special items”
to evaluate Marathon's financial performance between periods. Management also uses “net income adjusted
for special items” to compare Marathon's performance to certain competitors.
This release contains forward-looking statements with respect to future capital, investment and exploration
spending, the timing and levels of the Company's worldwide liquid hydrocarbon and natural gas and
condensate production and sales, expansion plans for core areas, the Alvheim/Vilje development, the Volund
and Neptune developments, potential developments in Angola, anticipated future exploratory and
development drilling activity in Indonesia and other locations, a joint venture that would construct and operate
ethanol plants, the Garyville expansion project, an LNG project in Equatorial Guinea and possible expansion
thereof, a possible Canadian oil sands venture, heavy oil refining upgrading projects, and the common stock
repurchase program. Some factors that could potentially affect future capital, investment and exploration
spending, worldwide liquid hydrocarbon and natural gas and condensate production and sales, expansion
plans for core areas, the Alvheim/Vilje development, the Volund and Neptune developments, potential
developments in Angola, and anticipated future exploratory and development drilling activity include pricing,
supply and demand for petroleum products, amount of capital available for exploration and development,
regulatory constraints, timing of commencing production from new wells, drilling rig availability, unforeseen
hazards such as weather conditions, acts of war or terrorist acts and the governmental or military response
thereto, and other geological, operating and economic considerations. Except for the Alvheim/Vilje and
Volund developments, the foregoing forward-looking statements may be further affected by the inability or
delay in obtaining government and third-party approvals and permits. Worldwide production and sales could
also be affected by the occurrence of acquisitions or dispositions of oil and gas properties. Factors that could
affect the ethanol plant construction, management and development, and the Garyville expansion project
include transportation logistics, availability of materials and labor, unforeseen hazards such as weather
conditions, necessary government and third-party approvals, and other risks customarily associated with
construction projects. The Garyville project may be further affected by crude oil supply. Factors that could
affect the LNG project include unforeseen problems arising from commissioning of the facilities, unforeseen
hazards such as weather conditions, and other operating considerations, such as shipping of the LNG. In
addition to these factors, other factors that could potentially affect the possible expansion of the LNG project
and the development of additional LNG capacity through additional projects include partner approvals, access
to sufficient natural gas volumes through exploration or commercial negotiations with other resource owners
and access to sufficient regasification capacity. Factors that could affect the formation of the Canadian oil
sands venture and heavy oil refining upgrading projects include unforeseen difficulty in negotiation of
definitive agreements, results of front-end engineering and design work, inability or delay in obtaining
necessary government and third-party approvals, continued favorable investment climate, and other
geological, operating and economic considerations. The refining upgrading projects may be further affected
by approval of Marathon’s Board of Directors. The forward-looking statements related to proved reserves are
based on certain assumptions including, among others, presently known physical data concerning size and
character of reservoirs, economic recoverability, technology development, future drilling success, production
experience, industry economic conditions, levels of cash flow from operations and operating conditions. The
common stock repurchase program could be affected by changes in prices of and demand for crude oil,
natural gas and refined products, actions of competitors, disruptions or interruptions of the Company’s
production or refining operations due to unforeseen hazards such as weather conditions or acts of war or
terrorist acts, and other operating and economic considerations. The foregoing factors (among others) could
Marathon Oil Corporation Reports Fourth Quarter and Full-Year 2006 Financial Results page 9
10. cause actual results to differ materially from those set forth in the forward-looking statements. In accordance
with the quot;safe harborquot; provisions of the Private Securities Litigation Reform Act of 1995, Marathon Oil
Corporation has included in its Annual Report on Form 10-K for the year ended December 31, 2005, and
subsequent Forms 10-Q and 8-K, cautionary language identifying other important factors, though not
necessarily all such factors, that could cause future outcomes to differ materially from those set forth in the
forward-looking statements.
Cautionary Note to U.S. Investors - The United States Securities and Exchange Commission (SEC) permits
oil and gas companies, in their filings with the SEC, to disclose only proved reserves that a company has
demonstrated by actual production or conclusive formation tests to be economically and legally producible
under existing economic and operating conditions. Marathon Oil Corporation uses certain terms in this press
release, such as net resources of barrels of oil equivalent, that the SEC's guidelines strictly prohibit us from
including in filings with the SEC. U.S. Investors are urged to consider closely the disclosures in Marathon's
periodic filings with the SEC, available from us at 5555 San Felipe, Houston, Texas 77056 and the Company's
Web site at http://www.Marathon.com. You can also obtain this information from the SEC by calling 1-800-
SEC-0330.
Media Relations Contacts: Paul Weeditz 713-296-3910
Scott Scheffler 713-296-4102
Investor Relations Contacts: Ken Matheny 713-296-4114
Howard Thill 713-296-4140
Marathon Oil Corporation Reports Fourth Quarter and Full-Year 2006 Financial Results page 10
11. Condensed Consolidated Statements of Income (Unaudited)
Quarter Ended Year Ended
December 31 December 31
(Dollars in millions, except per share data) 2006 2005 2006 2005
Revenues and Other Income:
Sales and other operating revenues (including
$13,274 $13,904 $57,973 $48,948
consumer excise taxes)
Revenues from matching buy/sell transactions 208 2,829 5,457 12,636
Sales to related parties 325 355 1,466 1,402
Income from equity method investments 93 112 391 265
Net gains on disposal of assets 49 11 77 57
Other income, net 37 4 85 37
Total revenues and other income 13,986 17,215 65,449 63,345
Costs and Expenses:
Cost of revenues (excludes items below) 9,768 10,045 42,415 37,806
Purchases related to matching buy/sell transactions 191 3,052 5,396 12,364
Purchases from related parties 51 62 210 225
Consumer excise taxes 1,240 1,204 4,979 4,715
Depreciation, depletion and amortization 388 353 1,518 1,303
Selling, general and administrative expenses 333 304 1,228 1,155
Other taxes 91 77 371 318
Exploration expenses 131 87 365 217
Total costs and expenses 12,193 15,184 56,482 58,103
Income from Operations 1,793 2,031 8,967 5,242
Net interest and other financing costs (income) (44) 47 (37) 146
Loss on early extinguishment of debt 35 – 35 –
Minority interests in income (loss) of:
Marathon Petroleum Company LLC – – – 384
Equatorial Guinea LNG Holdings Limited (3) (4) (10) (8)
Income from Continuing Operations before
Income Taxes 1,805 1,988 8,979 4,720
Provision for income taxes 726 723 4,022 1,714
Income from Continuing Operations 1,079 1,265 4,957 3,006
Discontinued operations – 19 277 45
Income before cumulative effect of change in
1,079 1,284 5,234 3,051
accounting principle
Cumulative effect of change in accounting principle – (19) – (19)
Net Income $1,079 $1,265 $5,234 $3,032
Income from Continuing Operations
Per share - basic $3.09 $3.46 $13.85 $8.44
Per share – diluted $3.06 $3.43 $13.73 $8.37
Net Income
Per share - basic $3.09 $3.46 $14.62 $8.52
Per share – diluted $3.06 $3.43 $14.50 $8.44
Dividends paid per share $0.40 $0.33 $1.53 $1.22
Weighted average shares, in thousands
Basic 349,604 365,486 357,911 356,003
Diluted 352,383 368,775 361,027 359,081
Marathon Oil Corporation Reports Fourth Quarter and Full-Year 2006 Financial Results page 11
12. Selected Notes to Financial Statements (Unaudited)
1. On April 1, 2006, Marathon changed its accounting for matching buy/sell arrangements that are entered
into or modified on or after April 1, 2006 as a result of a new accounting standard. In a typical matching
buy/sell transaction, Marathon enters into a contract to sell a particular grade of crude oil or refined
product at a specified location and date to a particular counterparty and simultaneously agrees to buy a
particular grade of the same commodity at a specified location on the same or another specified date from
the same counterparty. Prior to this change in accounting, Marathon recorded such matching buy/sell
transactions in both revenues and cost of revenues as separate sales and purchase transactions. Upon
adoption, these transactions are accounted for as exchanges of inventory. Transactions arising from
matching buy/sell arrangements entered into before April 1, 2006 will continue to be reported as separate
sales and purchase transactions.
This change in accounting will not have an effect on net income. However, the amount of revenues
recognized subsequent to adoption will be less than the amount that would have been recognized under
previous accounting practices. Cost of revenues will decrease by an amount equal to the decrease in
revenues.
Marathon Oil Corporation Reports Fourth Quarter and Full-Year 2006 Financial Results page 12
13. Preliminary Supplemental Statistics (Unaudited)
Quarter Ended Year Ended
December 31 December 31
2006 2005
(Dollars in millions, except as noted) 2006 2005
Segment Income (Loss)
Exploration & Production
United States $167 $301 $873 $983
140 375 1,130 904
International
Total E&P 307 676 2,003 1,887
Refining, Marketing & Transportation 533 765 2,795 1,628
(7) 11 16 55
Integrated Gas
Segment Income 833 1,452 4,814 3,570
Items not allocated to segments, net of taxes:
Corporate and other unallocated items 5 (142) (212) (377)
Gain (loss) on long-term U.K. natural gas contracts 139 (45) 232 (223)
Deferred income taxes – tax legislation changes — — 21 15
– other adjustments 93 — 93 —
Gain on dispositions 31 — 274 —
Loss on early extinguishment of debt (22) — (22) —
Cumulative effect of change in accounting principle — (19) — (19)
Gain on sale of minority interests in EG Holdings — — — 21
— 19 34 45
Discontinued operations
Net Income $1,079 $1,265 $5,234 $3,032
Capital Expenditures
Exploration & Production $553 $439 $2,169 $1,366
Refining, Marketing & Transportation(a) 389 333 916 841
Integrated Gas(b) 71 58 307 571
Discontinued Operations — 21 45 94
15 14 41 18
Corporate
Total $1,028 $865 $3,478 $2,890
Exploration Expense
United States $60 $59 $169 $118
71 28 196 99
International
Total $131 $87 $365 $217
Marathon Oil Corporation Reports Fourth Quarter and Full-Year 2006 Financial Results page 13
14. Preliminary Supplemental Statistics (Unaudited) (continued)
Quarter Ended Year Ended
December 31 December 31
2006 2005 2006 2005
Operating Statistics
Net Liquid Hydrocarbon Sales (mbpd)(c)
United States 74 78 76 76
Europe 34 54 35 36
104 62 112 52
Africa
138 116 147 88
Total International
212 194 223 164
Worldwide Continuing Operations
— 30 12 27
Discontinued operations
212 224 235 191
Worldwide
Net Natural Gas Sales (mmcfd)(c)(d)
United States 522 599 532 578
Europe 262 314 243 262
90 92 72 92
Africa
352 406 315 354
Total International
874 1,005 847 932
Worldwide
Net Sales from Continuing Operations (mboepd) 357 362 365 319
— 30 12 27
Net Sales from Discontinued Operations (mboepd)
357 392 377 346
Total Net Sales (mboepd)
Average Realizations (e)
Liquid Hydrocarbons ($ per net bbl)
United States $48.33 $48.78 $54.41 $45.41
Europe 59.01 58.44 64.02 52.99
Africa 53.61 44.52 59.83 46.27
Total International 54.94 50.99 60.81 49.04
Worldwide Continuing Operations 52.63 50.10 58.63 47.35
Discontinued operations — 34.66 38.38 33.47
Worldwide $52.63 $47.98 $57.58 $45.42
Natural Gas ($ per net mcf)
United States $5.36 $8.30 $5.76 $6.42
Europe 6.49 7.57 6.74 5.70
Africa 0.32 0.24 0.27 0.25
Total International 4.90 5.92 5.27 4.28
Worldwide $5.17 $7.34 $5.58 $5.61
Marathon Oil Corporation Reports Fourth Quarter and Full-Year 2006 Financial Results page 14
15. Preliminary Supplemental Statistics (Unaudited) (continued)
Quarter Ended Year Ended
December 31 December 31
(Dollars in millions, except as noted) 2006 2005 2006 2005
Refinery Runs (mbpd)
Crude Oil Refined 952 980 980 973
260 259 234 205
Other Charge and Blend Stocks
Total 1,212 1,239 1,214 1,178
Refined Product Yields (mbpd)
Gasoline 681 703 661 644
Distillates 342 329 323 318
Propane 24 21 23 21
Feedstocks and Special Products 74 81 107 96
Heavy Fuel Oil 34 38 26 28
74 81 89 85
Asphalt
Total 1,229 1,253 1,229 1,192
Refined Product Sales Volumes (mbpd)(f)(g) 1,389 1,504 1,425 1,455
Matching buy/sell volumes included in refined
product sales volumes (mbpd) (g) — 73 24 77
Refining and Wholesale Marketing
Gross Margin ($/gallon)(h) $0.1707 $0.2184 $0.2288 $0.1582
Speedway SuperAmerica LLC
Number of SSA retail outlets 1,636 1,638 — —
SSA Gasoline and Distillate Sales(i) 842 834 3,301 3,226
SSA Gasoline and Distillate Gross
Margin ($/gallon) $0.1121 $0.1400 $0.1156 $0.1230
SSA Merchandise Sales $677 $637 $2,706 $2,531
SSA Merchandise Gross Margin $170 $158 $667 $626
(a)
Includes MPC at 100 percent.
(b)
Includes Equatorial Guinea LNG Holdings at 100 percent.
(c)
Amounts represent net sales after royalties, except for Ireland where amounts are before royalties.
(d)
Includes natural gas acquired for injection and subsequent resale of 47 mmcfd and 50 mcfd in the fourth quarters of 2006 and
2005, and 46 mmcfd and 38 mmcfd for the years 2006 and 2005. Effective July 1, 2005, the methodology for allocating sales
volumes between natural gas produced from the Brae complex and third-party natural gas production was modified, resulting in
an increase in volumes representing natural gas acquired for injection and subsequent resale.
(e)
Excludes gains and losses on traditional derivative instruments and the unrealized effects of long-term U.K. natural gas contracts
that are accounted for as derivatives.
(f)
Total average daily volumes of all refined product sales to wholesale, branded and retail (SSA) customers.
(g)
As a result of the change in accounting for matching buy/sell arrangements on April 1, 2006, the reported sales volumes will be
lower than the volumes determined under the previous accounting practices. See Selected Notes to Consolidated Financial
Statements on page 12.
(h)
Sales revenue less cost of refinery inputs, purchased products and manufacturing expenses, including depreciation. As a result
of the change in accounting for matching buy/sell transactions on April 1, 2006, the resulting per gallon statistic will be higher
than the statistic that would have been calculated from amounts determined under previous accounting practices. See Selected
Notes to Consolidated Financial Statements on page 12.
(i)
Millions of gallons.
Marathon Oil Corporation Reports Fourth Quarter and Full-Year 2006 Financial Results page 15