4. SLM CORPORATION
Segment and “Core Earnings”
Consolidated Statements of Income
(In thousands)
Quarter ended September 30, 2008
Asset
Performance Corporate Total “Core Total
Lending Group and Other Earnings” Adjustments GAAP
(unaudited)
Interest income:
FFELP Stafford and Other
Student Loans . . . . . . . . . . . . $ 611,786 $ — $ — $ 611,786 $ (95,670) $ 516,116
FFELP Consolidation Loans . . . . 995,102 — — 995,102 (164,536) 830,566
Private Education Loans . . . . . . . 678,293 — — 678,293 (232,721) 445,572
Other loans . . . . . . . . . . . . . . . . 19,874 — — 19,874 — 19,874
Cash and investments . . . . . . . . . 61,731 — 6,829 68,560 (11,406) 57,154
Total interest income . . . . . . . . . . . 2,366,786 — 6,829 2,373,615 (504,333) 1,869,282
Total interest expense . . . . . . . . . . 1,651,071 5,984 4,472 1,661,527 (266,994) 1,394,533
Net interest income (loss) . . . . . . . 715,715 (5,984) 2,357 712,088 (237,339) 474,749
Less: provisions for loan losses . . . 263,019 — — 263,019 (76,110) 186,909
Net interest income (loss) after
provisions for loan losses . . . . . . 452,696 (5,984) 2,357 449,069 (161,229) 287,840
Contingency fee revenue . . . . . . . . — 89,418 — 89,418 — 89,418
Collections revenue (loss) . . . . . . . — (168,689) — (168,689) (2,003) (170,692)
Guarantor servicing fees . . . . . . . . — — 36,848 36,848 — 36,848
Other income (loss) . . . . . . . . . . . . 55,315 — 50,661 105,976 (233,546) (127,570)
Total other income (loss) . . . . . . . . 55,315 (79,271) 87,509 63,553 (235,549) (171,996)
Restructuring expenses . . . . . . . . . (236) 4,177 6,567 10,508 — 10,508
Operating expenses . . . . . . . . . . . . 141,797 105,748 69,161 316,706 50,446 367,152
Total expenses . . . . . . . . . . . . . . . 141,561 109,925 75,728 327,214 50,446 377,660
Income (loss) before income taxes
and minority interest in net
earnings of subsidiaries . . . . . . . 366,450 (195,180) 14,138 185,408 (447,224) (261,816)
Income tax expense (benefit)(1) . . . . 134,440 (71,756) 5,198 67,882 (171,701) (103,819)
Minority interest in net earnings of
subsidiaries . . . . . . . . . . . . . . . . — 544 — 544 — 544
Net income (loss) . . . . . . . . . . . . . $ 232,010 $(123,968) $ 8,940 $ 116,982 $(275,523) $ (158,541)
(1)
Income taxes are based on a percentage of net income before tax for the individual reportable segment.
4
5. SLM CORPORATION
Segment and “Core Earnings”
Consolidated Statements of Income
(In thousands)
Quarter ended June 30, 2008
Asset
Performance Corporate Total “Core Total
Lending Group and Other Earnings” Adjustments GAAP
(unaudited)
Interest income:
FFELP Stafford and Other
Student Loans . . . . . . . . . . . . $ 524,022 $ — $ — $ 524,022 $ (26,424) $ 497,598
FFELP Consolidation Loans . . . . 907,669 — — 907,669 (138,005) 769,664
Private Education Loans . . . . . . . 665,452 — — 665,452 (256,129) 409,323
Other loans . . . . . . . . . . . . . . . . 21,355 — — 21,355 — 21,355
Cash and investments . . . . . . . . . 80,445 — 4,902 85,347 (14,826) 70,521
Total interest income . . . . . . . . . . . 2,198,943 — 4,902 2,203,845 (435,384) 1,768,461
Total interest expense . . . . . . . . . . 1,604,872 6,933 5,074 1,616,879 (250,961) 1,365,918
Net interest income (loss) . . . . . . . 594,071 (6,933) (172) 586,966 (184,423) 402,543
Less: provisions for loan losses . . . 192,181 — — 192,181 (49,166) 143,015
Net interest income (loss) after
provisions for loan losses . . . . . . 401,890 (6,933) (172) 394,785 (135,257) 259,528
Contingency fee revenue . . . . . . . . — 83,790 — 83,790 — 83,790
Collections revenue . . . . . . . . . . . . — 27,517 — 27,517 (1,152) 26,365
Guarantor servicing fees . . . . . . . . — — 23,663 23,663 — 23,663
Other income . . . . . . . . . . . . . . . . 61,898 — 45,587 107,485 321,333 428,818
Total other income . . . . . . . . . . . . 61,898 111,307 69,250 242,455 320,181 562,636
Restructuring expenses . . . . . . . . . 30,947 5,174 10,619 46,740 — 46,740
Operating expenses . . . . . . . . . . . . 154,505 110,340 73,871 338,716 14,972 353,688
Total expenses . . . . . . . . . . . . . . . 185,452 115,514 84,490 385,456 14,972 400,428
Income (loss) before income taxes
and minority interest in net
earnings of subsidiaries . . . . . . . 278,336 (11,140) (15,412) 251,784 169,952 421,736
Income tax expense (benefit)(1) . . . . 102,917 (4,050) (5,651) 93,216 59,858 153,074
Minority interest in net earnings of
subsidiaries . . . . . . . . . . . . . . . . — 2,926 — 2,926 — 2,926
Net income (loss) . . . . . . . . . . . . . $ 175,419 $ (10,016) $ (9,761) $ 155,642 $ 110,094 $ 265,736
(1)
Income taxes are based on a percentage of net income before tax for the individual reportable segment.
5
6. SLM CORPORATION
Segment and “Core Earnings”
Consolidated Statements of Income
(In thousands)
Quarter ended September 30, 2007
Asset
Performance Corporate Total “Core Total
Lending Group and Other Earnings” Adjustments GAAP
(unaudited)
Interest income:
FFELP Stafford and Other
Student Loans . . . . . . . . . . . . $ 729,255 $ — $ — $ 729,255 $(183,637) $ 545,618
FFELP Consolidation Loans . . . . 1,445,108 — — 1,445,108 (299,635) 1,145,473
Private Education Loans . . . . . . . 753,295 — — 753,295 (360,558) 392,737
Other loans . . . . . . . . . . . . . . . . 25,990 — — 25,990 — 25,990
Cash and investments . . . . . . . . . 250,463 — 6,039 256,502 (45,199) 211,303
Total interest income . . . . . . . . . . . 3,204,111 — 6,039 3,210,150 (889,029) 2,321,121
Total interest expense . . . . . . . . . . 2,533,909 6,632 5,282 2,545,823 (666,012) 1,879,811
Net interest income (loss) . . . . . . . 670,202 (6,632) 757 664,327 (223,017) 441,310
Less: provisions for loan losses . . . 199,591 — — 199,591 (56,991) 142,600
Net interest income (loss) after
provisions for loan losses . . . . . . 470,611 (6,632) 757 464,736 (166,026) 298,710
Contingency fee revenue . . . . . . . . — 76,306 — 76,306 — 76,306
Collections revenue . . . . . . . . . . . . — 52,534 — 52,534 254 52,788
Guarantor servicing fees . . . . . . . . — — 45,935 45,935 — 45,935
Other income (loss) . . . . . . . . . . . . 45,745 — 62,843 108,588 (485,662) (377,074)
Total other income (loss) . . . . . . . . 45,745 128,840 108,778 283,363 (485,408) (202,045)
Restructuring expenses . . . . . . . . . — — — — — —
Operating expenses . . . . . . . . . . . . 163,855 94,625 78,882 337,362 18,537 355,899
Total expenses . . . . . . . . . . . . . . . 163,855 94,625 78,882 337,362 18,537 355,899
Income (loss) before income taxes
and minority interest in net
earnings of subsidiaries . . . . . . . 352,501 27,583 30,653 410,737 (669,971) (259,234)
Income tax expense(1) . . . . . . . . . . 130,425 10,206 11,342 151,973 (67,524) 84,449
Minority interest in net earnings of
subsidiaries . . . . . . . . . . . . . . . . — 77 — 77 — 77
Net income (loss) . . . . . . . . . . . . . $ 222,076 $ 17,300 $ 19,311 $ 258,687 $(602,447) $ (343,760)
(1)
Income taxes are based on a percentage of net income before tax for the individual reportable segment.
6
7. SLM CORPORATION
Segment and “Core Earnings”
Consolidated Statements of Income
(In thousands)
Nine months ended September 30, 2008
Asset
Performance Corporate Total “Core Total
Lending Group and Other Earnings” Adjustments GAAP
(unaudited)
Interest income:
FFELP Stafford and Other
Student Loans . . . . . . . . . . . . $1,630,190 $ — $ — $1,630,190 $ (152,000) $1,478,190
FFELP Consolidation Loans . . . . 2,891,257 — — 2,891,257 (454,371) 2,436,886
Private Education Loans . . . . . . . 2,093,066 — — 2,093,066 (794,649) 1,298,417
Other loans . . . . . . . . . . . . . . . . 64,573 — — 64,573 — 64,573
Cash and investments . . . . . . . . . 284,078 — 17,998 302,076 (50,585) 251,491
Total interest income . . . . . . . . . . . 6,963,164 — 17,998 6,981,162 (1,451,605) 5,529,557
Total interest expense . . . . . . . . . . 5,080,414 19,757 14,748 5,114,919 (739,023) 4,375,896
Net interest income (loss) . . . . . . . 1,882,750 (19,757) 3,250 1,866,243 (712,582) 1,153,661
Less: provisions for loan losses . . . 636,521 — — 636,521 (169,286) 467,235
Net interest income (loss) after
provisions for loan losses . . . . . . 1,246,229 (19,757) 3,250 1,229,722 (543,296) 686,426
Contingency fee revenue . . . . . . . . — 258,514 — 258,514 — 258,514
Collections revenue (loss) . . . . . . . — (84,811) — (84,811) (2,277) (87,088)
Guarantor servicing fees . . . . . . . . — — 95,164 95,164 — 95,164
Other income . . . . . . . . . . . . . . . . 161,558 — 146,889 308,447 (113,486) 194,961
Total other income . . . . . . . . . . . . 161,558 173,703 242,053 577,314 (115,763) 461,551
Restructuring expenses . . . . . . . . . 46,261 9,785 21,880 77,926 — 77,926
Operating expenses . . . . . . . . . . . . 459,938 322,230 212,687 994,855 81,633 1,076,488
Total expenses . . . . . . . . . . . . . . . 506,199 332,015 234,567 1,072,781 81,633 1,154,414
Income (loss) before income taxes
and minority interest in net
earnings of subsidiaries . . . . . . . 901,588 (178,069) 10,736 734,255 (740,692) (6,437)
Income tax expense (benefit)(1) . . . . 331,424 (65,458) 3,946 269,912 (283,145) (13,233)
Minority interest in net earnings of
subsidiaries . . . . . . . . . . . . . . . . — 3,405 — 3,405 — 3,405
Net income (loss) . . . . . . . . . . . . . $ 570,164 $(116,016) $ 6,790 $ 460,938 $ (457,547) $ 3,391
(1)
Income taxes are based on a percentage of net income before tax for the individual reportable segment.
7
8. SLM CORPORATION
Segment and “Core Earnings”
Consolidated Statements of Income
Nine months ended September 30, 2007
Asset
Performance Corporate Total “Core Total
Lending Group and Other Earnings” Adjustments GAAP
(unaudited)
Interest income:
FFELP Stafford and Other
Student Loans . . . . . . . . . . . . $2,143,232 $ — $ — $2,143,232 $ (635,552) $1,507,680
FFELP Consolidation Loans . . . . 4,167,358 — — 4,167,358 (919,785) 3,247,573
Private Education Loans . . . . . . . 2,103,378 — — 2,103,378 (1,042,869) 1,060,509
Other loans . . . . . . . . . . . . . . . . 80,416 — — 80,416 — 80,416
Cash and investments . . . . . . . . . 594,784 — 15,371 610,155 (143,424) 466,731
Total interest income . . . . . . . . . . . 9,089,168 — 15,371 9,104,539 (2,741,630) 6,362,909
Total interest expense . . . . . . . . . . 7,125,486 19,931 16,275 7,161,692 (2,052,562) 5,109,130
Net interest income (loss) . . . . . . . 1,963,682 (19,931) (904) 1,942,847 (689,068) 1,253,779
Less: provisions for loan losses . . . 644,502 — 606 645,108 (203,978) 441,130
Net interest income (loss) after
provisions for loan losses . . . . . . 1,319,180 (19,931) (1,510) 1,297,739 (485,090) 812,649
Contingency fee revenue . . . . . . . . — 243,865 — 243,865 — 243,865
Collections revenue . . . . . . . . . . . . — 195,268 — 195,268 174 195,442
Guarantor servicing fees . . . . . . . . — — 115,449 115,449 — 115,449
Other income . . . . . . . . . . . . . . . . 149,621 — 162,301 311,922 671,375 983,297
Total other income . . . . . . . . . . . . 149,621 439,133 277,750 866,504 671,549 1,538,053
Restructuring expenses . . . . . . . . . — — — — — —
Operating expenses . . . . . . . . . . . . 517,068 284,180 250,819 1,052,067 58,806 1,110,873
Total expenses . . . . . . . . . . . . . . . 517,068 284,180 250,819 1,052,067 58,806 1,110,873
Income before income taxes and
minority interest in net earnings
of subsidiaries . . . . . . . . . . . . . . 951,733 135,022 25,421 1,112,176 127,653 1,239,829
Income tax expense(1) . . . . . . . . . . 352,141 49,958 9,406 411,505 87,682 499,187
Minority interest in net earnings of
subsidiaries . . . . . . . . . . . . . . . . — 1,778 — 1,778 — 1,778
Net income . . . . . . . . . . . . . . . . . $ 599,592 $ 83,286 $ 16,015 $ 698,893 $ 39,971 $ 738,864
(1)
Income taxes are based on a percentage of net income before tax for the individual reportable segment.
8
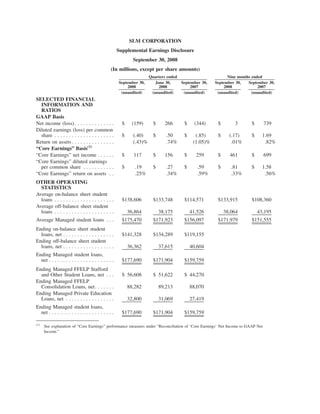
9. SLM CORPORATION
Reconciliation of “Core Earnings” Net Income to GAAP Net Income
(In thousands, except per share amounts)
Quarters ended Nine months ended
September 30, June 30, September 30, September 30, September 30,
2008 2008 2007 2008 2007
(unaudited) (unaudited) (unaudited) (unaudited) (unaudited)
“Core Earnings” net income(A) . . . . . . . $ 116,982 $ 155,642 $ 258,687 $ 460,938 $ 698,893
“Core Earnings” adjustments:
Net impact of securitization accounting . . (148,121) (246,506) (157,050) (473,773) 249,364
Net impact of derivative accounting . . . . (205,991) 450,609 (453,949) (118,750) 55,891
Net impact of Floor Income . . . . . . . . . . (42,721) (18,809) (40,390) (67,107) (118,657)
Net impact of acquired intangibles . . . . . (50,391) (15,342) (18,582) (81,062) (58,945)
Total “Core Earnings” adjustments before
income taxes and minority interest in
net earnings of subsidiaries . . . . . . . . . (447,224) 169,952 (669,971) (740,692) 127,653
Net tax effect(B) . . . . . . . . . . . . . . . . . . 171,701 (59,858) 67,524 283,145 (87,682)
Total “Core Earnings” adjustments . . . . . (275,523) 110,094 (602,447) (457,547) 39,971
GAAP net income (loss) . . . . . . . . . . . . $(158,541) $ 265,736 $(343,760) $ 3,391 $ 738,864
GAAP diluted earnings (loss) per
common share . . . . . . . . . . . . . . . . . . $ (.40) $ .50 $ (.85) $ (.17) $ 1.69
(A)
“Core Earnings” diluted earnings per
$ .27 $ .59 $ .81 $ 1.58
common share . . . . . . . . . . . . . . . . . . $ .19
(B)
Such tax effect is based upon the Company’s “Core Earnings” effective tax rate. For the quarter and nine months ended September 30,
2007, the “Core Earnings” effective tax rate is different than GAAP primarily from the exclusion of the permanent income tax impact
of the equity forward contracts. The Company settled all of its equity forward contracts in January 2008.
“Core Earnings”
In accordance with the Rules and Regulations of the Securities and Exchange Commission (“SEC”), we
prepare financial statements in accordance with generally accepted accounting principles in the United States
of America (“GAAP”). In addition to evaluating the Company’s GAAP-based financial information, manage-
ment evaluates the Company’s business segments on a basis that, as allowed under the Financial Accounting
Standards Board’s Statement of Financial Accounting Standards (“SFAS”) No. 131, “Disclosures about
Segments of an Enterprise and Related Information,” differs from GAAP. We refer to management’s basis of
evaluating our segment results as “Core Earnings” presentations for each business segment and we refer to this
information in our presentations with credit rating agencies and lenders. While “Core Earnings” are not a
substitute for reported results under GAAP, we rely on “Core Earnings” to manage each operating segment
because we believe these measures provide additional information regarding the operational and performance
indicators that are most closely assessed by management.
Our “Core Earnings” are not defined terms within GAAP and may not be comparable to similarly titled
measures reported by other companies. “Core Earnings” net income reflects only current period adjustments to
GAAP net income as described below. Unlike financial accounting, there is no comprehensive, authoritative
guidance for management reporting and as a result, our management reporting is not necessarily comparable
with similar information for any other financial institution. Our operating segments are defined by products
and services or by types of customers, and reflect the manner in which financial information is currently
evaluated by management. Intersegment revenues and expenses are netted within the appropriate financial
statement line items consistent with the income statement presentation provided to management. Changes in
9
10. management structure or allocation methodologies and procedures may result in changes in reported segment
financial information.
Limitations of “Core Earnings”
While GAAP provides a uniform, comprehensive basis of accounting, for the reasons described above,
management believes that “Core Earnings” are an important additional tool for providing a more complete
understanding of the Company’s results of operations. Nevertheless, “Core Earnings” are subject to certain
general and specific limitations that investors should carefully consider. For example, as stated above, unlike
financial accounting, there is no comprehensive, authoritative guidance for management reporting. Our “Core
Earnings” are not defined terms within GAAP and may not be comparable to similarly titled measures
reported by other companies. Unlike GAAP, “Core Earnings” reflect only current period adjustments to GAAP.
Accordingly, the Company’s “Core Earnings” presentation does not represent a comprehensive basis of
accounting. Investors, therefore, may not compare our Company’s performance with that of other financial
services companies based upon “Core Earnings.” “Core Earnings” results are only meant to supplement GAAP
results by providing additional information regarding the operational and performance indicators that are most
closely used by management, the Company’s board of directors, rating agencies and lenders to assess
performance.
Other limitations arise from the specific adjustments that management makes to GAAP results to derive
“Core Earnings” results. For example, in reversing the unrealized gains and losses that result from
SFAS No. 133, “Accounting for Derivative Instruments and Hedging Activities,” on derivatives that do not
qualify for “hedge treatment,” as well as on derivatives that do qualify but are in part ineffective because they
are not perfect hedges, we focus on the long-term economic effectiveness of those instruments relative to the
underlying hedged item and isolate the effects of interest rate volatility, changing credit spreads and changes
in our stock price on the fair value of such instruments during the period. Under GAAP, the effects of these
factors on the fair value of the derivative instruments (but not on the underlying hedged item) tend to show
more volatility in the short term. While presentation of our results on a “Core Earnings” basis provides
important information regarding the performance of our Managed loan portfolio, a limitation of this
presentation is that we present the ongoing spread income on loans that have been sold to a trust we manage.
While we believe that our “Core Earnings” presentation presents the economic substance of our Managed loan
portfolio, it understates earnings volatility from securitization gains. Our “Core Earnings” results exclude
certain Floor Income, which is cash income, from our reported results and therefore may understate earnings
in certain periods. Management’s financial planning and valuation of operating results, however, does not take
into account Floor Income because of its inherent uncertainty, except when it is economically hedged through
Floor Income Contracts.
Pre-Tax Differences between “Core Earnings” and GAAP
Our “Core Earnings” are the primary financial performance measures used by management to evaluate
performance and to allocate resources. Accordingly, financial information is reported to management on a
“Core Earnings” basis by reportable segment, as these are the measures used regularly by our chief operating
decision makers. Our “Core Earnings” are used in developing our financial plans, tracking results, and
establishing corporate performance targets. Management believes this information provides additional insight
into the financial performance of the Company’s core business activities. “Core Earnings” net income reflects
only current period adjustments to GAAP net income, as described in the more detailed discussion of the
differences between “Core Earnings” and GAAP that follows, which includes further detail on each specific
adjustment required to reconcile our “Core Earnings” segment presentation to our GAAP earnings.
1) Securitization Accounting: Under GAAP, certain securitization transactions in our Lending operating
segment are accounted for as sales of assets. Under “Core Earnings” for the Lending operating
segment, we present all securitization transactions on a “Core Earnings” basis as long-term non-
recourse financings. The upfront “gains” on sale from securitization transactions, as well as ongoing
“servicing and securitization revenue” presented in accordance with GAAP, are excluded from “Core
Earnings” and are replaced by interest income, provisions for loan losses, and interest expense as
10
11. earned or incurred on the securitization loans. We also exclude transactions with our off-balance sheet
trusts from “Core Earnings” as they are considered intercompany transactions on a “Core Earnings”
basis.
2) Derivative Accounting: “Core Earnings” exclude periodic unrealized gains and losses that are caused
primarily by the one-sided mark-to-market derivative valuations prescribed by SFAS No. 133 on
derivatives that do not qualify for “hedge treatment” under GAAP. These unrealized gains and losses
occur in our Lending operating segment, and occurred in our Corporate and Other reportable segment
related to equity forward contracts for the year-ago quarters. In our “Core Earnings” presentation, we
recognize the economic effect of these hedges, which generally results in any cash paid or received
being recognized ratably as an expense or revenue over the hedged item’s life. “Core Earnings” also
exclude the gain or loss on equity forward contracts that under SFAS No. 133, are required to be
accounted for as derivatives and are marked to market through earnings. The Company settled all of
its equity forward contracts in January 2008.
3) Floor Income: The timing and amount (if any) of Floor Income earned in our Lending operating
segment is uncertain and in excess of expected spreads. Therefore, we exclude such income from
“Core Earnings” when it is not economically hedged. We employ derivatives, primarily Floor Income
Contracts and futures, to economically hedge Floor Income. As discussed above in “Derivative
Accounting,” these derivatives do not qualify as effective accounting hedges, and therefore, under
GAAP, are marked to market through the “gains (losses) on derivative and hedging activities, net” line
in the consolidated statement of income with no offsetting gain or loss recorded for the economically
hedged items. For “Core Earnings,” we reverse the fair value adjustments on the Floor Income
Contracts and futures economically hedging Floor Income and include the amortization of net
premiums received in income.
4) Acquired Intangibles: Our “Core Earnings” exclude goodwill and intangible impairment and the
amortization of acquired intangibles.
11
12. SLM CORPORATION
SUPPLEMENTAL FINANCIAL INFORMATION RELEASE
THIRD QUARTER 2008
(Dollars in millions, except per share amounts, unless otherwise stated)
The following information (the “Supplemental Financial Information Release” or “Release”) should be
read in connection with SLM Corporation’s (the “Company’s”) press release for third quarter 2008 earnings,
dated October 22, 2008.
The Supplemental Financial Information Release contains forward-looking statements and information
based on management’s current expectations as of the date of the Release. Statements that are not historical
facts, including statements about our beliefs or expectations and statements that assume or are dependent upon
future events, are forward-looking statements. Forward-looking statements are subject to risks, uncertainties,
assumptions and other factors that may cause actual results to be materially different from those reflected in
such forward-looking statements. These factors include, among others, the occurrence of any event, change or
other circumstances that could give rise to our ability to cost-effectively refinance asset-backed financing
facilities due February 2009, (collectively, the “2008 Asset-Backed Financing Facilities”), including any
potential foreclosure on the student loans under those facilities following their termination; increased financing
costs; limited liquidity; any adverse outcomes in any significant litigation to which we are a party; our
derivative counterparties terminating their positions with the Company if permitted by their contracts and the
Company substantially incurring additional costs to replace any terminated positions; changes in the terms of
student loans and the educational credit marketplace (including changes resulting from new laws and
regulations and from the implementation of applicable laws and regulations) which, among other things, may
reduce the volume, average term and yields on student loans under the Federal Family Education Loan
Program (“FFELP”), may result in loans being originated or refinanced under non-FFELP programs, or may
affect the terms upon which banks and others agree to sell FFELP loans to the Company. The Company could
also be affected by: the implementation of the Emergency Economic Stabilization Act of 2008, changes in the
demand for educational financing or in financing preferences of lenders, educational institutions, students and
their families; incorrect estimates or assumptions by management in connection with the preparation of our
consolidated financial statements; changes in the composition of our Managed FFELP and Private Education
Loan portfolios; changes in the general interest rate environment and in the securitization markets for
education loans, which may increase the costs or limit the availability of financings necessary to initiate,
purchase or carry education loans; changes in projections of losses from loan defaults; changes in general
economic conditions; changes in prepayment rates and credit spreads; and changes in the demand for debt
management services and new laws or changes in existing laws that govern debt management services. All
forward-looking statements contained in the Release are qualified by these cautionary statements and are made
only as of the date this Release is filed. The Company does not undertake any obligation to update or revise
these forward-looking statements to conform the statement to actual results or changes in the Company’s
expectations.
Definitions for capitalized terms in this document can be found in the Company’s 2007 Form 10-K filed
with the Securities and Exchange Commission (“SEC”) on February 29, 2008.
Certain reclassifications have been made to the balances as of and for the quarters ended September 30,
2007, to be consistent with classifications adopted for the quarter ended September 30, 2008.
12
13. DISCUSSION OF CONSOLIDATED RESULTS OF OPERATIONS
Three Months Ended September 30, 2008 Compared to Three Months Ended June 30, 2008
For the three months ended September 30, 2008, the Company’s net loss was $159 million or $.40 diluted
loss per share, compared to net income of $266 million, or $.50 diluted earnings per share, for the three
months ended June 30, 2008. The effective tax rate for those periods was 40 percent and 36 percent,
respectively. Pre-tax income decreased by $684 million from the prior quarter primarily due to $242 million in
net losses on derivative and hedging activities versus $362 million net gains on derivative and hedging
activities in the prior quarter. The $604 million decrease in net gains (losses) on derivative and hedging
activities from the prior quarter was primarily due to changes in interest rates. In the second quarter, the
Company experienced a $569 million unrealized gain on Floor Income Contracts as a result of a significant
increase in interest rates; in the third quarter, interest rates were relatively unchanged.
There were no gains on student loan securitizations in either the second or third quarters of 2008 as the
Company did not complete any off-balance sheet securitizations. The Company adopted SFAS No. 159, “The
Fair Value Option for Financial Assets and Financial Liabilities — Including an Amendment of FASB
Statement No. 115,” on January 1, 2008, and elected the fair value option on all of the Residual Interests
effective January 1, 2008. The Company made this election in order to simplify the accounting for Residual
Interests by having all Residual Interests under one accounting model. Prior to this election, Residual Interests
were accounted for either under SFAS No. 115, “Accounting for Certain Investments in Debt and Equity
Securities,” with changes in fair value recorded through other comprehensive income or under SFAS No. 155,
“Accounting for Certain Hybrid Financial Instruments,” with changes in fair value recorded through income.
The Company reclassified the related accumulated other comprehensive income of $195 million into retained
earnings and as a result equity was not impacted at transition on January 1, 2008. Changes in fair value of
Residual Interests on and after January 1, 2008 are recorded through servicing and securitization income. The
Company has not elected the fair value option for any other financial instruments at this time. Servicing and
securitization revenue increased by $63 million from $2 million in the second quarter of 2008 to $65 million
in the third quarter of 2008. This increase was primarily due to a current-quarter $81 million unrealized mark-
to-market loss on the Company’s Residual Interests recorded under SFAS No. 159 compared to a prior-quarter
$192 million unrealized mark-to-market loss on the Company’s Residual Interests recorded under
SFAS No. 159. See “LIQUIDITY AND CAPITAL RESOURCES — Retained Interest in Securitized Receiv-
ables” for further discussion of the factors impacting this mark-to-market.
Net interest income after provisions for loan losses increased by $28 million in the third quarter of 2008
over the second quarter. This increase was due to a $72 million increase in net interest income, offset by a
$44 million increase in provisions for loan losses. The increase in net interest income was primarily due to an
increase in the student loan spread (see “LENDING BUSINESS SEGMENT — Net Interest Income — Net
Interest Margin — On-Balance Sheet”). The increase in provisions for loan losses relates primarily to increases
in delinquencies on both FFELP loans and Private Education Loans (see “LENDING BUSINESS
SEGMENT — Private Education Loan Losses — Private Education Loan Delinquencies and Forbearance”
and “— Allowance for Private Education Loan Losses”) primarily as a result of the continued weakening of
the U.S. economy.
In the third quarter of 2008, fee and other income and collections revenue totaled $49 million, a
$194 million decrease from $243 million in the prior quarter. This decrease was primarily the result of
$147 million of impairment related to declines in the fair value of mortgage loans and real estate held by the
Company’s mortgage purchased paper subsidiary and $95 of impairment related to the Company’s non-
mortgage purchased paper subsidiary (see “ASSET PERFORMANCE GROUP BUSINESS SEGMENT”).
The Company is restructuring its business in response to the impact of The College Cost Reduction and
Access Act of 2007 (“CCRAA”), and current challenges in the capital markets. As part of the Company’s cost
reduction efforts, restructuring expenses of $11 million and $47 million were recognized in the current quarter
and prior quarter, respectively. The majority of these restructuring expenses were severance costs related to the
aggregate of the completed and planned elimination of approximately 2,500 positions, or approximately
23 percent of the workforce. Cumulative restructuring expenses from the fourth quarter of 2007 through the
13
14. third quarter of 2008 totaled $100 million. The Company estimates an additional $16 million of restructuring
expenses associated with its current cost reduction efforts will be incurred in future periods.
Operating expenses were $367 million in the third quarter of 2008 compared to $348 million in the
second quarter of 2008, excluding $6 million of reorganization-related asset impairments recognized in the
second quarter of 2008. As discussed in “ASSET PERFORMANCE GROUP BUSINESS SEGMENT,” the
Company has decided to wind down its purchased paper businesses. This decision resulted in a $36 million
impairment of intangible assets in the third quarter of 2008. The offsetting $17 million decrease in operating
expenses was primarily due to the Company’s cost reduction efforts discussed above.
Three Months Ended September 30, 2008 Compared to Three Months Ended September 30, 2007
For the three months ended September 30, 2008, the Company’s net loss was $159 million or $.40 diluted
loss per share, compared to a net loss of $344 million, or $.85 diluted loss per share, for the three months
ended September 30, 2007. The effective tax rate for those periods was 40 percent and (33) percent,
respectively. The movement in the effective tax rate was primarily driven by the permanent tax impact of
excluding non-taxable gains and losses on equity forward contracts which were marked to market through
earnings under SFAS No. 133 in 2007. The Company settled all of its outstanding equity forward contracts in
January 2008. For the three months ended September 30, 2008, the Company’s pre-tax loss was $262 million
compared to a pre-tax loss of $259 million in the year-ago quarter. The increase in pre-tax loss of $3 million
was primarily due to current-quarter impairment charges of $242 million related to the Company’s purchased
paper businesses discussed below (see also “ASSET PERFORMANCE GROUP BUSINESS SEGMENT”),
offset by a decrease in net losses on derivative and hedging activities from $487 million in the year-ago
quarter to $242 million in the third quarter of 2008, which was primarily a result of the mark-to-market on the
equity forwards.
There were no gains on student loan securitizations in either the third quarter of 2008 or the year-ago
quarter as the Company did not complete any off-balance sheet securitizations in those periods. Servicing and
securitization revenue increased by $36 million from $29 million in the third quarter of 2007 to $65 million in
the third quarter of 2008. This increase was primarily due to a current-quarter $81 million unrealized mark-to-
market loss recorded under SFAS No. 159 compared to a year-ago quarter $152 million unrealized mark-to-
market loss, which included $90 million of impairment and a $62 million unrealized mark-to-market loss
recorded under SFAS No. 155. See “LIQUIDITY AND CAPITAL RESOURCES — Retained Interest in
Securitized Receivables” for further discussion of the factors impacting the fair values.
Net interest income after provisions for loan losses decreased by $11 million in the third quarter from the
year-ago quarter. This decrease was due to a $44 million increase in provisions for loan losses, offset by a
$33 million increase in net interest income. The increase in net interest income was primarily due to an
increase in the student loan spread (see “LENDING BUSINESS SEGMENT — Net Interest Income — Net
Interest Margin — On-Balance Sheet”) and a $24 billion increase in the average balance of on-balance sheet
student loans, partially offset by an increase in the 2008 Asset-Backed Financing Facilities Fees. The increase
in provisions for loan losses relates primarily to increases in delinquencies on both FFELP loans and Private
Education Loans (see “LENDING BUSINESS SEGMENT — Private Education Loan Losses — Private
Education Loan Delinquencies and Forbearance” and “— Allowance for Private Education Loan Losses”)
primarily as a result of the continued weakening of the U.S. economy.
In the third quarter of 2008, fee and other income and collections revenue totaled $49 million, a
$233 million decrease from $282 million in the year-ago quarter. This decrease was primarily the result of
$147 million of impairment related to declines in the fair value of mortgage loans and real estate held by the
Company’s mortgage purchased paper subsidiary and $95 of impairment related to the Company’s non-
mortgage purchased paper subsidiary recorded in the third quarter of 2008 (see “ASSET PERFORMANCE
GROUP BUSINESS SEGMENT”).
Restructuring expenses of $11 million were recognized in the third quarter of 2008, as previously
discussed, with no such expenses recognized in the year-ago quarter.
14
15. Operating expenses were $367 million in the third quarter of 2008 compared to $356 million in the third
quarter of 2007. As discussed in “ASSET PERFORMANCE GROUP BUSINESS SEGMENT,” the Company
has decided to wind down its purchased paper businesses. This decision resulted in a $36 million impairment
of intangible assets in the third quarter of 2008. The offsetting $25 million decrease in operating expenses
included a $4 million reduction in Merger-related professional fees, with the remaining $21 million reduction
primarily related to the Company’s cost reduction efforts discussed above.
Nine Months Ended September 30, 2008 Compared to Nine Months Ended September 30, 2007
For the nine months ended September 30, 2008, the Company’s net income was $3 million or $.17
diluted loss per share, compared to net income of $739 million, or $1.69 diluted earnings per share, for the
nine months ended September 30, 2007. The effective tax rate for those periods was 206 percent and
40 percent, respectively. The movement in the effective tax rate was primarily driven by the impact of
permanent tax item differences on lower financial accounting income in the nine months ended September 30,
2008 versus the nine months ended September 30, 2007. Pre-tax income decreased by $1.2 billion versus the
year-ago period primarily due to an increase in net losses on derivative and hedging activities from $23 million
in the nine months ended September 30, 2007 to $153 million in the nine months ended September 30, 2008,
a decrease in servicing and securitization revenue and gains on student loan securitizations, and current-quarter
impairment charges of $242 million related to the Company’s purchased paper businesses discussed below (see
also “ASSET PERFORMANCE GROUP BUSINESS SEGMENT”).
There were no gains on student loan securitizations in the nine months ended September 30, 2008
compared to gains of $367 million in the year-ago period. The Company did not complete any off-balance
sheet securitizations in the nine months ended September 30, 2008, versus one Private Education Loan
securitization in the year-ago period. Servicing and securitization revenue decreased by $240 million from
$414 million in the nine months ended 2007 to $174 million in the current period. This decrease was primarily
due to a $361 million unrealized mark-to-market loss recorded under SFAS No. 159 in the nine months ended
September 30, 2008 compared to a $142 million unrealized mark-to-market loss in the nine months ended
September 30, 2007, which included both impairment and an unrealized mark-to-market gain recorded under
SFAS No. 155. See “LIQUIDITY AND CAPITAL RESOURCES — Retained Interest in Securitized Receiv-
ables” for further discussion of the factors impacting the fair values.
Net interest income after provisions for loan losses decreased by $126 million in the nine months ended
September 30, 2008 from the year-ago period. This decrease was due to a $100 million decrease in net interest
income and a $26 million increase in provisions for loan losses. The decrease in net interest income was
primarily due to a decrease in the student loan spread (see “LENDING BUSINESS SEGMENT — Net Interest
Income — Net Interest Margin — On-Balance Sheet”) and an increase in the 2008 Asset-Backed Facilities
Financing Fees.
For the nine months ended September 30, 2008, fee and other income and collections revenue totaled
$562 million, a $285 million decrease from $847 million in the year-ago period. This decrease was primarily
the result of $147 million of impairment related to declines in the fair value of mortgage loans and real estate
held by the Company’s mortgage purchased paper subsidiary and $95 million of impairment related to the
Company’s non-mortgage purchased paper subsidiary recorded in the third quarter of 2008 (see “ASSET
PERFORMANCE GROUP BUSINESS SEGMENT”).
Restructuring expenses of $78 million were recognized in the nine months ended September 30, 2008, as
previously discussed, with no such expenses recognized in the year-ago period.
Operating expenses totaled $1.1 billion in each of the nine month periods ended September 30, 2008 and
September 30, 2007. Excluding non-recurring items related to intangible and other reorganization-related asset
impairments recognized in the nine months ended September 30, 2008 and Merger-related professional fees
and intangible impairments recognized in the nine months ended September 30, 2007, operating expenses
decreased $28 million over the year-ago period primarily due to the Company’s cost reduction efforts
discussed above.
15
16. Other Income
The following table summarizes the components of “Other income” in the consolidated statements of
income for the quarters ended September 30, 2008, June 30, 2008 and September 30, 2007 and for the nine
months ended September 30, 2008 and 2007.
Quarters ended Nine months ended
September 30, June 30, September 30, September 30, September 30,
2008 2008 2007 2008 2007
Late fees and forbearance fees. . . $36 $ 34 $ 34 $107 $102
Asset servicing and other
transaction fees . . . . . . . . . . . . 28 26 28 80 78
Loan servicing fees . . . . . . . . . . . 6 6 7 19 20
Gains on sales of mortgages and
other loan fees . . . . . . . . . . . . 1 1 2 2 10
Other . . . . . . . . . . . . . . . . . . . . . 23 42 36 87 82
Total other income . . . . . . . . . . . $94 $109 $107 $295 $292
The decrease in other income for the three months ended September 30, 2008 compared to the prior
quarter was primarily due to the Company repurchasing less of its unsecured debt with short-term maturities
in the third quarter of 2008 compared to the second quarter of 2008, which resulted in fewer recognized gains
in the current quarter. Also contributing to the decrease in other income was a currency translation loss
recorded in connection with the Company’s international non-mortgage purchased paper business as a result of
the U.S. dollar strengthening during the quarter. The Company hedges this exposure with derivatives. An
offsetting gain was recognized during the quarter in the “gains (losses) on derivative and hedging activities,
net” line of the income statement. See “ASSET PERFORMANCE GROUP BUSINESS SEGMENT” for
discussion regarding the expected sale of this business.
16
17. EARNINGS RELEASE SUMMARY
The following table summarizes GAAP income statement items (on a tax-effected basis) that are
disclosed separately in the Company’s press releases of earnings or the Company’s quarterly earnings
conference calls for the quarters ended September 30, 2008, June 30, 2008, and September 30, 2007, and for
the nine months ended September 30, 2008 and 2007.
Quarters ended Nine months ended
September 30, June 30, September 30, September 30, September 30,
(in thousands) 2008 2008 2007 2008 2007
Reported net income (loss) . . . . . . . . . . . . $(158,541) $265,736 $(343,760) $ 3,391 $738,864
Preferred stock dividends . . . . . . . . . . . . . (27,474) (27,391) (9,274) (83,890) (27,523)
Reported net income (loss) attributable to
common stock . . . . . . . . . . . . . . . . . . . (186,015) 238,345 (353,034) (80,499) 711,341
Expense items disclosed separately (tax-
effected):
Merger-related financing fees(1) . . . . . . . . . — — 10,791 — 19,630
Merger-related professional fees and other
costs. . . . . . . . . . . . . . . . . . . . . . . . . . — — 2,580 — 26,170
Restructuring expenses . . . . . . . . . . . . . . . 6,620 29,446 — 49,093 —
Other reorganization-related asset
impairments . . . . . . . . . . . . . . . . . . . . 226 3,779 — 4,005 —
Impact to FFELP provision for loan losses
due to legislative changes . . . . . . . . . . . — — 18,748 — 18,748
De-acceleration of premium amortization
expense on loans(2) . . . . . . . . . . . . . . . . (56,868) — — (56,868) —
Acceleration of premium amortization
expense on loans(3) . . . . . . . . . . . . . . . . — — — 34,142 —
Total expense items disclosed separately
(tax-effected) . . . . . . . . . . . . . . . . . . . . (50,022) 33,225 32,119 30,372 64,548
Net income (loss) attributable to common
stock excluding the impact of items
disclosed separately . . . . . . . . . . . . . . . (236,037) 271,570 (320,915) (50,127) 775,889
Adjusted for dividends of convertible
preferred stock series C(4) . . . . . . . . . . . — 20,844 — — —
Net income (loss) attributable to common
stock excluding the impact of items
disclosed separately, adjusted . . . . . . . . $(236,037) $292,414 $(320,915) $ (50,127) $775,889
Average common and common equivalent
shares outstanding(5) . . . . . . . . . . . . . . . 466,646 517,954 412,944 466,625 420,305
(1)
Merger-related financing fees are the commitment and liquidity fees related to the financing facility in connection with the Merger
Agreement, now terminated.
(2)
The Company decreased the prepayment speed assumptions used to amortize premiums on FFELP Stafford and Consolidation loans,
as a result of a significant decrease in prepayment activity experienced in the third quarter of 2008. This decrease in prepayment
activity, which the Company expects will continue into the foreseeable future, was primarily due to a reduction in third-party consoli-
dation activity as a result of the CCRAA and the current U.S. economic and credit environment. Decreasing the prepayment speeds
has the effect of lengthening the assumed lives of these loans and resulted in a one-time, cumulative catch-up adjustment to reverse
prior premium expense. The adjustment in the table above is primarily related to this change.
(3)
The Company’s decision to cease consolidating FFELP Stafford loans and Consolidation Loans for the foreseeable future (considering
the CCRAA’s impact on the economics of a Consolidation Loan as well as the Company’s increased cost of funds given the current
credit market environment) resulted in a one-time, cumulative catch-up adjustment in premium amortization expense, due to shorten-
ing the assumed average lives of Stafford loans, which previously had an assumption that a portion of the underlying Stafford loans
would consolidate internally, extending the average life of such loans. Consolidation Loans generally have longer terms to maturity
than Stafford loans.
(4)
There was no impact on diluted earnings (loss) per common share for the current quarter and the nine months ended September 30,
2008, because the effect of the assumed conversion was anti-dilutive. The convertible preferred stock series C was issued in the fourth
quarter of 2007.
(5)
Common equivalent shares outstanding were anti-dilutive for the quarter and nine months ended September 30, 2008.
17
18. The following table summarizes “Core Earnings” income statement items (on a tax-effected basis) that
are disclosed separately in the Company’s press releases of earnings or the Company’s quarterly earnings
conference calls for the quarters ended September 30, 2008, June 30, 2008, and September 30, 2007 and for
the nine months ended September 30, 2008 and 2007.
Quarters ended Nine months ended
September 30, June 30, September 30, September 30, September 30,
(in thousands) 2008 2008 2007 2008 2007
“Core Earnings” net income . . . . . . . . . . . . $116,982 $155,642 $258,687 $460,938 $698,893
Preferred stock dividends . . . . . . . . . . . . . . (27,474) (27,391) (9,274) (83,890) (27,523)
“Core Earnings” net income attributable to
common stock . . . . . . . . . . . . . . . . . . . . . 89,508 128,251 249,413 377,048 671,370
Expense items disclosed separately (tax-
effected):
Merger-related financing fees(1) . . . . . . . . . . — — 10,791 — 19,630
Merger-related professional fees and other
costs . . . . . . . . . . . . . . . . . . . . . . . . . . . . — — 2,580 — 26,170
Restructuring expenses . . . . . . . . . . . . . . . . 6,620 29,446 — 49,093 —
Other reorganization-related asset
impairments . . . . . . . . . . . . . . . . . . . . . . 226 3,779 — 4,005 —
Impact to FFELP provision for loan losses
due to legislative changes . . . . . . . . . . . . — — 27,726 — 27,726
De-acceleration of premium amortization
expense on loans(2) . . . . . . . . . . . . . . . . . (74,138) — — (74,138) —
Acceleration of premium amortization
expense on loans(3) . . . . . . . . . . . . . . . . . — — — 51,777 —
Total expense items disclosed separately
(tax-effected). . . . . . . . . . . . . . . . . . . . . . (67,292) 33,225 41,097 30,737 73,526
Net income attributable to common stock
excluding the impact of items disclosed
separately . . . . . . . . . . . . . . . . . . . . . . . . 22,216 161,476 290,510 407,785 744,896
Adjusted for debt expense of contingently
convertible debt instruments, net of
tax(4) . . . . . . . . . . . . . . . . . . . . . . . . . . . . — — 4,662 — —
Net income attributable to common stock
excluding the impact of items disclosed
separately, adjusted . . . . . . . . . . . . . . . . . $ 22,216 $161,476 $295,172 $407,785 $744,896
Average common and common equivalent
shares outstanding . . . . . . . . . . . . . . . . . . 467,178 467,385 431,750 467,270 424,771
(1)
Merger-related financing fees are the commitment and liquidity fees related to the financing facility in connection with the Merger
Agreement, now terminated.
(2)
The Company decreased the prepayment speed assumptions used to amortize premiums on FFELP Stafford and Consolidation loans,
as a result of a significant decrease in prepayment activity experienced in the third quarter of 2008. This decrease in prepayment
activity, which the Company expects will continue into the foreseeable future, was primarily due to a reduction in third-party consoli-
dation activity as a result of the CCRAA and the current U.S. economic and credit environment. Decreasing the prepayment speeds
has the effect of lengthening the assumed lives of these loans and resulted in a one-time, cumulative catch-up adjustment to reverse
prior premium expense. The adjustment in the table above is primarily related to this change.
(3)
The Company’s decision to cease consolidating FFELP Stafford loans and Consolidation Loans for the foreseeable future (considering
the CCRAA’s impact on the economics of a Consolidation Loan as well as the Company’s increased cost of funds given the current
credit market environment) resulted in a one-time, cumulative catch-up adjustment in premium amortization expense, due to shorten-
ing the assumed average lives of Stafford loans, which previously had an assumption that a portion of the underlying Stafford loans
would consolidate internally, extending the average life of such loans. Consolidation Loans generally have longer terms to maturity
than Stafford loans.
(4)
There was no impact on diluted earnings per common share for the nine months ended September 30, 2007, because the effect of the
assumed conversion was anti-dilutive. The Co-Cos were called at par on July 25, 2007.
18
19. BUSINESS SEGMENTS
The results of operations of the Company’s Lending, Asset Performance Group (“APG”), and Corporate
and Other business segments are presented below, using our “Core Earnings” presentation.
The Lending business segment section includes all discussion of income and related expenses associated
with the net interest margin, the student loan spread and its components, the provisions for loan losses, and
other fees earned on our Managed portfolio of student loans. The APG business segment reflects the fees
earned and expenses incurred in providing accounts receivable management and collection services. Our
Corporate and Other business segment includes our remaining fee businesses and other corporate expenses that
do not pertain directly to the primary segments identified above.
As previously discussed, on January 1, 2008, the Company adopted SFAS No. 157, “Fair Value
Measurements,” and SFAS No. 159, “The Fair Value Option for Financial Assets and Financial Liabilities —
Including an Amendment of FASB Statement No. 115.” The fair value adjustments of the items impacted by
SFAS No. 157 and SFAS No. 159 under GAAP are not included in “Core Earnings” net income and therefore
the adoption of SFAS No. 157 and SFAS No. 159 did not impact the “Core Earnings” presentation for the
three or nine months ended September 30, 2008.
Pre-tax Differences between “Core Earnings” and GAAP
Our “Core Earnings” are the primary financial performance measures used by management to evaluate
performance and to allocate resources. Accordingly, financial information is reported to management on a
“Core Earnings” basis by reportable segment, as these are the measures used regularly by our chief operating
decision makers. Our “Core Earnings” are used in developing our financial plans, tracking results, and
establishing corporate performance targets. Management believes this information provides additional insight
into the financial performance of the Company’s core business activities. “Core Earnings” net income reflects
only current period adjustments to GAAP net income, as described in the more detailed discussion of the
differences between “Core Earnings” and GAAP that follows, which includes further detail on each specific
adjustment required to reconcile our “Core Earnings” segment presentation to our GAAP earnings.
1) Securitization Accounting: Under GAAP, certain securitization transactions in our Lending operating
segment are accounted for as sales of assets. Under “Core Earnings” for the Lending operating
segment, we present all securitization transactions on a “Core Earnings” basis as long-term non-
recourse financings. The upfront “gains” on sale from securitization transactions, as well as ongoing
“servicing and securitization revenue” presented in accordance with GAAP, are excluded from “Core
Earnings” and are replaced by interest income, provisions for loan losses, and interest expense as
earned or incurred on the securitization loans. We also exclude transactions with our off-balance sheet
trusts from “Core Earnings” as they are considered intercompany transactions on a “Core Earnings”
basis.
19
20. The following table summarizes “Core Earnings” securitization adjustments for the Lending operating
segment for the quarters ended September 30, 2008, June 30, 2008, and September 30, 2007 and for
the nine months ended September 30, 2008 and 2007.
Quarters ended Nine months ended
September 30, June 30, September 30, September 30, September 30,
2008 2008 2007 2008 2007
“Core Earnings” securitization
adjustments:
Net interest income on securitized
loans, before provisions for loan
losses and before intercompany
transactions . . . . . . . . . . . . . . . . . . $(245) $(256) $(215) $(694) $(649)
Provisions for loan losses . . . . . . . . . 76 49 57 169 204
Net interest income on securitized
loans, after provisions for loan
losses, before intercompany
transactions . . . . . . . . . . . . . . . . . . (169) (207) (158) (525) (445)
Intercompany transactions with off-
balance sheet trusts . . . . . . . . . . . . (44) (42) (28) (123) (87)
Net interest income on securitized
loans, after provisions for loan
losses . . . . . . . . . . . . . . . . . . . . . . (213) (249) (186) (648) (532)
Gains on student loan
securitizations . . . . . . . . . . . . . . . . — — — — 367
Servicing and securitization
revenue . . . . . . . . . . . . . . . . . . . . . 65 2 29 174 414
Total “Core Earnings” securitization
adjustments(1) . . . . . . . . . . . . . . . . $(148) $(247) $(157) $(474) $ 249
(1)
Negative amounts are subtracted from “Core Earnings” net income to arrive at GAAP net income
and positive amounts are added to “Core Earnings” net income to arrive at GAAP net income.
“Intercompany transactions with off-balance sheet trusts” in the above table relate primarily to losses
incurred through the repurchase of delinquent loans from our off-balance sheet securitization trusts.
When Private Education Loans in our securitization trusts settling before September 30, 2005, become
180 days delinquent, we have typically exercised our contingent call option to repurchase these loans
at par value out of the trust and record a loss for the difference in the par value paid and the fair
market value of the loan at the time of purchase. We do not hold the contingent call option for any
trusts settled after September 30, 2005.
2) Derivative Accounting: “Core Earnings” exclude periodic unrealized gains and losses that are caused
primarily by the one-sided mark-to-market derivative valuations prescribed by SFAS No. 133 on
derivatives that do not qualify for “hedge treatment” under GAAP. These unrealized gains and losses
occur in our Lending operating segment, and occurred in our Corporate and Other reportable segment
related to equity forward contracts in the year-ago quarters. In our “Core Earnings” presentation, we
recognize the economic effect of these hedges, which generally results in any cash paid or received
being recognized ratably as an expense or revenue over the hedged item’s life. “Core Earnings” also
exclude the gain or loss on equity forward contracts that under SFAS No. 133, are required to be
accounted for as derivatives and are marked-to-market through earnings.
SFAS No. 133 requires that changes in the fair value of derivative instruments be recognized currently
in earnings unless specific hedge accounting criteria, as specified by SFAS No. 133, are met. We
believe that our derivatives are effective economic hedges, and as such, are a critical element of our
20
21. interest rate risk management strategy. However, some of our derivatives, primarily Floor Income
Contracts, certain basis swaps and equity forward contracts (discussed in detail below), do not qualify
for “hedge treatment” as defined by SFAS No. 133, and the stand-alone derivative must be marked-to-
market in the income statement with no consideration for the corresponding change in fair value of the
hedged item. The gains and losses described in “Gains (losses) on derivative and hedging activities,
net” are primarily caused by interest rate and foreign currency exchange rate volatility, changing credit
spreads and changes in our stock price during the period as well as the volume and term of derivatives
not receiving hedge treatment.
Our Floor Income Contracts are written options that must meet more stringent requirements than other
hedging relationships to achieve hedge effectiveness under SFAS No. 133. Specifically, our Floor
Income Contracts do not qualify for hedge accounting treatment because the paydown of principal of
the student loans underlying the Floor Income embedded in those student loans does not exactly match
the change in the notional amount of our written Floor Income Contracts. Under SFAS No. 133, the
upfront payment is deemed a liability and changes in fair value are recorded through income
throughout the life of the contract. The change in the value of Floor Income Contracts is primarily
caused by changing interest rates that cause the amount of Floor Income earned on the underlying
student loans and paid to the counterparties to vary. This is economically offset by the change in value
of the student loan portfolio, including our Retained Interests, earning Floor Income but that offsetting
change in value is not recognized under SFAS No. 133. We believe the Floor Income Contracts are
economic hedges because they effectively fix the amount of Floor Income earned over the contract
period, thus eliminating the timing and uncertainty that changes in interest rates can have on Floor
Income for that period. Prior to SFAS No. 133, we accounted for Floor Income Contracts as hedges
and amortized the upfront cash compensation ratably over the lives of the contracts.
Basis swaps are used to convert floating rate debt from one floating interest rate index to another to
better match the interest rate characteristics of the assets financed by that debt. We primarily use basis
swaps to change the index of our floating rate debt to better match the cash flows of our student loan
assets that are primarily indexed to a commercial paper, Prime or Treasury bill index. In addition, we
use basis swaps to convert debt indexed to the Consumer Price Index to three-month LIBOR debt.
SFAS No. 133 requires that when using basis swaps, the change in the cash flows of the hedge
effectively offset both the change in the cash flows of the asset and the change in the cash flows of
the liability. Our basis swaps hedge variable interest rate risk, however they generally do not meet this
effectiveness test because most of our FFELP student loans can earn at either a variable or a fixed
interest rate depending on market interest rates. We also have basis swaps that do not meet the
SFAS No. 133 effectiveness test that economically hedge off-balance sheet instruments. As a result,
under GAAP these swaps are recorded at fair value with changes in fair value reflected currently in
the income statement.
Under SFAS No. 150, “Accounting for Certain Financial Instruments with Characteristics of both
Liabilities and Equity,” equity forward contracts that allow a net settlement option either in cash or the
Company’s stock are required to be accounted for as derivatives in accordance with SFAS No. 133. As
a result, we account for our equity forward contracts as derivatives in accordance with SFAS No. 133
and mark them to market through earnings. They do not qualify as effective SFAS No. 133 hedges, as
a requirement to achieve hedge accounting is the hedged item must impact net income and the
settlement of these contracts through the purchase of our own stock does not impact net income. The
Company settled all of its equity forward contracts in January 2008.
21
22. The table below quantifies the adjustments for derivative accounting under SFAS No. 133 on net
income for the quarters ended September 30, 2008, June 30, 2008, and September 30, 2007, and for
the nine months ended September 30, 2008 and 2007, when compared with the accounting principles
employed in all years prior to the SFAS No. 133 implementation.
Quarters ended Nine months ended
September 30, June 30, September 30, September 30, September 30,
2008 2008 2007 2008 2007
“Core Earnings” derivative
adjustments:
Gains (losses) on derivative and
hedging activities, net, included in
other income(1) . . . . . . . . . . . . . . . $(242) $362 $(487) $(153) $(23)
Less: Realized (gains) losses on
derivative and hedging activities,
net(1) . . . . . . . . . . . . . . . . . . . . . . . 41 90 33 39 79
Unrealized gains (losses) on
derivative and hedging activities,
net . . . . . . . . . . . . . . . . . . . . . . . . (201) 452 (454) (114) 56
Other pre-SFAS No. 133 accounting
adjustments . . . . . . . . . . . . . . . . . . (5) (1) — (5) —
Total net impact of SFAS No. 133
derivative accounting(2) . . . . . . . . . $(206) $451 $(454) $(119) $ 56
(1)
See “Reclassification of Realized Gains (Losses) on Derivative and Hedging Activities” below for a detailed breakdown of
the components of realized losses on derivative and hedging activities.
(2)
Negative amounts are subtracted from “Core Earnings” net income to arrive at GAAP net income and positive amounts are
added to “Core Earnings” net income to arrive at GAAP net income.
22
23. Reclassification of Realized Gains (Losses) on Derivative and Hedging Activities
SFAS No. 133 requires net settlement income/expense on derivatives and realized gains/losses related
to derivative dispositions (collectively referred to as “realized gains (losses) on derivative and hedging
activities”) that do not qualify as hedges under SFAS No. 133 to be recorded in a separate income
statement line item below net interest income. The table below summarizes the realized losses on
derivative and hedging activities, and the associated reclassification on a “Core Earnings” basis for the
quarters ended September 30, 2008, June 30, 2008, and September 30, 2007 and the nine months
ended September 30, 2008 and 2007.
Quarters ended Nine months ended
September 30, June 30, September 30, September 30, September 30,
2008 2008 2007 2008 2007
Reclassification of realized gains
(losses) on derivative and hedging
activities:
Net settlement expense on Floor
Income Contracts reclassified to
net interest income . . . . . . . . . . . . $ (75) $(175) $ (14) $(390) $(31)
Net settlement income (expense) on
interest rate swaps reclassified to
net interest income . . . . . . . . . . . . 22 86 (19) 339 (48)
Foreign exchange derivatives
gains/(losses) reclassified to other
income . . . . . . . . . . . . . . . . . . . . . 12 (5) — 8 —
Net realized gains (losses) on
terminated derivative contracts
reclassified to other income . . . . . . — 4 — 4 —
Total reclassifications of realized
(gains) losses on derivative and
hedging activities. . . . . . . . . . . . . . (41) (90) (33) (39) (79)
Add: Unrealized gains (losses) on
derivative and hedging activities,
net(1) . . . . . . . . . . . . . . . . . . . . . . . (201) 452 (454) (114) 56
Gains (losses) on derivative and
hedging activities, net . . . . . . . . . . $(242) $ 362 $(487) $(153) $(23)
(1)
“Unrealized gains (losses) on derivative and hedging activities, net” comprises the following unrealized mark-to-market
gains (losses):
Quarters ended Nine months ended
September 30, June 30, September 30, September 30, September 30,
2008 2008 2007 2008 2007
Floor Income Contracts . . . . . . . . . . . $ (33) $ 569 $(149) $ 241 $ (63)
Equity forward contracts . . . . . . . . . . — — (458) — (74)
Basis swaps . . . . . . . . . . . . . . . . . . (210) (157) 132 (499) 154
Other . . . . . . . . . . . . . . . . . . . . . . . 42 40 21 144 39
Total unrealized gains (losses) on
derivative and hedging activities,
net . . . . . . . . . . . . . . . . . . . . ... $(201) $ 452 $(454) $(114) $ 56
Unrealized gains and losses on Floor Income Contracts are primarily caused by changes in interest
rates. In general, an increase in interest rates results in an unrealized gain and vice versa. Unrealized
gains and losses on equity forward contracts fluctuate with changes in the Company’s stock price.
Unrealized gains and losses on basis swaps result from changes in the spread between indices and on
changes in the forward interest rate curves that impact basis swaps hedging repricing risk between
quarterly reset debt and daily reset assets.
23