4. SLM CORPORATION
Segment and “Core Earnings”
Consolidated Statements of Income
(In thousands)
Quarter ended June 30, 2008
Asset
Performance Corporate Total “Core Total
Lending Group and Other Earnings” Adjustments GAAP
(unaudited)
Interest income:
FFELP Stafford and Other
Student Loans . . . . . . . . . . . . $ 524,022 $ — $ — $ 524,022 $ (26,424) $ 497,598
FFELP Consolidation Loans . . . . 907,669 — — 907,669 (138,005) 769,664
Private Education Loans . . . . . . . 665,452 — — 665,452 (256,129) 409,323
Other loans . . . . . . . . . . . . . . . . 21,355 — — 21,355 — 21,355
Cash and investments . . . . . . . . . 80,445 — 4,902 85,347 (14,826) 70,521
Total interest income . . . . . . . . . . . 2,198,943 — 4,902 2,203,845 (435,384) 1,768,461
Total interest expense . . . . . . . . . . 1,604,872 6,933 5,074 1,616,879 (250,961) 1,365,918
Net interest income (loss) . . . . . . . 594,071 (6,933) (172) 586,966 (184,423) 402,543
Less: provisions for loan losses . . . 192,181 — — 192,181 (49,166) 143,015
Net interest income (loss) after
provisions for loan losses . . . . . . 401,890 (6,933) (172) 394,785 (135,257) 259,528
Contingency fee revenue . . . . . . . . — 83,790 — 83,790 — 83,790
Collections revenue . . . . . . . . . . . . — 27,517 — 27,517 (1,152) 26,365
Guarantor servicing fees . . . . . . . . — — 23,663 23,663 — 23,663
Other income . . . . . . . . . . . . . . . . 61,898 — 45,587 107,485 321,333 428,818
Total other income . . . . . . . . . . . . 61,898 111,307 69,250 242,455 320,181 562,636
Restructuring expenses . . . . . . . . . 30,947 5,174 10,619 46,740 — 46,740
Operating expenses . . . . . . . . . . . . 154,505 110,340 73,871 338,716 14,972 353,688
Total expenses . . . . . . . . . . . . . . . 185,452 115,514 84,490 385,456 14,972 400,428
Income (loss) before income taxes
and minority interest in net
earnings of subsidiaries . . . . . . . 278,336 (11,140) (15,412) 251,784 169,952 421,736
Income tax expense (benefit)(1) . . . . 102,917 (4,050) (5,651) 93,216 59,858 153,074
Minority interest in net earnings of
subsidiaries . . . . . . . . . . . . . . . . — 2,926 — 2,926 — 2,926
Net income (loss) . . . . . . . . . . . . . $ 175,419 $ (10,016) $ (9,761) $ 155,642 $ 110,094 $ 265,736
(1)
Income taxes are based on a percentage of net income before tax for the individual reportable segment.
4
5. SLM CORPORATION
Segment and “Core Earnings”
Consolidated Statements of Income
(In thousands)
Quarter ended March 31, 2008
Asset
Performance Corporate Total “Core Total
Lending Group and Other Earnings” Adjustments GAAP
(unaudited)
Interest income:
FFELP Stafford and Other
Student Loans . . . . . . . . . . . . $ 494,382 $ — $ — $ 494,382 $ (29,906) $ 464,476
FFELP Consolidation Loans . . . . 988,486 — — 988,486 (151,830) 836,656
Private Education Loans . . . . . . . 749,321 — — 749,321 (305,799) 443,522
Other loans . . . . . . . . . . . . . . . . 23,344 — — 23,344 — 23,344
Cash and investments . . . . . . . . . 141,902 — 6,267 148,169 (24,353) 123,816
Total interest income . . . . . . . . . . . 2,397,435 — 6,267 2,403,702 (511,888) 1,891,814
Total interest expense . . . . . . . . . . 1,824,471 6,840 5,202 1,836,513 (221,068) 1,615,445
Net interest income (loss) . . . . . . . 572,964 (6,840) 1,065 567,189 (290,820) 276,369
Less: provisions for loan losses . . . 181,321 — — 181,321 (44,010) 137,311
Net interest income (loss) after
provisions for loan losses . . . . . . 391,643 (6,840) 1,065 385,868 (246,810) 139,058
Contingency fee revenue . . . . . . . . — 85,306 — 85,306 — 85,306
Collections revenue . . . . . . . . . . . . — 56,361 — 56,361 878 57,239
Guarantor servicing fees . . . . . . . . — — 34,653 34,653 — 34,653
Other income (loss) . . . . . . . . . . . . 44,345 — 50,641 94,986 (201,273) (106,287)
Total other income . . . . . . . . . . . . 44,345 141,667 85,294 271,306 (200,395) 70,911
Restructuring expenses . . . . . . . . . 15,550 434 4,694 20,678 — 20,678
Operating expenses . . . . . . . . . . . . 163,636 106,142 69,655 339,433 16,215 355,648
Total expenses . . . . . . . . . . . . . . . 179,186 106,576 74,349 360,111 16,215 376,326
Income (loss) before income taxes
and minority interest in net
earnings of subsidiaries . . . . . . . 256,802 28,251 12,010 297,063 (463,420) (166,357)
Income tax expense (benefit)(1) . . . . 94,067 10,348 4,399 108,814 (171,302) (62,488)
Minority interest in net earnings of
subsidiaries . . . . . . . . . . . . . . . . — (65) — (65) — (65)
Net income (loss) . . . . . . . . . . . . . $ 162,735 $ 17,968 $ 7,611 $ 188,314 $(292,118) $ (103,804)
(1)
Income taxes are based on a percentage of net income before tax for the individual reportable segment.
5
6. SLM CORPORATION
Segment and “Core Earnings”
Consolidated Statements of Income
(In thousands)
Quarter ended June 30, 2007
Asset
Performance Corporate Total “Core Total
Lending Group and Other Earnings” Adjustments GAAP
(unaudited)
Interest income:
FFELP Stafford and Other
Student Loans . . . . . . . . . . . . $ 718,624 $ — $ — $ 718,624 $(207,324) $ 511,300
FFELP Consolidation Loans . . . . 1,391,015 — — 1,391,015 (303,761) 1,087,254
Private Education Loans . . . . . . . 692,499 — — 692,499 (363,148) 329,351
Other loans . . . . . . . . . . . . . . . . 26,453 — — 26,453 — 26,453
Cash and investments . . . . . . . . . 182,644 — 7,197 189,841 (48,317) 141,524
Total interest income . . . . . . . . . . . 3,011,235 — 7,197 3,018,432 (922,550) 2,095,882
Total interest expense . . . . . . . . . . 2,371,441 6,612 5,425 2,383,478 (686,249) 1,697,229
Net interest income (loss) . . . . . . . 639,794 (6,612) 1,772 634,954 (236,301) 398,653
Less: provisions for loan losses . . . 246,981 — — 246,981 (98,781) 148,200
Net interest income (loss) after
provisions for loan losses . . . . . . 392,813 (6,612) 1,772 387,973 (137,520) 250,453
Contingency fee revenue . . . . . . . . — 80,233 — 80,233 4 80,237
Collections revenue . . . . . . . . . . . . — 77,412 — 77,412 (320) 77,092
Guarantor servicing fees . . . . . . . . — — 30,273 30,273 — 30,273
Other income . . . . . . . . . . . . . . . . 59,458 — 48,141 107,599 925,037 1,032,636
Total other income . . . . . . . . . . . . 59,458 157,645 78,414 295,517 924,721 1,220,238
Operating expenses . . . . . . . . . . . . 181,650 96,307 104,432 382,389 16,411 398,800
Income (loss) before income taxes
and minority interest in net
earnings of subsidiaries . . . . . . . 270,621 54,726 (24,246) 301,101 770,790 1,071,891
Income tax expense (benefit)(1) . . . . 100,130 20,248 (8,971) 111,407 (6,683) 104,724
Minority interest in net earnings of
subsidiaries . . . . . . . . . . . . . . . . — 696 — 696 — 696
Net income (loss) . . . . . . . . . . . . . $ 170,491 $ 33,782 $ (15,275) $ 188,998 $ 777,473 $ 966,471
(1)
Income taxes are based on a percentage of net income before tax for the individual reportable segment.
6
7. SLM CORPORATION
Segment and “Core Earnings”
Consolidated Statements of Income
(In thousands)
Six months ended June 30, 2008
Asset
Performance Corporate Total “Core Total
Lending Group and Other Earnings” Adjustments GAAP
(unaudited)
Interest income:
FFELP Stafford and Other
Student Loans . . . . . . . . . . . . $1,018,404 $ — $ — $1,018,404 $ (56,330) $ 962,074
FFELP Consolidation Loans . . . . 1,896,155 — — 1,896,155 (289,835) 1,606,320
Private Education Loans . . . . . . . 1,414,773 — — 1,414,773 (561,928) 852,845
Other loans . . . . . . . . . . . . . . . . 44,699 — — 44,699 — 44,699
Cash and investments . . . . . . . . . 222,347 — 11,169 233,516 (39,179) 194,337
Total interest income . . . . . . . . . . . 4,596,378 — 11,169 4,607,547 (947,272) 3,660,275
Total interest expense . . . . . . . . . . 3,429,343 13,773 10,276 3,453,392 (472,029) 2,981,363
Net interest income (loss) . . . . . . . 1,167,035 (13,773) 893 1,154,155 (475,243) 678,912
Less: provisions for loan losses . . . 373,502 — — 373,502 (93,176) 280,326
Net interest income (loss) after
provisions for loan losses . . . . . . 793,533 (13,773) 893 780,653 (382,067) 398,586
Contingency fee revenue . . . . . . . . — 169,096 — 169,096 — 169,096
Collections revenue . . . . . . . . . . . . — 83,878 — 83,878 (274) 83,604
Guarantor servicing fees . . . . . . . . — — 58,316 58,316 — 58,316
Other income . . . . . . . . . . . . . . . . 106,243 — 96,228 202,471 120,060 322,531
Total other income . . . . . . . . . . . . 106,243 252,974 154,544 513,761 119,786 633,547
Restructuring expenses . . . . . . . . . 46,497 5,608 15,313 67,418 — 67,418
Operating expenses . . . . . . . . . . . . 318,141 216,482 143,526 678,149 31,187 709,336
Total expenses . . . . . . . . . . . . . . . 364,638 222,090 158,839 745,567 31,187 776,754
Income (loss) before income taxes
and minority interest in net
earnings of subsidiaries . . . . . . . 535,138 17,111 (3,402) 548,847 (293,468) 255,379
Income tax expense (benefit)(1) . . . . 196,984 6,298 (1,252) 202,030 (111,444) 90,586
Minority interest in net earnings of
subsidiaries . . . . . . . . . . . . . . . . — 2,861 — 2,861 — 2,861
Net income (loss) . . . . . . . . . . . . . $ 338,154 $ 7,952 $ (2,150) $ 343,956 $(182,024) $ 161,932
(1)
Income taxes are based on a percentage of net income before tax for the individual reportable segment.
7
8. SLM CORPORATION
Segment and “Core Earnings”
Consolidated Statements of Income
(In thousands)
Six months ended June 30, 2007
Asset
Performance Corporate Total ‘‘Core Total
Lending Group and Other Earnings” Adjustments GAAP
(unaudited)
Interest income:
FFELP Stafford and Other
Student Loans . . . . . . . . . . . . $1,413,977 $ — $ — $1,413,977 $ (451,915) $ 962,062
FFELP Consolidation Loans . . . . 2,722,250 — — 2,722,250 (620,150) 2,102,100
Private Education Loans. . . . . . . 1,350,083 — — 1,350,083 (682,311) 667,772
Other loans . . . . . . . . . . . . . . . 54,426 — — 54,426 — 54,426
Cash and investments . . . . . . . . 344,321 — 9,332 353,653 (98,225) 255,428
Total interest income. . . . . . . . . . . 5,885,057 — 9,332 5,894,389 (1,852,601) 4,041,788
Total interest expense . . . . . . . . . . 4,591,577 13,299 10,993 4,615,869 (1,386,550) 3,229,319
Net interest income (loss) . . . . . . . 1,293,480 (13,299) (1,661) 1,278,520 (466,051) 812,469
Less: provisions for loan losses . . . 444,911 — 606 445,517 (146,987) 298,530
Net interest income (loss) after
provisions for loan losses . . . . . . 848,569 (13,299) (2,267) 833,003 (319,064) 513,939
Contingency fee revenue . . . . . . . . — 167,559 — 167,559 — 167,559
Collections revenue. . . . . . . . . . . . — 142,734 — 142,734 (80) 142,654
Guarantor servicing fees . . . . . . . . — — 69,514 69,514 — 69,514
Other income . . . . . . . . . . . . . . . . 103,876 — 99,458 203,334 1,157,037 1,360,371
Total other income . . . . . . . . . . . . 103,876 310,293 168,972 583,141 1,156,957 1,740,098
Operating expenses . . . . . . . . . . . . 353,213 189,555 171,937 714,705 40,269 754,974
Income (loss) before income taxes
and minority interest in net
earnings of subsidiaries . . . . . . . 599,232 107,439 (5,232) 701,439 797,624 1,499,063
Income tax expense (benefit)(1) . . . 221,716 39,752 (1,936) 259,532 155,206 414,738
Minority interest in net earnings of
subsidiaries . . . . . . . . . . . . . . . — 1,701 — 1,701 — 1,701
Net income (loss) . . . . . . . . . . . . . $ 377,516 $ 65,986 $ (3,296) $ 440,206 $ 642,418 $1,082,624
(1)
Income taxes are based on a percentage of net income before tax for the individual reportable segment.
8
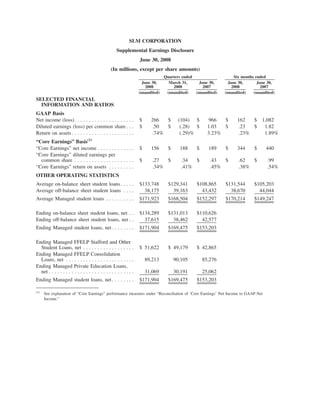
9. SLM CORPORATION
Reconciliation of “Core Earnings” Net Income to GAAP Net Income
(In thousands, except per share amounts)
Quarters ended Six months ended
June 30, March 31, June 30, June 30, June 30,
2008 2008 2007 2008 2007
(unaudited) (unaudited) (unaudited) (unaudited) (unaudited)
“Core Earnings” net income(A) . . . . . . . . $ 155,642 $ 188,314 $188,998 $ 343,956 $ 440,206
“Core Earnings” adjustments:
Net impact of securitization accounting . . . (246,506) (79,146) (15,071) (325,652) 406,414
Net impact of derivative accounting . . . . . . 450,609 (363,368) 841,564 87,241 509,840
Net impact of Floor Income. . . . . . . . . . . . (18,809) (5,577) (39,246) (24,386) (78,267)
Net impact of acquired intangibles . . . . . . . (15,342) (15,329) (16,457) (30,671) (40,363)
Total “Core Earnings” adjustments before
income taxes and minority interest in net
earnings of subsidiaries . . . . . . . . . . . . . 169,952 (463,420) 770,790 (293,468) 797,624
Net tax effect(B) . . . . . . . . . . . . . . . . . . . . (59,858) 171,302 6,683 111,444 (155,206)
Total “Core Earnings” adjustments . . . . . . . 110,094 (292,118) 777,473 (182,024) 642,418
GAAP net income (loss) . . . . . . . . . . . . . $ 265,736 $(103,804) $966,471 $ 161,932 $1,082,624
GAAP diluted earnings (loss) per common
share . . . . . . . . . . . . . . . . . . . . . . . . . . . $ .50 $ (.28) $ 1.03 $ .23 $ 1.82
(A)
“Core Earnings” diluted earnings per common
share . . . . . . . . . . . . . . . . . . . . . . . . . . . . . $ .27 $ .34 $ .43 $ .62 $ .99
(B)
Such tax effect is based upon the Company’s “Core Earnings” effective tax rate. For the quarter and six months ended June 30, 2007,
the “Core Earnings” effective tax rate is different than GAAP primarily from the exclusion of the permanent income tax impact of
the equity forward contracts. The Company settled all of its equity forward contracts in January 2008.
“Core Earnings”
In accordance with the Rules and Regulations of the Securities and Exchange Commission (“SEC”), we
prepare financial statements in accordance with generally accepted accounting principles in the United States
of America (“GAAP”). In addition to evaluating the Company’s GAAP-based financial information, manage-
ment evaluates the Company’s business segments on a basis that, as allowed under the Financial Accounting
Standards Board’s Statement of Financial Accounting Standards (“SFAS”) No. 131, “Disclosures about
Segments of an Enterprise and Related Information,” differs from GAAP. We refer to management’s basis of
evaluating our segment results as “Core Earnings” presentations for each business segment and we refer to this
information in our presentations with credit rating agencies and lenders. While “Core Earnings” are not a
substitute for reported results under GAAP, we rely on “Core Earnings” to manage each operating segment
because we believe these measures provide additional information regarding the operational and performance
indicators that are most closely assessed by management.
Our “Core Earnings” are not defined terms within GAAP and may not be comparable to similarly titled
measures reported by other companies. “Core Earnings” net income reflects only current period adjustments to
GAAP net income as described below. Unlike financial accounting, there is no comprehensive, authoritative
guidance for management reporting and as a result, our management reporting is not necessarily comparable
with similar information for any other financial institution. Our operating segments are defined by products
and services or by types of customers, and reflect the manner in which financial information is currently
evaluated by management. Intersegment revenues and expenses are netted within the appropriate financial
statement line items consistent with the income statement presentation provided to management. Changes in
9
10. management structure or allocation methodologies and procedures may result in changes in reported segment
financial information.
Limitations of “Core Earnings”
While GAAP provides a uniform, comprehensive basis of accounting, for the reasons described above,
management believes that “Core Earnings” are an important additional tool for providing a more complete
understanding of the Company’s results of operations. Nevertheless, “Core Earnings” are subject to certain
general and specific limitations that investors should carefully consider. For example, as stated above, unlike
financial accounting, there is no comprehensive, authoritative guidance for management reporting. Our “Core
Earnings” are not defined terms within GAAP and may not be comparable to similarly titled measures
reported by other companies. Unlike GAAP, “Core Earnings” reflect only current period adjustments to GAAP.
Accordingly, the Company’s “Core Earnings” presentation does not represent a comprehensive basis of
accounting. Investors, therefore, may not compare our Company’s performance with that of other financial
services companies based upon “Core Earnings.” “Core Earnings” results are only meant to supplement GAAP
results by providing additional information regarding the operational and performance indicators that are most
closely used by management, the Company’s board of directors, rating agencies and lenders to assess
performance.
Other limitations arise from the specific adjustments that management makes to GAAP results to derive
“Core Earnings” results. For example, in reversing the unrealized gains and losses that result from
SFAS No. 133, “Accounting for Derivative Instruments and Hedging Activities,” on derivatives that do not
qualify for “hedge treatment,” as well as on derivatives that do qualify but are in part ineffective because they
are not perfect hedges, we focus on the long-term economic effectiveness of those instruments relative to the
underlying hedged item and isolate the effects of interest rate volatility, changing credit spreads and changes
in our stock price on the fair value of such instruments during the period. Under GAAP, the effects of these
factors on the fair value of the derivative instruments (but not on the underlying hedged item) tend to show
more volatility in the short term. While presentation of our results on a “Core Earnings” basis provides
important information regarding the performance of our Managed loan portfolio, a limitation of this
presentation is that we present the ongoing spread income on loans that have been sold to a trust we manage.
While we believe that our “Core Earnings” presentation presents the economic substance of our Managed loan
portfolio, it understates earnings volatility from securitization gains. Our “Core Earnings” results exclude
certain Floor Income, which is cash income, from our reported results and therefore may understate earnings
in certain periods. Management’s financial planning and valuation of operating results, however, does not take
into account Floor Income because of its inherent uncertainty, except when it is economically hedged through
Floor Income Contracts.
Pre-Tax Differences between “Core Earnings” and GAAP
Our “Core Earnings” are the primary financial performance measures used by management to evaluate
performance and to allocate resources. Accordingly, financial information is reported to management on a
“Core Earnings” basis by reportable segment, as these are the measures used regularly by our chief operating
decision makers. Our “Core Earnings” are used in developing our financial plans, tracking results, and
establishing corporate performance targets. Management believes this information provides additional insight
into the financial performance of the Company’s core business activities. “Core Earnings” net income reflects
only current period adjustments to GAAP net income, as described in the more detailed discussion of the
differences between “Core Earnings” and GAAP that follows, which includes further detail on each specific
adjustment required to reconcile our “Core Earnings” segment presentation to our GAAP earnings.
1) Securitization Accounting: Under GAAP, certain securitization transactions in our Lending operating
segment are accounted for as sales of assets. Under “Core Earnings” for the Lending operating
segment, we present all securitization transactions on a “Core Earnings” basis as long-term non-
recourse financings. The upfront “gains” on sale from securitization transactions, as well as ongoing
“servicing and securitization revenue” presented in accordance with GAAP, are excluded from “Core
Earnings” and are replaced by interest income, provisions for loan losses, and interest expense as
10
11. earned or incurred on the securitization loans. We also exclude transactions with our off-balance sheet
trusts from “Core Earnings” as they are considered intercompany transactions on a “Core Earnings”
basis.
2) Derivative Accounting: “Core Earnings” exclude periodic unrealized gains and losses that are caused
primarily by the one-sided mark-to-market derivative valuations prescribed by SFAS No. 133 on
derivatives that do not qualify for “hedge treatment” under GAAP. These unrealized gains and losses
occur in our Lending operating segment, and occurred in our Corporate and Other reportable segment
related to equity forward contracts for the year-ago quarters. In our “Core Earnings” presentation, we
recognize the economic effect of these hedges, which generally results in any cash paid or received
being recognized ratably as an expense or revenue over the hedged item’s life. “Core Earnings” also
exclude the gain or loss on equity forward contracts that under SFAS No. 133, are required to be
accounted for as derivatives and are marked to market through earnings. The Company settled all of
its equity forward contracts in January 2008.
3) Floor Income: The timing and amount (if any) of Floor Income earned in our Lending operating
segment is uncertain and in excess of expected spreads. Therefore, we exclude such income from
“Core Earnings” when it is not economically hedged. We employ derivatives, primarily Floor Income
Contracts and futures, to economically hedge Floor Income. As discussed above in “Derivative
Accounting,” these derivatives do not qualify as effective accounting hedges, and therefore, under
GAAP, are marked to market through the “gains (losses) on derivative and hedging activities, net” line
in the consolidated statement of income with no offsetting gain or loss recorded for the economically
hedged items. For “Core Earnings,” we reverse the fair value adjustments on the Floor Income
Contracts and futures economically hedging Floor Income and include the amortization of net
premiums received in income.
4) Acquired Intangibles: Our “Core Earnings” exclude goodwill and intangible impairment and the
amortization of acquired intangibles.
11
12. SLM CORPORATION
SUPPLEMENTAL FINANCIAL INFORMATION RELEASE
SECOND QUARTER 2008
(Dollars in millions, except per share amounts, unless otherwise stated)
The following information (the “Supplemental Financial Information Release” or “Release”) should be
read in connection with SLM Corporation’s (the “Company’s”) press release for second quarter 2008 earnings,
dated July 23, 2008.
The Supplemental Financial Information Release contains forward-looking statements and information
based on management’s current expectations as of the date of the Release. Statements that are not historical
facts, including statements about our beliefs or expectations and statements that assume or are dependent upon
future events, are forward-looking statements. Forward-looking statements are subject to risks, uncertainties,
assumptions and other factors that may cause actual results to be materially different from those reflected in
such forward-looking statements. These factors include, among others, the occurrence of any event, change or
other circumstances that could give rise to our ability to cost-effectively refinance the aggregate $34 billion
asset-backed financing facilities, due February 2009, which closed in the first quarter of 2008 (collectively, the
“2008 Asset-Backed Financing Facilities”), including any potential foreclosure on the student loans under
those facilities following their termination; increased financing costs; limited liquidity; any adverse outcomes
in any significant litigation to which we are a party; our derivative counterparties terminating their positions
with the Company if permitted by their contracts and the Company substantially incurring additional costs to
replace any terminated positions; changes in the terms of student loans and the educational credit marketplace
(including changes resulting from new laws and regulations and from the implementation of applicable laws
and regulations) which, among other things, may reduce the volume, average term and yields on student loans
under the Federal Family Education Loan Program (“FFELP”), may result in loans being originated or
refinanced under non-FFELP programs, or may affect the terms upon which banks and others agree to sell
FFELP loans to the Company. The Company could also be affected by: changes in the demand for educational
financing or in financing preferences of lenders, educational institutions, students and their families; incorrect
estimates or assumptions by management in connection with the preparation of our consolidated financial
statements; changes in the composition of our Managed FFELP and Private Education Loan portfolios;
changes in the general interest rate environment and in the securitization markets for education loans, which
may increase the costs or limit the availability of financings necessary to initiate, purchase or carry education
loans; changes in projections of losses from loan defaults; changes in general economic conditions; changes in
prepayment rates and credit spreads; and changes in the demand for debt management services and new laws
or changes in existing laws that govern debt management services. All forward-looking statements contained
in the Release are qualified by these cautionary statements and are made only as of the date this Release is
filed. The Company does not undertake any obligation to update or revise these forward-looking statements to
conform the statement to actual results or changes in the Company’s expectations.
Definitions for capitalized terms in this document can be found in the Company’s 2007 Form 10-K filed
with the Securities and Exchange Commission (“SEC”) on February 29, 2008.
Certain reclassifications have been made to the balances as of and for the quarters ended June 30, 2007,
to be consistent with classifications adopted for the quarter ended June 30, 2008.
12
13. DISCUSSION OF CONSOLIDATED RESULTS OF OPERATIONS
Three Months Ended June 30, 2008 Compared to Three Months Ended March 31, 2008
For the three months ended June 30, 2008, net income was $266 million or $.50 diluted earnings per
share, compared to a net loss of $104 million, or $.28 diluted loss per share, for the three months ended
March 31, 2008. The effective tax rate for those periods was 36 percent and 38 percent, respectively. Pre-tax
income increased by $588 million versus the prior quarter primarily due to an increase of $635 million in net
gains on derivative and hedging activities. Net gains on derivative and hedging activities were $362 million in
the second quarter of 2008 compared to net losses of $273 million in the prior quarter. The increase in net
gains on derivative and hedging activities were primarily related to an increase in unrealized gains on Floor
Income Contracts in the second quarter of 2008 due to an increase in interest rates.
There were no gains on student loan securitizations in either the first or second quarters of 2008 since the
Company did not complete any off-balance sheet securitizations. The Company adopted SFAS No. 159, “The
Fair Value Option for Financial Assets and Financial Liabilities — Including an Amendment of FASB
Statement No. 115,” on January 1, 2008, and elected the fair value option on all of the Residual Interests
effective January 1, 2008. The Company made this election in order to simplify the accounting for Residual
Interests by having all Residual Interests under one accounting model. Prior to this election, Residual Interests
were accounted for either under SFAS No. 115, “Accounting for Certain Investments in Debt and Equity
Securities,” with changes in fair value recorded through other comprehensive income or under SFAS No. 155,
“Accounting for Certain Hybrid Financial Instruments,” with changes in fair value recorded through income.
The Company reclassified the related accumulated other comprehensive income of $195 million into retained
earnings. Equity was not impacted at transition on January 1, 2008. Changes in fair value of Residual Interests
on and after January 1, 2008 are recorded through the income statement. The Company has not elected the
fair value option for any other financial instruments at this time. Servicing and securitization revenue
decreased by $106 million from $108 million in the first quarter of 2008 to $2 million in the second quarter of
2008. This decrease was primarily due to a current-quarter $192 million unrealized mark-to-market loss on the
Company’s Residual Interests recorded under SFAS No. 159 compared to a prior-quarter $88 million
unrealized mark-to-market loss on the Company’s Residual Interests recorded under SFAS No. 159. The
increase in the unrealized loss recorded under SFAS No. 159 was primarily a result of an increase to the
discount rate assumption related to the Private Education Loan Residual Interest in the second quarter of 2008.
Net interest income after provisions for loan losses increased by $120 million in the second quarter of
2008 over the first quarter. This increase was due to a $126 million increase in net interest income, offset by a
$6 million increase in provisions for loan losses. The increase in net interest income was primarily due to an
increase in the student loan spread (see “LENDING BUSINESS SEGMENT — Net Interest Income — Net
Interest Margin — On-Balance Sheet”), which was partially offset by an increase in the 2008 Asset-Backed
Financing Facilities Fees.
In the second quarter of 2008, fee and other income and collections revenue totaled $243 million, a
$28 million decrease from $271 million in the prior quarter. This decrease was primarily the result of a
$51 million impairment related to declines in the fair value of mortgage loans and real estate held by the
Company’s mortgage purchased paper subsidiary (see “ASSET PERFORMANCE GROUP BUSINESS
SEGMENT”).
The Company is currently restructuring its business in response to the impact of The College Cost
Reduction and Access Act of 2007 (“CCRAA”), and current challenges in the capital markets. As part of the
Company’s cost reduction efforts, restructuring expenses of $47 million and $21 million were recognized in
the current quarter and prior quarter, respectively. The majority of these restructuring expenses were severance
costs related to the aggregate of completed and planned position eliminations totaling approximately 2,500
positions (representing approximately 23 percent of the overall employee population) across all areas of the
Company. Cumulative restructuring expenses from the fourth quarter of 2007 through the second quarter of
2008 totaled $90 million. The Company estimates an additional $24 million of restructuring expenses
associated with its current cost reduction efforts will be incurred in future periods.
13
14. Operating expenses, excluding $6 million of reorganization-related asset impairments recognized in the
second quarter of 2008, were $348 million in the second quarter of 2008 compared to $356 million in the first
quarter of 2008. This $8 million decrease in operating expenses was primarily due to the Company’s cost
reduction efforts discussed above.
Three Months Ended June 30, 2008 Compared to Three Months Ended June 30, 2007
For the three months ended June 30, 2008, our net income was $266 million or $.50 diluted earnings per
share, compared to net income of $966 million, or $1.03 diluted earnings per share, for the three months
ended June 30, 2007. The effective tax rate for those periods was 36 percent and 10 percent, respectively. The
movement in the effective tax rate was primarily driven by the permanent tax impact of excluding non-taxable
gains and losses on the equity forward contracts which were marked to market through earnings under
SFAS No. 133. The Company settled all of its outstanding equity forward contracts in January 2008. Pre-tax
income decreased by $650 million versus the year-ago quarter primarily due to a decrease in net gains on
derivative and hedging activities from $822 million in the year-ago quarter to $362 million in the second
quarter of 2008.
There were no gains on student loan securitizations in either the second quarter of 2008 or the year-ago
quarter since the Company did not complete any off-balance sheet securitizations in those periods. Servicing
and securitization revenue decreased by $131 million from $133 million in the second quarter of 2007 to
$2 million in the second quarter of 2008. This decrease was primarily due to a current-quarter $192 million
unrealized mark-to-market loss recorded under SFAS No. 159 compared to a year-ago quarter $57 million
unrealized mark-to-market loss, which included impairment and an unrealized mark-to-market loss recorded
under SFAS No. 155. The increase in the unrealized loss recorded under SFAS No. 159 was primarily a result
of an increase to the discount rate assumption related to the Private Education Loan Residual Interest in the
second quarter of 2008, discussed above.
Net interest income after provisions for loan losses increased by $9 million in the second quarter from the
year-ago quarter. This increase was due to a $4 million increase in net interest income, offset by a $5 million
decrease in provisions for loan losses. The increase in net interest income was primarily due to an increase in
the student loan spread (see “LENDING BUSINESS SEGMENT — Net Interest Income — Net Interest
Margin — On-Balance Sheet”) and a $25 billion increase in the average balance of on-balance sheet student
loans, partially offset by an increase in the 2008 Asset-Backed Financing Facilities Fees.
In the second quarter of 2008, fee and other income and collections revenue totaled $243 million, a
$33 million decrease from $276 million in the year-ago quarter. This decrease was primarily the result of a
$51 million impairment related to declines in the fair value of mortgage loans and real estate held by the
Company’s mortgage purchased paper subsidiary (see “ASSET PERFORMANCE GROUP BUSINESS
SEGMENT”).
Restructuring expenses of $47 million were recognized in the second quarter of 2008, as previously
discussed, with no such expenses recognized in the year-ago quarter.
Operating expenses, excluding $6 million of reorganization-related asset impairments recognized in the
second quarter of 2008, were $348 million in the second quarter of 2008 compared to $399 million in the
second quarter of 2007. This $51 million decrease in operating expenses was primarily due to a $37 million
decrease in Merger-related expenses and to the Company’s current cost reduction efforts discussed above.
Six Months Ended June 30, 2008 Compared to Six Months Ended June 30, 2007
For the six months ended June 30, 2008, our net income was $162 million or $.23 diluted earnings per
share, compared to net income of $1.1 billion, or $1.82 diluted earnings per share, for the six months ended
June 30, 2007. The effective tax rate for those periods was 35 percent and 28 percent, respectively. The
movement in the effective tax rate was primarily driven by the permanent tax impact of excluding non-taxable
gains and losses on the equity forward contracts which were marked to market through earnings under
SFAS No. 133. The Company settled all of its outstanding equity forward contracts in January 2008. Pre-tax
14
15. income decreased by $1.2 billion versus the year-ago period primarily due to a decrease in net gains on
derivative and hedging activities from $465 million in the six months ended June 30, 2007 to $89 million in
the six months ended June 30, 2008, and by a decrease in gains on student loan securitizations.
There were no gains on student loan securitizations in the six months ended June 30, 2008 compared to
gains of $367 million in the year-ago period. The Company did not complete any off-balance sheet
securitizations in the first half of 2008 versus one Private Education Loan securitization in the first half of
2007. Servicing and securitization revenue decreased by $276 million from $385 million in the six months
ended 2007 to $109 million in the current period. This decrease was primarily due to a $280 million
unrealized mark-to-market loss recorded under SFAS No. 159 in the six months ended June 30, 2008
compared to a $11 million unrealized mark-to-market gain in the six months ended June 30, 2007, which
included both impairment and an unrealized mark-to-market gain recorded under SFAS No. 155. The increase
in the unrealized loss recorded under SFAS No. 159 was primarily a result of an increase to the discount rate
assumption related to the Private Education Loan Residual Interest in the second quarter of 2008.
Net interest income after provisions for loan losses decreased by $115 million in the six months ended
June 30, 2008 from the year-ago period. This decrease was due to a $134 million decrease in net interest
income, offset by an $18 million decrease in provisions for loan losses. The decrease in net interest income
was primarily due to a decrease in the student loan spread (see “LENDING BUSINESS SEGMENT — Net
Interest Income — Net Interest Margin — On-Balance Sheet”) and an increase in the 2008 Asset-Backed
Facilities Financing Fees.
In the first half of 2008, fee and other income and collections revenue totaled $513 million, a $52 million
decrease from $565 million in the year-ago period. This decrease was primarily the result of a $51 million
impairment related to declines in the fair value of mortgage loans and real estate held by the Company’s
mortgage purchased paper subsidiary (see “ASSET PERFORMANCE GROUP BUSINESS SEGMENT”).
Restructuring expenses of $67 million were recognized in the six months ended June 30, 2008, as
previously discussed, with no such expenses recognized in the year-ago period.
Operating expenses, excluding $6 million of reorganization-related asset impairments recognized in the
second quarter of 2008, were $703 million in the first half of 2008 compared to $755 million in the year-ago
period. This $52 million decrease in operating expenses was primarily due to a $37 million decrease in
Merger-related expenses and the Company’s current cost reduction efforts discussed above.
Other Income
The following table summarizes the components of “Other income” in the consolidated statements of
income for the quarters ended June 30, 2008, March 31, 2008 and June 30, 2007 and for the six months ended
June 30, 2008 and 2007.
Quarters ended Six months ended
June 30, March 31, June 30, June 30, June 30,
2008 2008 2007 2008 2007
Late fees and forbearance fees . . . . . . . . . . . . . . . . $ 34 $37 $32 $ 71 $ 67
Asset servicing and other transaction fees . . . . . . . . 26 26 26 52 51
Loan servicing fees . . . . . . . . . . . . . . . . . . . . . . . . 6 7 6 12 14
Gains on sales of mortgages and other loan fees . . . 1 1 4 2 7
Other . . . . . . . . . . . . . . . . . . . . . . . . . . . . . . . . . . . 42 23 21 65 46
Total other income . . . . . . . . . . . . . . . . . . . . . . . . . $109 $94 $89 $202 $185
The increase in other income for the three and six months ended June 30, 2008 compared to the prior
periods reported above was primarily due to gains recognized on the Company’s repurchase of a portion of its
unsecured debt with short-term maturities during the second quarter of 2008.
15
16. EARNINGS RELEASE SUMMARY
The following table summarizes GAAP income statement items (on a tax-effected basis) that are
disclosed separately in the Company’s press releases of earnings or the Company’s quarterly earnings
conference calls for the quarters ended June 30, 2008, March 31, 2008, and June 30, 2007 and for the six
months ended June 30, 2008 and 2007.
Quarters ended Six months ended
June 30, March 31, June 30, June 30, June 30,
(in thousands) 2008 2008 2007 2008 2007
Reported net income (loss) . . . . . . . . . . . . . $265,736 $(103,804) $ 966,471 $161,932 $1,082,624
Preferred stock dividends . . . . . . . . . . . . . . . (27,391) (29,025) (9,156) (56,416) (18,249)
Reported net income (loss) attributable to
common stock . . . . . . . . . . . . . . . . . . . . . 238,345 (132,829) 957,315 105,516 1,064,375
Expense items disclosed separately
(tax-effected):
Merger-related financing fees(1) . . . . . . . . . . — — 8,839 — 8,839
Merger-related professional fees and other
costs . . . . . . . . . . . . . . . . . . . . . . . . . . . . — — 23,275 — 23,590
Restructuring expenses . . . . . . . . . . . . . . . . 29,446 12,903 — 42,349 —
Other reorganization-related asset
impairments. . . . . . . . . . . . . . . . . . . . . . . 3,779 — — 3,779 —
Acceleration of premium amortization
expense on loans(2) . . . . . . . . . . . . . . . . . — 33,818 — 33,818 —
Total expense items disclosed separately
(tax-effected) . . . . . . . . . . . . . . . . . . . . . . 33,225 46,721 32,114 79,946 32,429
Net income (loss) attributable to common
stock excluding the impact of items
disclosed separately . . . . . . . . . . . . . . . . . 271,570 (86,108) 989,429 185,462 1,096,804
Adjusted for dividends of convertible
preferred stock series C(3) . . . . . . . . . . . . 20,844 — — — —
Adjusted for debt expense of contingently
convertible debt instruments, net of tax. . . — — 17,679 — 35,189
Adjusted for non-taxable unrealized gains on
equity forwards . . . . . . . . . . . . . . . . . . . . — — (507,072) — (272,191)
Net income (loss) attributable to common
stock excluding the impact of items
disclosed separately, adjusted . . . . . . . . . . $292,414 $ (86,108) $ 500,036 $185,462 $ 859,802
Average common and common equivalent
shares outstanding(4) . . . . . . . . . . . . . . . . 517,954 466,580 452,406 467,316 454,139
(1)
Merger-related financing fees are the commitment and liquidity fees related to the financing facility in connection with the Merger
Agreement, now terminated.
(2)
The Company’s decision to cease consolidating FFELP Stafford loans and Consolidation Loans for the foreseeable future (considering
the CCRAA’s impact on the economics of a Consolidation Loan as well as the Company’s increased cost of funds given the current
credit market environment) resulted in a one-time, cumulative catch-up adjustment in premium amortization expense, due to shorten-
ing the assumed average lives of Stafford loans, which previously had an assumption that a portion of the underlying Stafford loans
would consolidate internally, extending the average life of such loans. Consolidation Loans generally have longer terms to maturity
than Stafford loans.
(3)
There was no impact on diluted earnings (loss) per common share for the prior quarter and the six months ended June 30, 2008,
because the effect of the assumed conversion was anti-dilutive. The convertible preferred stock series C was issued in the fourth quar-
ter of 2007.
(4)
Common equivalent shares outstanding were anti-dilutive for the quarter ended March 31, 2008.
16
17. The following table summarizes “Core Earnings” income statement items (on a tax-effected basis) that
are disclosed separately in the Company’s press releases of earnings or the Company’s quarterly earnings
conference calls for the quarters ended June 30, 2008, March 31, 2008, and June 30, 2007 and for the six
months ended June 30, 2008 and 2007.
Quarters ended Six months ended
June 30, March 31, June 30, June 30, June 30,
(in thousands) 2008 2008 2007 2008 2007
“Core Earnings” net income (loss) . . . . . . . . . . $155,642 $188,314 $188,998 $343,956 $440,206
Preferred stock dividends . . . . . . . . . . . . . . . . . (27,391) (29,025) (9,156) (56,416) (18,249)
“Core Earnings” net income (loss) attributable
to common stock . . . . . . . . . . . . . . . . . . . . . 128,251 159,289 179,842 287,540 421,957
Expense items disclosed separately (tax-
effected):
Merger-related financing fees(1) . . . . . . . . . . . . . — — 8,839 — 8,839
Merger-related professional fees and other
costs. . . . . . . . . . . . . . . . . . . . . . . . . . . . . . . — — 23,275 — 23,590
Restructuring expenses . . . . . . . . . . . . . . . . . . . 29,446 13,110 — 42,556 —
Other reorganization-related asset
impairments . . . . . . . . . . . . . . . . . . . . . . . . . 3,779 — — 3,779 —
Acceleration of premium amortization expense
on loans(2) . . . . . . . . . . . . . . . . . . . . . . . . . . — 52,106 — 52,106 —
Total expense items disclosed separately
(tax-effected) . . . . . . . . . . . . . . . . . . . . . . . . 33,225 65,216 32,114 98,441 32,429
Net income (loss) attributable to common stock,
excluding the impact of items disclosed
separately . . . . . . . . . . . . . . . . . . . . . . . . . . . $161,476 $224,505 $211,956 $385,981 $454,386
Average common and common equivalent
shares outstanding . . . . . . . . . . . . . . . . . . . . . 467,385 467,247 422,094 467,316 425,243
(1)
Merger-related financing fees are the commitment and liquidity fees related to the financing facility in connection with the Merger
Agreement, now terminated.
(2)
The Company’s decision to cease consolidating FFELP Stafford loans and Consolidation Loans for the foreseeable future (considering
the CCRAA’s impact on the economics of a Consolidation Loan as well as the Company’s increased cost of funds given the current
credit market environment) resulted in a one-time, cumulative catch-up adjustment in premium amortization expense, due to shorten-
ing the assumed average lives of Stafford loans, which previously had an assumption that a portion of the underlying Stafford loans
would consolidate internally, extending the average life of such loans. Consolidation Loans generally have longer terms to maturity
than Stafford loans.
BUSINESS SEGMENTS
The results of operations of the Company’s Lending, Asset Performance Group (“APG”), and Corporate
and Other business segments are presented below, using our “Core Earnings” presentation.
The Lending business segment section includes all discussion of income and related expenses associated
with the net interest margin, the student loan spread and its components, the provisions for loan losses, and
other fees earned on our Managed portfolio of student loans. The APG business segment reflects the fees
earned and expenses incurred in providing accounts receivable management and collection services. Our
Corporate and Other business segment includes our remaining fee businesses and other corporate expenses that
do not pertain directly to the primary segments identified above.
As previously discussed, on January 1, 2008, the Company adopted SFAS No. 157, “Fair Value
Measurements,” and SFAS No. 159, “The Fair Value Option for Financial Assets and Financial Liabilities —
Including an Amendment of FASB Statement No. 115.” The fair value adjustments of the items impacted by
17
18. SFAS No. 157 and SFAS No. 159 under GAAP are not included in “Core Earnings” net income and therefore
the adoption of SFAS No. 157 and SFAS No. 159 did not impact the “Core Earnings” presentation for the
three or six months ended June 30, 2008.
Pre-tax Differences between “Core Earnings” and GAAP
Our “Core Earnings” are the primary financial performance measures used by management to evaluate
performance and to allocate resources. Accordingly, financial information is reported to management on a
“Core Earnings” basis by reportable segment, as these are the measures used regularly by our chief operating
decision makers. Our “Core Earnings” are used in developing our financial plans, tracking results, and
establishing corporate performance targets. Management believes this information provides additional insight
into the financial performance of the Company’s core business activities. “Core Earnings” net income reflects
only current period adjustments to GAAP net income, as described in the more detailed discussion of the
differences between “Core Earnings” and GAAP that follows, which includes further detail on each specific
adjustment required to reconcile our “Core Earnings” segment presentation to our GAAP earnings.
1) Securitization Accounting: Under GAAP, certain securitization transactions in our Lending operating
segment are accounted for as sales of assets. Under “Core Earnings” for the Lending operating
segment, we present all securitization transactions on a “Core Earnings” basis as long-term non-
recourse financings. The upfront “gains” on sale from securitization transactions, as well as ongoing
“servicing and securitization revenue” presented in accordance with GAAP, are excluded from “Core
Earnings” and are replaced by interest income, provisions for loan losses, and interest expense as
earned or incurred on the securitization loans. We also exclude transactions with our off-balance sheet
trusts from “Core Earnings” as they are considered intercompany transactions on a “Core Earnings”
basis.
The following table summarizes “Core Earnings” securitization adjustments for the Lending operating
segment for the quarters ended June 30, 2008, March 31, 2008 and June 30, 2007 and for the six
months ended June 30, 2008 and 2007.
Quarters ended Six months ended
June 30, March 31, June 30, June 30, June 30,
2008 2008 2007 2008 2007
“Core Earnings” securitization adjustments:
Net interest income on securitized loans, before
provisions for loan losses and before
intercompany transactions. . . . . . . . . . . . . . . . $(256) $(194) $(217) $(449) $(432)
Provisions for loan losses . . . . . . . . . . . . . . . . . . 49 44 99 93 146
Net interest income on securitized loans, after
provisions for loan losses, before
intercompany transactions. . . . . . . . . . . . . . . . (207) (150) (118) (356) (286)
Intercompany transactions with off-balance sheet
trusts . . . . . . . . . . . . . . . . . . . . . . . . . . . . . . . (42) (37) (30) (79) (60)
Net interest income on securitized loans, after
provisions for loan losses . . . . . . . . . . . . . . . . (249) (187) (148) (435) (346)
Gains on student loan securitizations . . . . . . . . . — — — — 367
Servicing and securitization revenue . . . . . . . . . . 2 108 133 109 385
Total “Core Earnings” securitization
adjustments(1) . . . . . . . . . . . . . . . . . . . . . . . . . $(247) $ (79) $ (15) $(326) $ 406
(1)
Negative amounts are subtracted from “Core Earnings” net income to arrive at GAAP net income
and positive amounts are added to “Core Earnings” net income to arrive at GAAP net income.
18
19. “Intercompany transactions with off-balance sheet trusts” in the above table relate primarily to losses
incurred through the repurchase of delinquent loans from our off-balance sheet securitization trusts.
When Private Education Loans in our securitization trusts settling before September 30, 2005, become
180 days delinquent, we typically exercise our contingent call option to repurchase these loans at par
value out of the trust and record a loss for the difference in the par value paid and the fair market
value of the loan at the time of purchase. We do not hold the contingent call option for any trusts
settled after September 30, 2005.
2) Derivative Accounting: “Core Earnings” exclude periodic unrealized gains and losses that are caused
primarily by the one-sided mark-to-market derivative valuations prescribed by SFAS No. 133 on
derivatives that do not qualify for “hedge treatment” under GAAP. These unrealized gains and losses
occur in our Lending operating segment, and occurred in our Corporate and Other reportable segment
related to equity forward contracts in the year-ago quarters. In our “Core Earnings” presentation, we
recognize the economic effect of these hedges, which generally results in any cash paid or received
being recognized ratably as an expense or revenue over the hedged item’s life. “Core Earnings” also
exclude the gain or loss on equity forward contracts that under SFAS No. 133, are required to be
accounted for as derivatives and are marked-to-market through earnings.
SFAS No. 133 requires that changes in the fair value of derivative instruments be recognized currently
in earnings unless specific hedge accounting criteria, as specified by SFAS No. 133, are met. We
believe that our derivatives are effective economic hedges, and as such, are a critical element of our
interest rate risk management strategy. However, some of our derivatives, primarily Floor Income
Contracts, certain basis swaps and equity forward contracts (discussed in detail below), do not qualify
for “hedge treatment” as defined by SFAS No. 133, and the stand-alone derivative must be marked-to-
market in the income statement with no consideration for the corresponding change in fair value of the
hedged item. The gains and losses described in “Gains (losses) on derivative and hedging activities,
net” are primarily caused by interest rate and foreign currency exchange rate volatility, changing credit
spreads and changes in our stock price during the period as well as the volume and term of derivatives
not receiving hedge treatment.
Our Floor Income Contracts are written options that must meet more stringent requirements than other
hedging relationships to achieve hedge effectiveness under SFAS No. 133. Specifically, our Floor
Income Contracts do not qualify for hedge accounting treatment because the paydown of principal of
the student loans underlying the Floor Income embedded in those student loans does not exactly match
the change in the notional amount of our written Floor Income Contracts. Under SFAS No. 133, the
upfront payment is deemed a liability and changes in fair value are recorded through income
throughout the life of the contract. The change in the value of Floor Income Contracts is primarily
caused by changing interest rates that cause the amount of Floor Income earned on the underlying
student loans and paid to the counterparties to vary. This is economically offset by the change in value
of the student loan portfolio, including our Retained Interests, earning Floor Income but that offsetting
change in value is not recognized under SFAS No. 133. We believe the Floor Income Contracts are
economic hedges because they effectively fix the amount of Floor Income earned over the contract
period, thus eliminating the timing and uncertainty that changes in interest rates can have on Floor
Income for that period. Prior to SFAS No. 133, we accounted for Floor Income Contracts as hedges
and amortized the upfront cash compensation ratably over the lives of the contracts.
Basis swaps are used to convert floating rate debt from one floating interest rate index to another to
better match the interest rate characteristics of the assets financed by that debt. We primarily use basis
swaps to change the index of our floating rate debt to better match the cash flows of our student loan
assets that are primarily indexed to a commercial paper, Prime or Treasury bill index. In addition, we
use basis swaps to convert debt indexed to the Consumer Price Index to 3 month LIBOR debt.
SFAS No. 133 requires that when using basis swaps, the change in the cash flows of the hedge
effectively offset both the change in the cash flows of the asset and the change in the cash flows of
the liability. Our basis swaps hedge variable interest rate risk, however they generally do not meet this
effectiveness test because most of our FFELP student loans can earn at either a variable or a fixed
19
20. interest rate depending on market interest rates. We also have basis swaps that do not meet the
SFAS No. 133 effectiveness test that economically hedge off-balance sheet instruments. As a result,
under GAAP these swaps are recorded at fair value with changes in fair value reflected currently in
the income statement.
Under SFAS No. 150, “Accounting for Certain Financial Instruments with Characteristics of both
Liabilities and Equity,” equity forward contracts that allow a net settlement option either in cash or the
Company’s stock are required to be accounted for as derivatives in accordance with SFAS No. 133. As
a result, we account for our equity forward contracts as derivatives in accordance with SFAS No. 133
and mark them to market through earnings. They do not qualify as effective SFAS No. 133 hedges, as
a requirement to achieve hedge accounting is the hedged item must impact net income and the
settlement of these contracts through the purchase of our own stock does not impact net income. The
Company settled all of its equity forward contracts in January 2008.
The table below quantifies the adjustments for derivative accounting under SFAS No. 133 on net
income for the quarters ended June 30, 2008, March 31, 2008 and June 30, 2007, and for the six
months ended June 30, 2008 and 2007, when compared with the accounting principles employed in all
years prior to the SFAS No. 133 implementation.
Quarters ended Six months ended
June 30, March 31, June 30, June 30, June 30,
2008 2008 2007 2008 2007
“Core Earnings” derivative adjustments:
Gains (losses) on derivative and hedging
activities, net, included in other income(1) . . . . $362 $(273) $822 $89 $465
Less: Realized (gains) losses on derivative and
hedging activities, net(1) . . . . . . . . . . . . . . . . . 85 (91) 20 (6) 45
Unrealized gains (losses) on derivative and
hedging activities, net. . . . . . . . . . . . . . . . . . . 447 (364) 842 83 510
Other pre-SFAS No. 133 accounting
adjustments . . . . . . . . . . . . . . . . . . . . . . . . . . 4 1 — 4 —
Total net impact of SFAS No. 133 derivative
accounting(2) . . . . . . . . . . . . . . . . . . . . . . . . . $451 $(363) $842 $87 $510
(1)
See “Reclassification of Realized Gains (Losses) on Derivative and Hedging Activities” below for a detailed breakdown of
the components of realized losses on derivative and hedging activities.
(2)
Negative amounts are subtracted from “Core Earnings” net income to arrive at GAAP net income and positive amounts are
added to “Core Earnings” net income to arrive at GAAP net income.
20
21. Reclassification of Realized Gains (Losses) on Derivative and Hedging Activities
SFAS No. 133 requires net settlement income/expense on derivatives and realized gains/losses related
to derivative dispositions (collectively referred to as “realized gains (losses) on derivative and hedging
activities”) that do not qualify as hedges under SFAS No. 133 to be recorded in a separate income
statement line item below net interest income. The table below summarizes the realized losses on
derivative and hedging activities, and the associated reclassification on a “Core Earnings” basis for the
quarters ended June 30, 2008, March 31, 2008 and June 30, 2007 and the six months ended June 30,
2008 and 2007.
Quarters ended Six months ended
June 30, March 31, June 30, June 30, June 30,
2008 2008 2007 2008 2007
Reclassification of realized gains (losses) on
derivative and hedging activities:
Net settlement expense on Floor Income Contracts
reclassified to net interest income . . . . . . . . . . . . . $(175) $(140) $ (9) $(315) $ (16)
Net settlement income (expense) on interest rate
swaps reclassified to net interest income . . . . . . . . 86 231 (11) 317 (29)
Net realized gains (losses) on terminated derivative
contracts reclassified to other income . . . . . . . . . . . 4 — — 4 —
Total reclassifications of realized (gains) losses on
derivative and hedging activities . . . . . . . . . . . . . . (85) 91 (20) 6 (45)
Add: Unrealized gains (losses) on derivative and
hedging activities, net(1) . . . . . . . . . . . . . . . . . . . . . 447 (364) 842 83 510
Gains (losses) on derivative and hedging activities,
net . . . . . . . . . . . . . . . . . . . . . . . . . . . . . . . . . . . . $ 362 $(273) $822 $ 89 $465
(1)
“Unrealized gains (losses) on derivative and hedging activities, net” comprises the following unrealized mark-to-market
gains (losses):
Quarters ended Six months ended
June 30, March 31, June 30, June 30, June 30,
2008 2008 2007 2008 2007
Floor Income Contracts . . . . . . . . . . . . . . . . . . . . . . $ 569 $(295) $ 81 $ 274 $ 86
Equity forward contracts . . . . . . . . . . . . . . . . . . . . . . — — 796 — 384
Basis swaps . . . . . . . . . . . . . . . . . . . . . . . . . . . . . . (157) (132) (38) (289) 22
Other . . . . . . . . . . . . . . . . . . . . . . . . . . . . . . . . . . 35 63 3 98 18
Total unrealized gains (losses) on derivative and hedging
activities, net . . . . . . . . . . . . . . . . . . . . . . . . . . . . $ 447 $(364) $842 $ 83 $510
Unrealized gains and losses on Floor Income Contracts are primarily caused by changes in interest
rates. In general, an increase in interest rates results in an unrealized gain and vice versa. Unrealized
gains and losses on equity forward contracts fluctuate with changes in the Company’s stock price.
Unrealized gains and losses on basis swaps result from changes in the spread between indices,
primarily as it relates to Consumer Price Index (“CPI”) swaps economically hedging debt issuances
indexed to CPI and on changes in the forward interest rate curves that impact basis swaps hedging
repricing risk between quarterly reset debt and daily reset assets.
21
22. 3) Floor Income: The timing and amount (if any) of Floor Income earned in our Lending operating
segment is uncertain and in excess of expected spreads. Therefore, we exclude such income from
“Core Earnings” when it is not economically hedged. We employ derivatives, primarily Floor Income
Contracts and futures, to economically hedge Floor Income. As discussed above in “Derivative
Accounting,” these derivatives do not qualify as effective accounting hedges, and therefore, under
GAAP, they are marked-to-market through the “gains (losses) on derivative and hedging activities,
net” line in the consolidated statement of income with no offsetting gain or loss recorded for the
economically hedged items. For “Core Earnings,” we reverse the fair value adjustments on the Floor
Income Contracts and futures economically hedging Floor Income and include the amortization of net
premiums received in income.
The following table summarizes the Floor Income adjustments in our Lending operating segment for
the quarters ended June 30, 2008, March 31, 2008 and June 30, 2007 and for the six months ended
June 30, 2008 and 2007.
Quarters ended Six months ended
June 30, March 31, June 30, June 30, June 30,
2008 2008 2007 2008 2007
“Core Earnings” Floor Income adjustments:
Floor Income earned on Managed loans, net of
payments on Floor Income Contracts . . . . . . . . . . . $ 25 $ 32 $— $ 58 $—
Amortization of net premiums on Floor Income
Contracts and futures in net interest income . . . . . . (44) (38) (39) (82) (78)
(1)
Total “Core Earnings” Floor Income adjustments .. $(19) $ (6) $(39) $(24) $(78)
(1)
Negative amounts are subtracted from “Core Earnings” net income to arrive at GAAP net income and positive amounts are
added to “Core Earnings” net income to arrive at GAAP net income.
4) Acquired Intangibles: Our “Core Earnings” exclude goodwill and intangible impairment and the
amortization of acquired intangibles. For the quarters ended June 30, 2008, March 31, 2008 and
June 30, 2007, goodwill and intangible impairment and the amortization of acquired intangibles
totaled $15 million, $15 million and $17 million, respectively, and for the six months ended June 30,
2008 and 2007, totaled $31 million and $40 million, respectively. We did not recognize any
impairment in the current, prior or year-ago quarters.
22
23. LENDING BUSINESS SEGMENT
In our Lending business segment, we originate and acquire federally guaranteed student loans and Private
Education Loans, which are not federally guaranteed. Typically a Private Education Loan is made in
conjunction with a FFELP Stafford loan and as a result is marketed through the same marketing channels as
FFELP Stafford loans. While FFELP loans and Private Education Loans have different overall risk profiles
due to the federal guarantee of the FFELP loans, they share many of the same characteristics such as similar
repayment terms, the same marketing channel and sales force, and are originated and serviced on the same
servicing platform. Finally, where possible, the borrower receives a single bill for both FFELP and Private
Education Loans.
As a result of the significant changes brought about by the legislative changes in the CCRAA, along with
the impact of the credit environment, the student loan market place is undergoing significant change. As a
result of these changes, over 160 lenders announced their withdrawal from the federal student loan
marketplace. In addition, substantially all other lenders have altered their student loan offerings including the
elimination of certain borrower benefits and the elimination of premiums paid on secondary market loan
purchases. Finally many FFELP lenders, excluding Sallie Mae, have made other significant changes which will
dramatically reduce the loan volume they will originate this academic year. These conditions have also led a
number of schools to switch to the FDLP.
As a result, of CCRAA, it is no longer economical to purchase loans at historical premiums from our
preferred channel clients. Therefore, some clients decided to continue to sell loans to us at lower premiums,
some became third-party serviced clients, and most decided to exit the business. Given current market
conditions, we expect that the loan volume impacted by lender decisions to exit the business will be either
(1) originated through our internal brands; (2) absorbed by other lenders or (3) transferred to the FDLP.
The current funding and credit spread environment has made FFELP loan lending uneconomic. As a
result, Congress passed the Ensuring Continued Access to Student Loans Act of 2008 (the “Act”) to give
lenders the ability to continue lending this academic year. In connection with this Act, ED has announced its
proposal of two programs to ensure that FFELP loans are available this academic year (see “LIQUIDITY
AND CAPITAL RESOURCES — ED’s Loan Purchase Commitment and Loan Participation Programs”). ED
has indicated that these proposals will be finalized and implemented shortly.
23