The Erie Indemnity Company reported lower net income in the first quarter of 2006 compared to the same period in 2005, due to growth in management fee revenue being outpaced by growth in management operation costs. Direct written premiums for the Property and Casualty Group declined slightly while new written premium increased. The combined ratio for the Property and Casualty Group improved slightly. Investment income declined due to lower realized gains, while the Company continued share repurchases and dividend payments to shareholders in the quarter.
1. ERIE INDEMNITY COMPANY
2006 FIRST QUARTER
SHAREHOLDERS’ REPORT
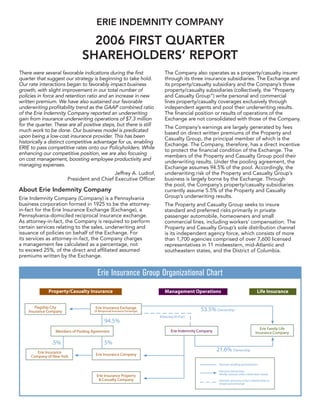
There were several favorable indications during the first The Company also operates as a property/casualty insurer
quarter that suggest our strategy is beginning to take hold. through its three insurance subsidiaries. The Exchange and
Our rate interactions began to favorably impact business its property/casualty subsidiary and the Company’s three
growth, with slight improvement in our total number of property/casualty subsidiaries (collectively, the “Property
policies in force and retention ratio and an increase in new and Casualty Group”) write personal and commercial
written premium. We have also sustained our favorable lines property/casualty coverages exclusively through
underwriting profitability trend as the GAAP combined ratio independent agents and pool their underwriting results.
of the Erie Indemnity Company reported an underwriting The financial position or results of operations of the
gain from insurance underwriting operations of $7.3 million Exchange are not consolidated with those of the Company.
for the quarter. These are all positive steps, but there is still The Company’s earnings are largely generated by fees
much work to be done. Our business model is predicated based on direct written premiums of the Property and
upon being a low-cost insurance provider. This has been Casualty Group, the principal member of which is the
historically a distinct competitive advantage for us, enabling Exchange. The Company, therefore, has a direct incentive
ERIE to pass competitive rates onto our Policyholders. While to protect the financial condition of the Exchange. The
enhancing our competitive position, we are also focusing members of the Property and Casualty Group pool their
on cost management, boosting employee productivity and underwriting results. Under the pooling agreement, the
managing expenses. Exchange assumes 94.5% of the pool. Accordingly, the
Jeffrey A. Ludrof, underwriting risk of the Property and Casualty Group’s
President and Chief Executive Officer business is largely borne by the Exchange. Through
the pool, the Company’s property/casualty subsidiaries
About Erie Indemnity Company currently assume 5.5% of the Property and Casualty
Group’s underwriting results.
Erie Indemnity Company (Company) is a Pennsylvania
business corporation formed in 1925 to be the attorney- The Property and Casualty Group seeks to insure
in-fact for the Erie Insurance Exchange (Exchange), a standard and preferred risks primarily in private
Pennsylvania-domiciled reciprocal insurance exchange. passenger automobile, homeowners and small
As attorney-in-fact, the Company is required to perform commercial lines, including workers’ compensation. The
certain services relating to the sales, underwriting and Property and Casualty Group’s sole distribution channel
issuance of policies on behalf of the Exchange. For is its independent agency force, which consists of more
its services as attorney-in-fact, the Company charges than 1,700 agencies comprised of over 7,600 licensed
a management fee calculated as a percentage, not representatives in 11 midwestern, mid-Atlantic and
to exceed 25%, of the direct and affiliated assumed southeastern states, and the District of Columbia.
premiums written by the Exchange.
Erie Insurance Group Organizational Chart
2. Corporate Information
Financial Information Stock Transfer Agent
The Erie Indemnity Company submits a quarterly report American Stock Transfer & Trust Company
to the Securities and Exchange Commission on Form 59 Maiden Lane
10-Q. Shareholders may obtain a copy of the Form 10-Q Plaza Level
report without charge by writing to: Chief Financial New York, NY 10038
Officer, Erie Indemnity Company, 100 Erie Insurance (800) 937-5449
Place, Erie, PA, 16530 or by visiting the Company’s Web
Corporate Headquarters
site at www.erieinsurance.com.
100 Erie Insurance Place
Common Stock Information Erie, PA 16530
The Erie Indemnity Company’s Class A, non-voting (814) 870-2000
common stock is traded on the NASDAQ Stock Market
Internet Address
under the symbol “ERIE.” Quotations are available via
major financial news sources. Financial statement filings, shareholder information, press
releases and general news about the Company may also
be accessed at: www.erieinsurance.com.
Erie Indemnity Company First Quarter 2006 Results
Highlights of the first quarter 2006 results of the Erie percent resulted in $9.4 million more in management
Indemnity Company (Company) are as follows: fee revenue for the quarter ended March 31, 2006, or
an increase in net income of $.09 per share-diluted.
* Net income decreased by 14.4 percent to $49.5
The management fee rate was 23.75 percent in the first
million, from $57.8 million at March 31, 2005, due to
quarter of 2005.
modest growth in management fee revenue which was
outpaced by the growth in the cost of management The direct written premiums of the Property and
operations. Casualty Group, upon which management fee revenue is
calculated, totaled $942.8 million in the first quarter 2006,
* Net income per share decreased to $.73 per share,
compared to $971.8 million in the first quarter 2005, a
compared to $.83 per share in the comparable quarter
3.0 percent decline. New written premium increased 3.3
for 2005.
percent, to $86.6 million at March 31, 2006 compared to
* Management fee revenue grew by 1.1 percent to $83.8 million at March 31, 2005. Year-over-year policies in
$232.9 million, up from $230.4 million for the same force increased 0.1 percent at March 31, 2006.
period one year ago.
The year-over-year average written premium per policy
* The Property and Casualty Group’s direct written declined by 2.1 percent to $1,044 at March 31, 2006, as
premium declined 3.0 percent to $942.8 million at compared to $1,066 at March 31, 2005. The decline is a
March 31, 2006, from $971.8 million at March 31, result of rate reductions and several new rate interactions,
2005. New written premium in the first quarter of 2006 including segmented pricing, a safe driver discount, a
increased 3.3 percent over 2005 results. new multi-policy discount associated with life insurance
purchases and a new payment plan discount. Year-over-
* The Property and Casualty Group’s adjusted statutory
year personal lines premium decreased 4.5 percent, while
combined ratio for the first quarter 2006, which
commercial lines remained flat at March 31, 2006. The
removes the profit portion of the management fee
year-over-year policy retention rate improved to 88.8
earned by the Company, was 82.3 percent, compared
percent at March 31, 2006, from 88.3 percent at March
to 81.4 percent a year earlier.
31, 2005.
* The Company’s reported GAAP combined ratio was
Pricing actions and estimates approved, filed and
86.5 percent for the first quarter of 2006, versus 88.4
contemplated for filing during 2006, are anticipated to
percent for the same quarter in 2005, yielding an
reduce direct written premiums by $114.6 million, of
underwriting gain of $7.3 million for the first quarter
which approximately $26.8 million occurred in the first
2006, compared to an underwriting gain of $6.2 million
quarter of 2006. Included in the total 2006 reduced
in the first quarter of 2005.
premiums is $35.3 million related to the carryover impact
of pricing actions approved and effective in 2005. These
Management operations
pricing actions are being implemented to further enhance
Management fee revenue increased by 1.1 percent to the competitive position of ERIE products.
$232.9 million for the quarter ended March 31, 2006,
The cost of management operations increased 9.1
compared to $230.4 million for the same period one year
percent to $193.8 million in the first quarter of 2006, from
ago. The higher management fee rate in 2006 of 24.75
2
3. $177.7 million for the same period in 2005. Commission incurred but not reported reserves related to seasonality
costs increased 6.3 percent to $134.1 million, from adjustments was $2.3 million, compared to $2.7 million in
$126.2 million in the first quarter 2005. An increase in the first quarter of 2005. Catastrophe losses resulted in a
agent bonus expense of $9.5 million, resulting from the 0.6 point increase in the first quarter statutory combined
improvements in underwriting profitability, impacted ratio of the Property and Casualty Group compared to 0.5
commission costs for the first quarter of 2006. points in catastrophe losses for the same period in 2005.
These first quarter amounts are below the Property and
First quarter costs of management operations within Erie
Casualty Group’s historical norm for catastrophe losses.
Indemnity Company, excluding commissions, increased
The ten year historical average of catastrophe losses
15.9 percent to $59.7 million in 2006, from $51.5 million
has contributed 3.0 percentage points to the Group’s
in 2005. Personnel costs increased 15.3 percent as a
statutory combined ratio on an annual basis.
result of higher average pay rates and higher estimates
of future payouts for management incentive plans that In April, the Company announced it would cease
were influenced by the significant improvement in the development of ERIEConnection, a personal lines policy
Company’s underwriting profitability over the past three administration and Web-based agency interface system.
years. The cost of using insurance scoring on all new and As a result, the Company incurred a charge to net income
renewal business also impacted other operating costs and of about $1.3 million or $.02 per share in the quarter
totaled $1.0 million in the first quarter of 2006, compared ended March 31, 2006. The Company is now focusing
to $0.5 million in the first quarter of 2005. Insurance on a strategy to surround current personal lines policy
scoring was initially used for pricing purposes in March systems with component-based enhancements for policy
2005 for new business and in April 2005 for renewal management and agency interface, while continuing plans
business. The first quarter of 2006 includes a full quarter’s to begin deployment of a Web-based system on a pilot
expense for insurance scoring on new and renewal basis for commercial lines business in May.
business. The statutory combined ratio for the Property and
Maintaining a low-cost position within the industry is Casualty Group included 4 points in the first quarter of
essential to enhancing ERIE’s competitiveness, remaining 2006 from writing off the ERIEConnection assets.
attractive to the Company’s agency distribution system
Investment operations
and producing revenue growth. The Company has
developed a plan to control non-commission expense Net revenue from investment operations for the first
levels of the ERIE Group of companies in 2006 to a quarter of 2006 reflects a decrease of 9.9 percent to
6.0 percent increase over 2005 operating expense. $20.6 million, compared to $22.8 million for the same
For the Company that translates to an increase in non- period in 2005.
commission management expenses of 9.0 percent. The
Net realized gains on investments of $0.8 million were
Company’s cost management plan calls for a strategic
recorded during the first quarter 2006, compared to net
review of functional expenses and for balancing workforce
realized gains of $5.5 million for the first quarter 2005.
requirements with business needs.
Net realized gains on investments included impairment
Insurance underwriting operations charges of $.9 million on fixed maturities and $1.1 million
on equity securities in the first quarter of 2006. In the first
The Company’s insurance underwriting operations quarter of 2005, impairment charges of $1.4 million were
recorded gains of $7.3 million in the first quarter of 2006, recorded on fixed maturities and $0.1 million on equity
compared to $6.2 million in the first quarter of 2005. securities. Equity in earnings of limited partnerships
The Company’s share of catastrophe losses totaled $0.3 was $4.1 million and $2.1 million for the quarters ended
million for the three-month periods ended March 31, March 31, 2006, and 2005, respectively. Private equity
2006, and 2005. The GAAP combined ratio for the and mezzanine debt limited partnerships generated
Company in the first quarter 2006 was 86.5, compared to earnings of $2.0 million and $1.1 million for the three
88.4 for the same period in 2005. months ended March 31, 2006, and 2005, respectively.
The adjusted statutory combined ratio for the Property Real estate limited partnerships generated earnings
and Casualty Group for the first quarter 2006 was 82.3, of $1.5 million and $1.0 million in the first quarters of
compared to 81.4 for the first quarter 2005. Continued 2006 and 2005, respectively. Market value adjustments
favorable development of losses on prior years, excluding contributed $0.6 million to the total earnings of limited
salvage and subrogation recoveries, improved the partnerships in the first quarter of 2006. The Company’s
Group’s combined ratio by 7.9 points in the first quarter earnings from its 21.6 percent equity ownership of Erie
of 2006 and 4.9 points in the first quarter of 2005. The Family Life totaled $0.7 million for the first quarter of
first quarter of the year typically has the lowest non- 2006, compared to $0.8 million in the first quarter 2005.
catastrophe loss results of the year. Catastrophe losses
Liquidity and capital resources
incurred by the Property and Casualty Group were
not significant and therefore the lower claim volume, As part of its capital management activities, the Exchange
coupled with improving underwriting, resulted in has undertaken an offer to acquire the balance of Erie
seasonally low losses for the quarter ended March 31, Family Life’s common stock at $32.00 per share in cash
2006. Underwriting losses are seasonally higher in the during the second quarter of 2006. The Exchange
second and fourth quarters and, as a consequence, the currently owns 53.5% of the outstanding common stock
Company’s property/casualty combined ratio generally of EFL. The aggregate consideration for the outstanding
increases as the year progresses. In the first quarter EFL shares would be approximately $75 million. The
of 2006, the Company’s share of the reduction to Exchange intends to complete the transaction as soon
3
4. as practicable. The Company’s 21.6% stake in EFL will be the Company and Black Interests Limited Partnership. The
unaffected by this transaction. 260 shares of class B voting stock represent 9.2 percent of
the outstanding Class B voting stock of the Company.
Dividends paid to shareholders totaled $22.2 million
in the first quarter of 2006 and $20.6 million in the first Erie Indemnity Company provides management services
quarter of 2005. to the member companies of the Erie Insurance Group,
which includes the Erie Insurance Exchange, Flagship
During the first quarter of 2006, the Company
City Insurance Company, Erie Insurance Company, Erie
repurchased 772,447 shares of its outstanding Class A
Insurance Property and Casualty Company, Erie Insurance
common stock in conjunction with the stock repurchase
Company of New York and Erie Family Life Insurance
plan that was authorized in December 2003. The shares
Company.
were purchased at a total cost of $40.7 million. The plan
allows the Company to repurchase up to $250 million of
its outstanding Class A common stock through December “Safe Harbor” Statement Under the Private Securities
31, 2006. In February 2006, the Company’s Board Litigation Reform Act of 1995: Certain forward-looking
approved a continuation of the current stock program, statements contained herein involve risks and uncertainties.
allowing the Company to repurchase an additional These statements include certain discussions relating to
$250 million of its Class A common stock through management fee revenue, cost of management operations,
underwriting, premium and investment income volume, business
December 31, 2009. At March 31, 2006, a total of $306
strategies, profitability and business relationships and the
million repurchase authority remains.
Company’s other business activities during 2006 and beyond.
Additionally, subsequent to quarter end, on May 1, In some cases, you can identify forward-looking statements
2006, the Company entered into a definitive agreement by terms such as “may,” “will,” “should,” “could,” “would,”
with Black Interests Limited Partnership to repurchase “expect,” “plan,” “intend,” “anticipate,” “believe,” “estimate,”
“project,” “predict,” “potential” and similar expressions. These
1,844,604 shares of Class A non-voting common stock of
forward-looking statements reflect the Company’s current
the Company (which included 260 shares of Class B voting
views about future events, are based on assumptions and are
stock required to be converted into 624,000 non-voting
subject to known and unknown risks and uncertainties that may
shares) for $106,000,000 under the Company’s previously
cause results to differ materially from those anticipated in those
authorized share repurchase program. The shares were statements. Many of the factors that will determine future events
purchased in a privately negotiated transaction between or achievements are beyond our ability to control or predict.
4
5. CONSOLIDATED STATEMENTS OF OPERATIONS
(Dollars in thousands, except in per share data)
Three months ended
March 31
2006 2005
(unaudited)
Operating revenue
Management fee revenue—net $ 220,102 $ 217,736
Premiums earned 54,026 53,648
Service agreement revenue 7,592 4,787
Total operating revenue 281,720 276,171
Operating expenses
Cost of management operations 183,154 167,940
Losses and loss adjustment expenses incurred 30,053 32,677
Policy acquisition and other underwriting expenses 14,501 11,844
Total operating expenses 227,708 212,461
Investment income—unaffiliated
Investment income, net of expenses 15,000 14,468
Net realized gains on investments 784 5,497
Equity in earnings of limited partnerships 4,142 2,111
Total investment income—unaffiliated 19,926 22,076
Income before income taxes and equity in earnings of
Erie Family Life Insurance Company 73,938 85,786
Provision for income taxes 25,077 28,729
Equity in earnings of Erie Family Life Insurance
Company, net of tax 605 714
Net income $ 49,466 $ 57,771
Net income per share—basic
$ 0.81 $ 0.91
Class A common stock
$ 121.08 $ 138.84
Class B common stock
Net income per share—diluted $ 0.73 $ 0.83
Weighted average shares outstanding
Basic:
Class A common stock 60,630,395 62,926,683
Class B common stock 2,833 2,851
Diluted shares 67,505,125 69,845,958
Dividends declared per share
Class A common stock $ 0.36 $ 0.325
Class B common stock $ 54.00 $ 48.75
5
6. CONSOLIDATED STATEMENTS OF OPERATIONS—SEGMENT BASIS
(Dollars in thousands, except in per share data)
Three months ended
March 31
2006 2005
(unaudited)
Management operations
Management fee revenue $ 232,935 $ 230,409
Service agreement revenue 7,592 4,787
Total revenue from management operations 240,527 235,196
Cost of management operations 193,825 177,714
Income from management operations 46,702 57,482
Insurance underwriting operations
Premiums earned 54,026 53,648
Losses and loss adjustment expenses incurred 30,053 32,677
Policy acquisition and other underwriting expenses 16,663 14,742
Total losses and expenses 46,716 47,419
Underwriting gain 7,310 6,229
Investment operations
Investment income, net of expenses 15,000 14,468
Net realized gains on investments 784 5,497
Equity in earnings of limited partnerships 4,142 2,111
Equity in earnings of Erie Family Life Insurance Company 651 767
Net revenue from investment operations 20,577 22,843
Income before income taxes 74,589 86,554
Provision for income taxes 25,123 28,783
Net income $ 49,466 $ 57,771
Net income per share—Class A basic $ 0.81 $ 0.91
Net income per share—Class B basic $ 121.08 $ 138.84
Net income per share—diluted $ 0.73 $ 0.83
Weighted average shares outstanding—diluted 67,505 69,846
Amounts presented on a segment basis are presented gross of intercompany/intersegment items
6
7. RECONCILIATION OF OPERATING INCOME TO NET INCOME
Definition of Non-GAAP and Operating
Measures
management services, insurance underwriting and
Management believes that investors’ understanding
investment operations that may be obscured by
of the Company’s performance is enhanced by the
the net effects of realized capital gains and losses.
disclosure of the following non-GAAP financial measure.
Realized capital gains and losses may vary significantly
The Company’s method of calculating this measure may
between periods and are generally driven by business
differ from those used by other companies and, therefore,
decisions and economic developments such as capital
comparability may be limited.
market condition, the timing of which is unrelated to
Operating income is net income excluding realized
management services and the insurance underwriting
capital gains and losses and related federal income
processes of the Company. The Company believes it
taxes. Equity in earnings or losses of Erie Family Life
is useful for investors to evaluate these components
Insurance Company and equity in earnings or losses of
separately and in the aggregate when reviewing the
limited partnerships are not excluded from the calculation
Company’s performance. The Company is aware that the
of operating income. Both of these categories include
price to earnings multiple commonly used by investors
the respective investment’s realized capital gains and
as a forward-looking valuation technique uses operating
losses, as well as unrealized gains and losses, as these
income as the denominator. Operating income should
investments are accounted for under the equity method.
not be considered as a substitute for net income and
Net income is the GAAP measure that is most directly does not reflect the overall profitability of the Company’s
comparable to operating income. business.
The Company uses operating income to evaluate the The following table reconciles operating income and net
results of operations. It reveals trends in the Company’s income for the periods ended March 31, 2006, and 2005:
Three months ended
March 31
(in thousands) (unaudited)
2006 2005
Operating income $ 48,956 $ 54,199
Net realized gains on investments 784 5,497
Income tax expense on realized gains ( 274) ( 1,925)
Realized gains, net of income tax expense 510 3,572
Net income $ 49,466 $ 57,771
Three months ended
March 31
(per share information—diluted) (unaudited)
2006 2005
Operating income $ 0.72 $ 0.78
Net realized gains on investments 0.01 0.08
Income tax expense on realized gains 0.00 ( 0.03)
Realized gains, net of income tax expense 0.01 0.05
Net income $ 0.73 $ 0.83
7